

In this week’s ‘UK Property Market Stats Show’, Chris Watkin and special guest Ben Madden discuss the ups and downs of Week 29’s UK property market (week ending Sunday, 21st July 2024).
The headlines for Week 29 of 2024 are as follows:
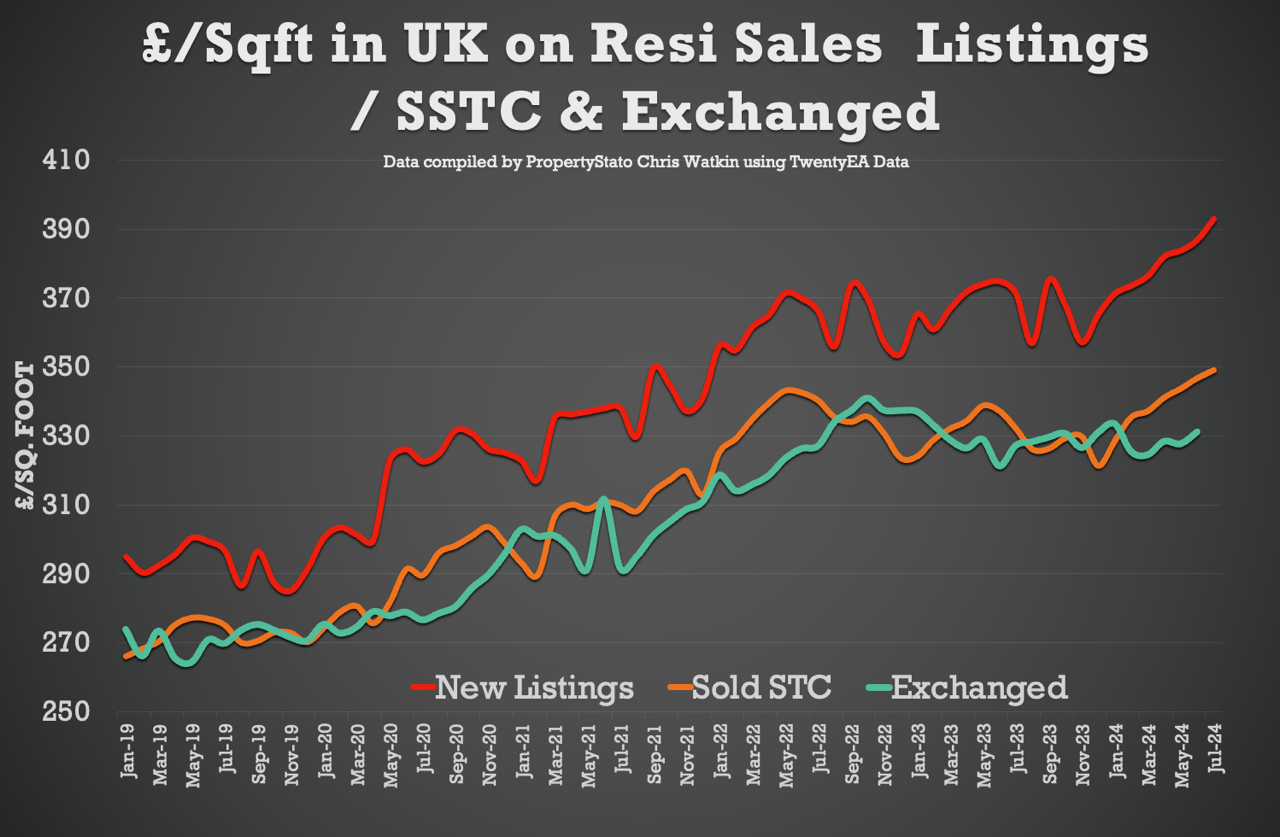
+ UK House prices on Homes sold (stc) in July continue to remain strong at £349/sq.ft – 6% higher than Jan 2024
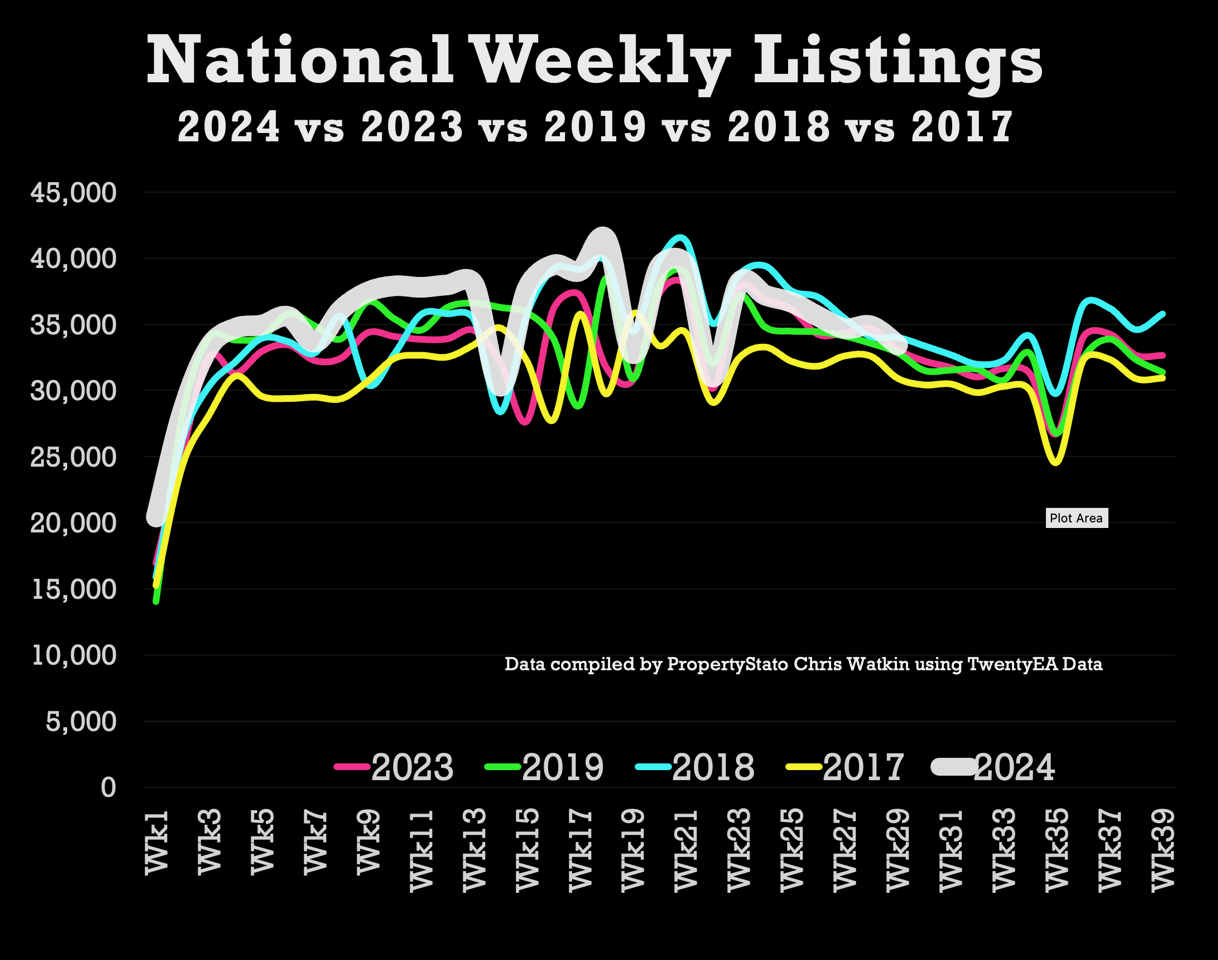
+ Listings – 33.4k UK listings this week. 7% higher YTD than 2017/18/19 YTD average
+ Total Gross Sales – 24.3k – 6.7% higher than 2017/18/19 YTD levels & 10.7% higher than 2023 YTD levels
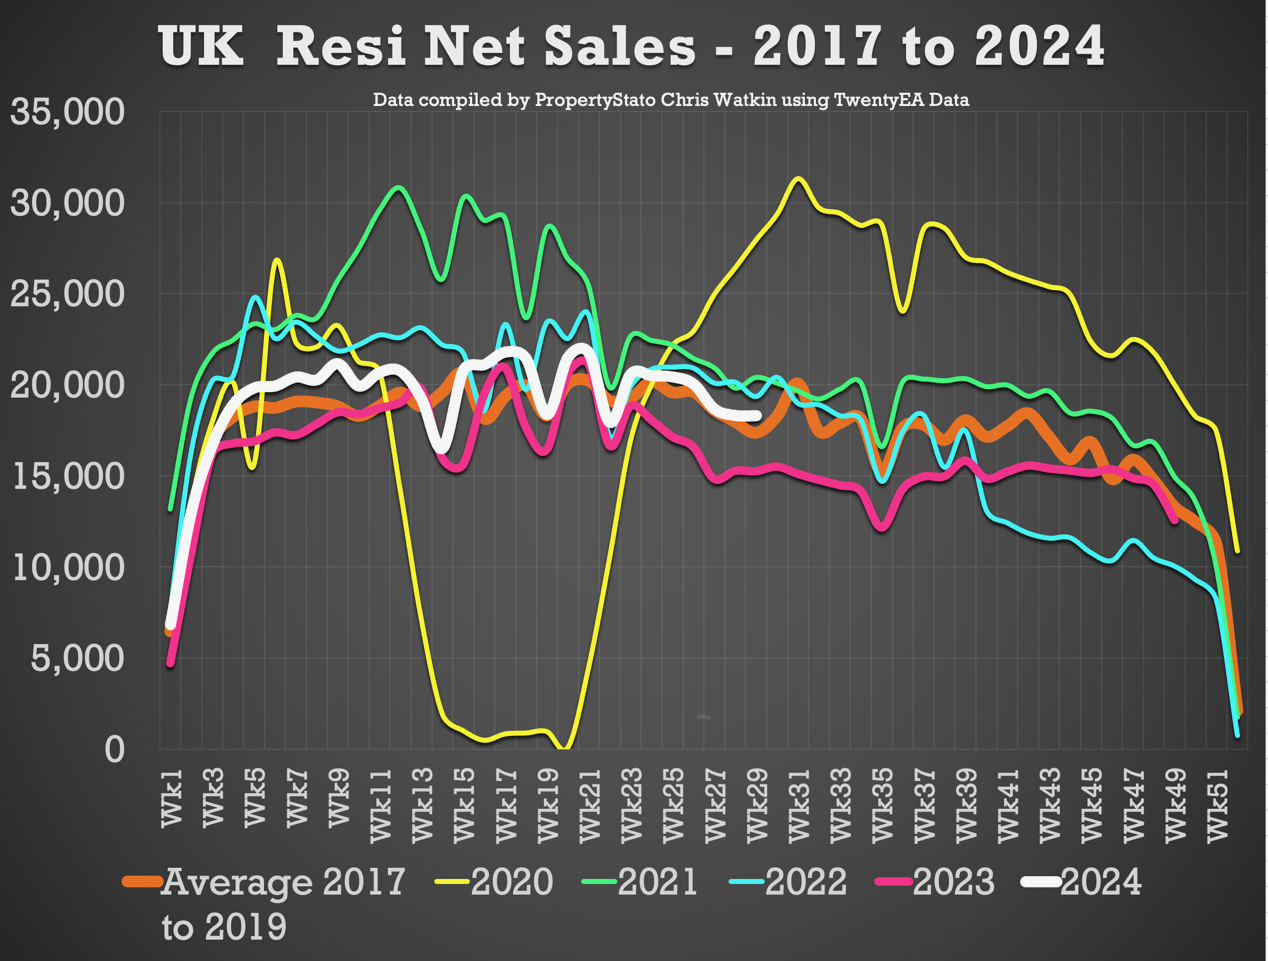
+ Net Sales – 18.3k this week, 20% higher than the same week in 2023
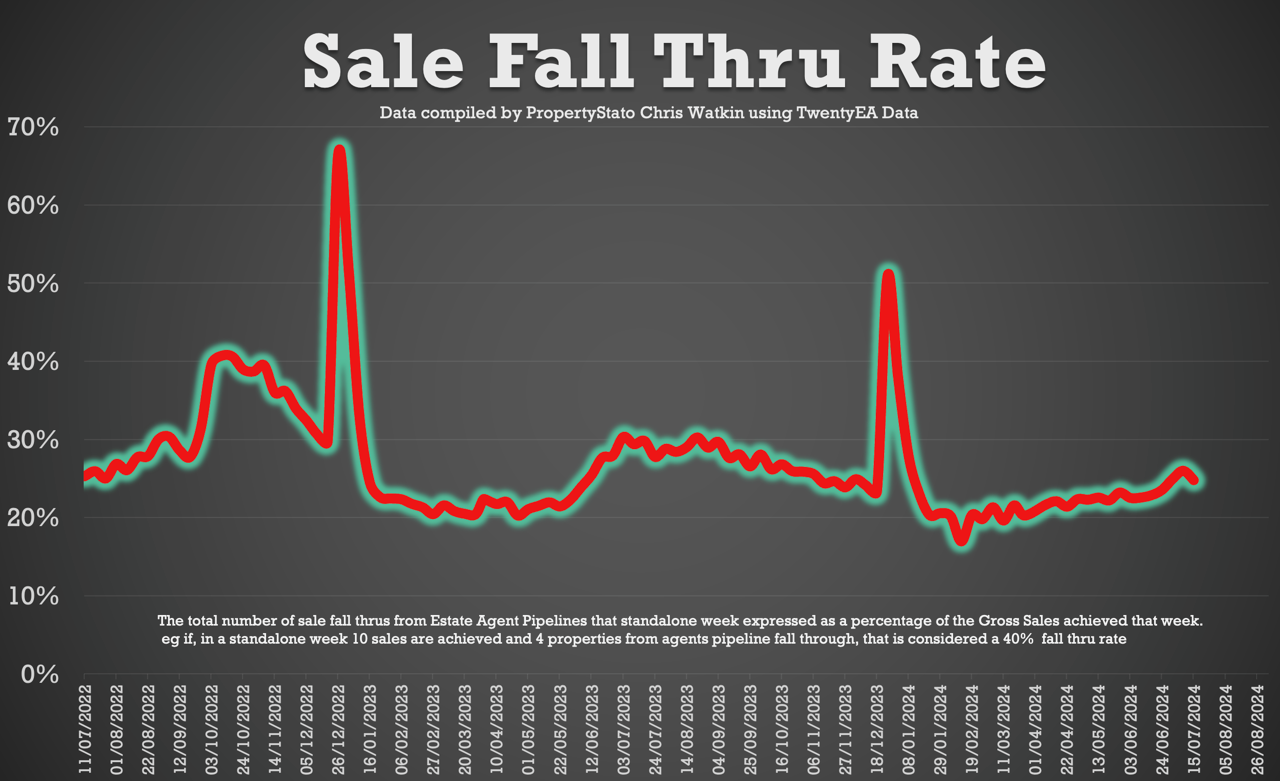
+ Sale fall-throughs – Only fly in the ointment is sale fall thru rate. In the spring it was an average of 21%. For the last month it’s been 24.8%. This week it was 24.78% – yet, everything in context, the seven-year Long Term Average is 24.8% and it was 40%+ in the Truss budget
Chris’s In-Depth Analysis (Week 29):
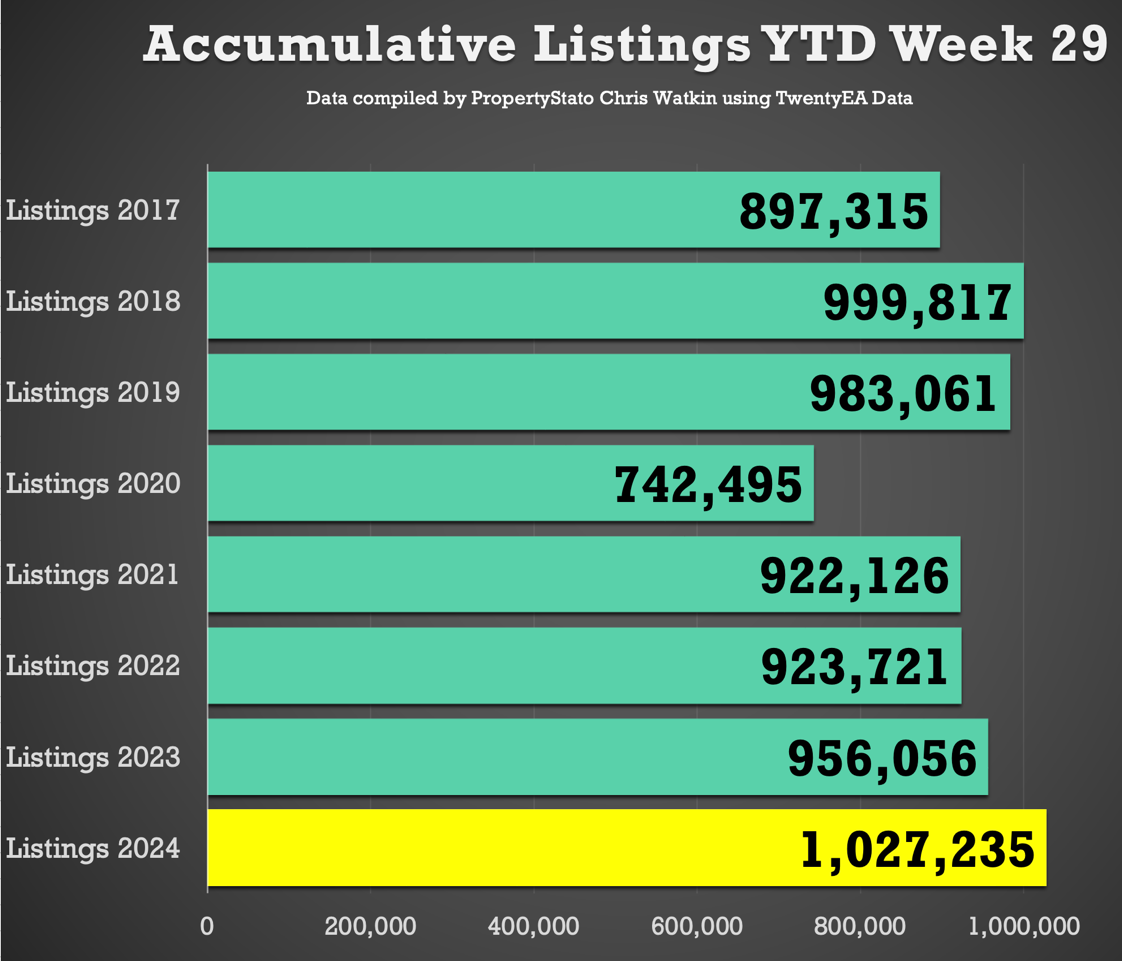
New Properties to Market: The UK saw 33,420 new listings, which is in line with the steady driving off of weekly listings earlier in the year (see the listings graphs). This year’s YTD listings stand at 1,027,235, 10.3% higher than the historical eight-year YTD average of 960,064, 7% higher than YTD 2017/18/19 and 7.4% higher YTD 2023. Just FYI – Weekly 2024 average: 35,422.
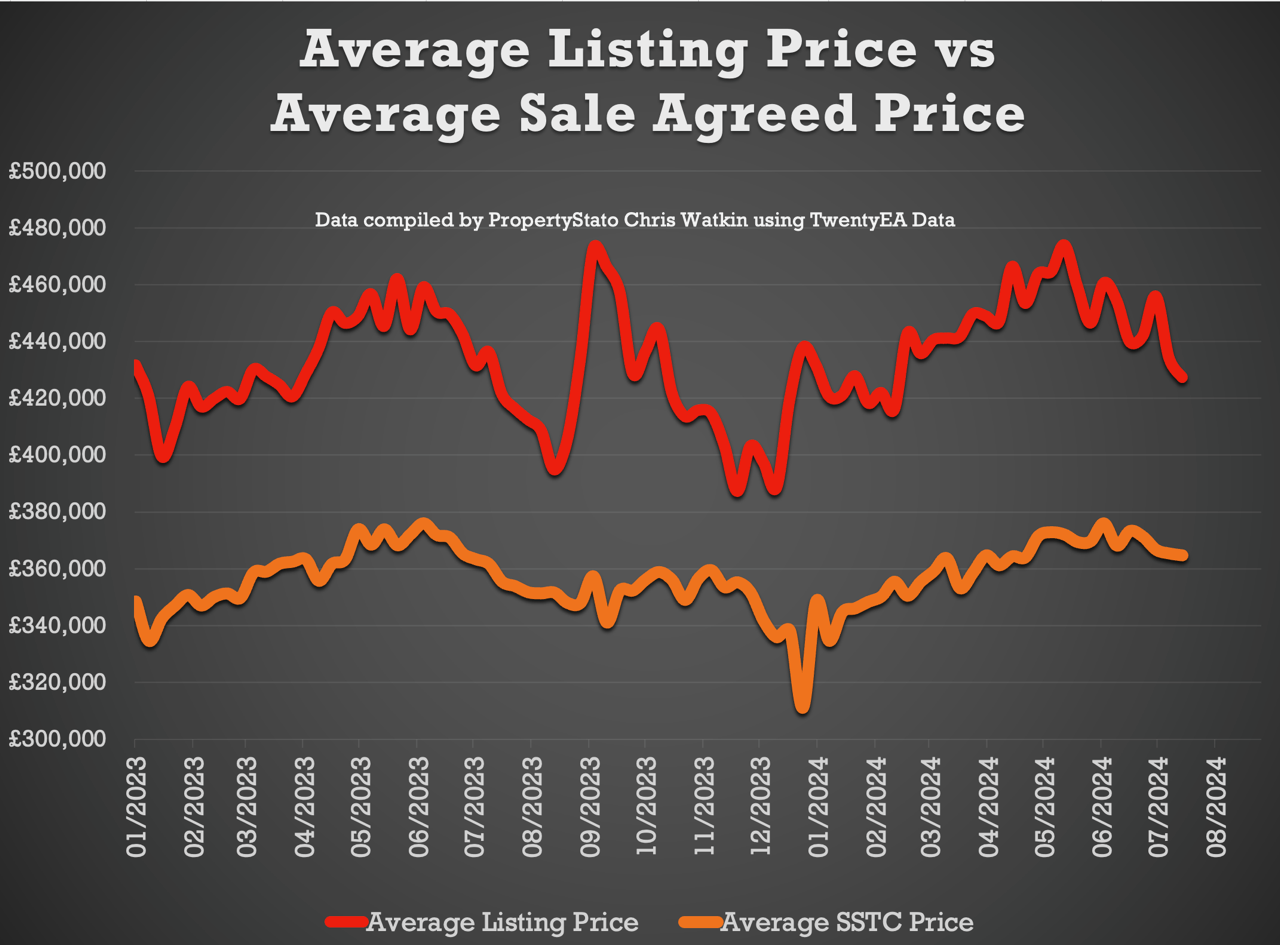
Average Listing Price: £427,465.
Average Asking Price of this week’s Listings vs Average Asking Price of the Properties that Sale Agreed this week: 17.2%. Good to see it’s not been the 20%’s for a few weeks. The long-term average is between 16% and 17%.
Price Reductions: This week, 23,484 properties saw price reductions, higher compared to the eight-year Week 27 average of 17,603. Yet there are higher stock levels. Stock June levels are at 700,524. This means one in seven properties each month are being reduced.
Average Asking Price for Reduced Properties: £406,209.
Gross Sales: 24,322 properties were sold STC last week (eight-year week 29 average: 24,714 and 2024 weekly average: 24,659 Gross Sales).
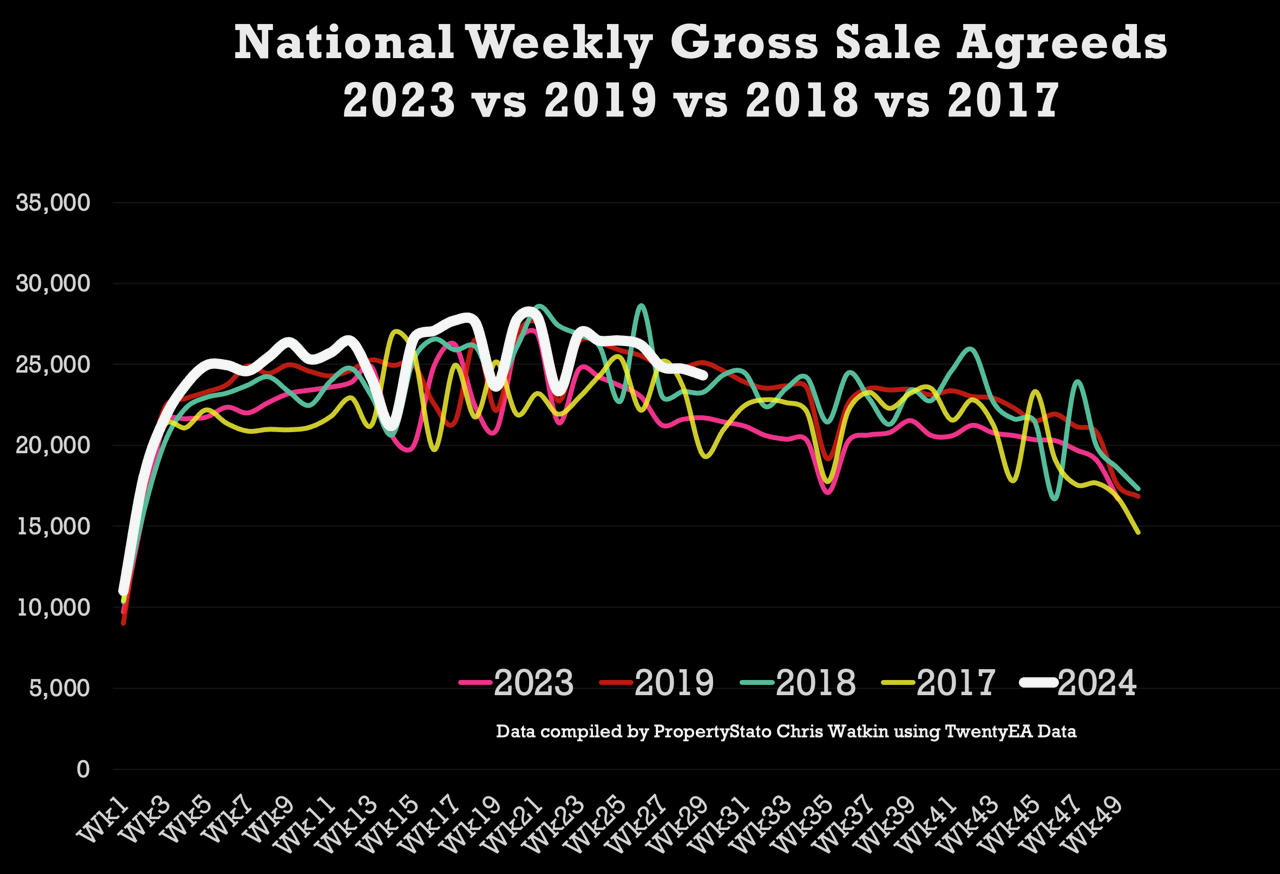
Accumulative Gross Sales YTD: The total YTD stands at 715,114, exceeding the average YTD Gross sales figure of 670,318 from 2017/18/19 and 646,182 in the same week 29 in 2023.
Average Asking Price of Sold STC Properties: Still staying in the mid £360/380k range (like has been for two years) at £364,720.
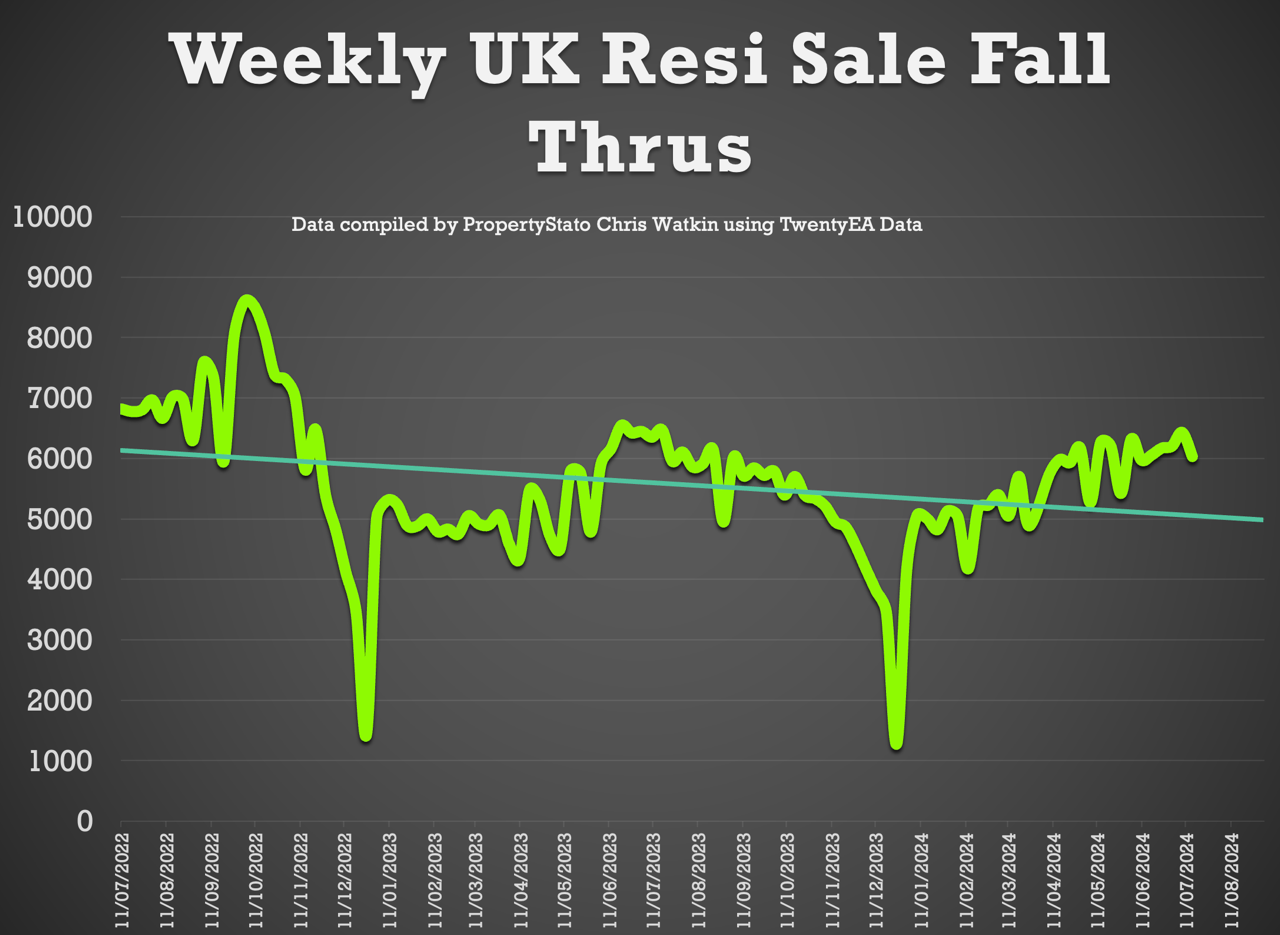
Sale Fall Throughs: Fall throughs this week at 6,030. Last three months weekly average 6,033.
Sale Fall Through % Rate: 24.79% for week 29. (Comparison – 23.18% for the last three months, whilst the long-term eight-year average is 24.8% and it was 40%+ in Q4 2022 –- the Truss budget!).
Net Sales (gross sales this week less fall throughs this week) – 18,292.
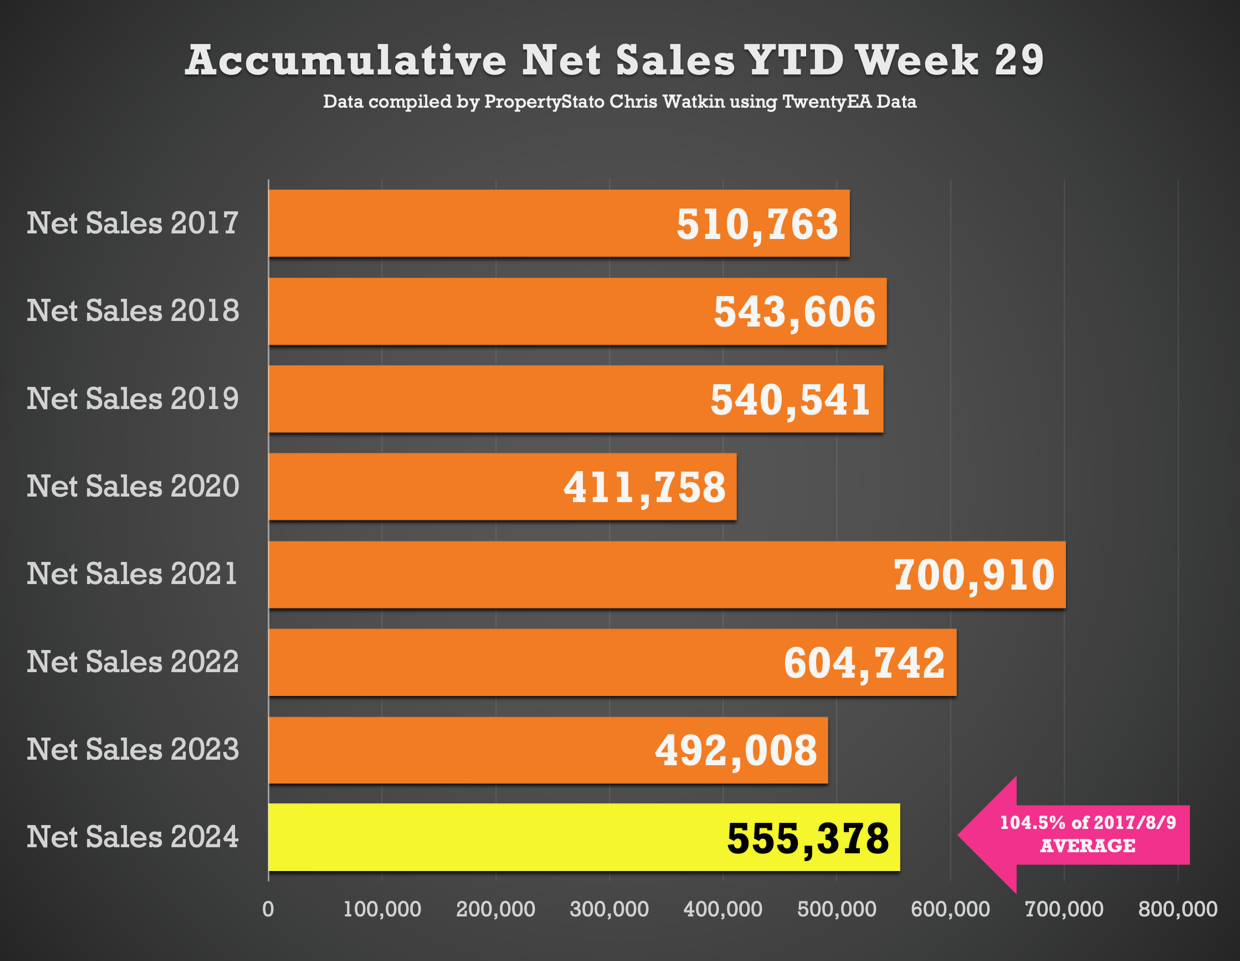
Accumulative Net Sales YTD: The total stands at 555,378, 4.5% higher the 17/18/19 YTD Net sales average (531,637) and 12.9% higher than the YTD figure for 2023 for Net Sales (492,008).
UK House Prices on the House sales agreed (SSTC) in July MTD is £349/sq.ft. For comparison, June was £347/sq.ft, May 24 in £343/sq.ft, April 24 – £341/sq.ft, March 24 – £337/sq.ft, Feb 24 – £335/sq.ft & Jan 24 to £328/sq.ft).
This week’s local focus is on Cheltenham.
Comments are closed.