

 This week’s UK Property Market Stats Show for week ending Sunday 23rd June 2024 features Alice Bullard, boss of Nested.
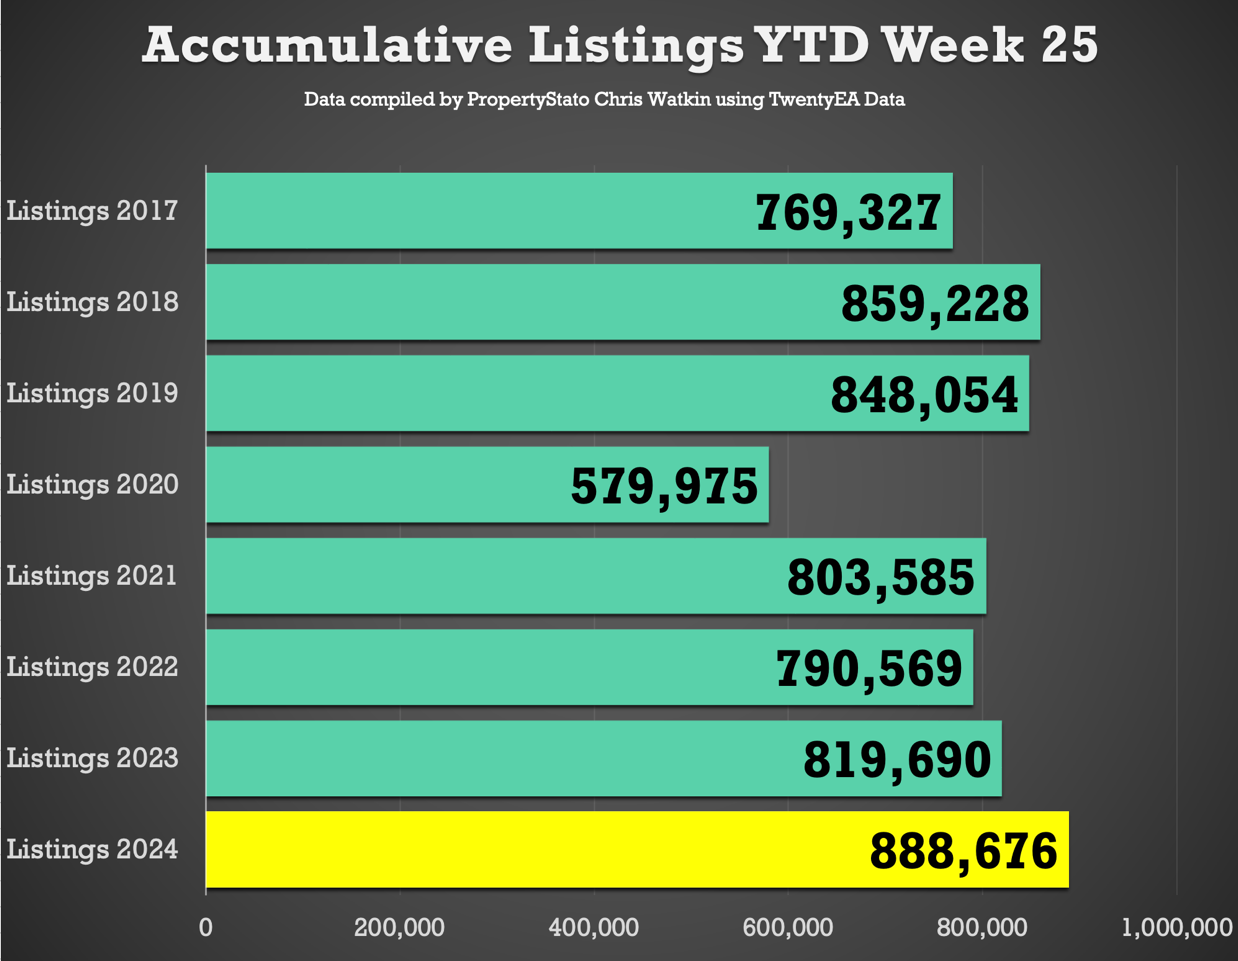
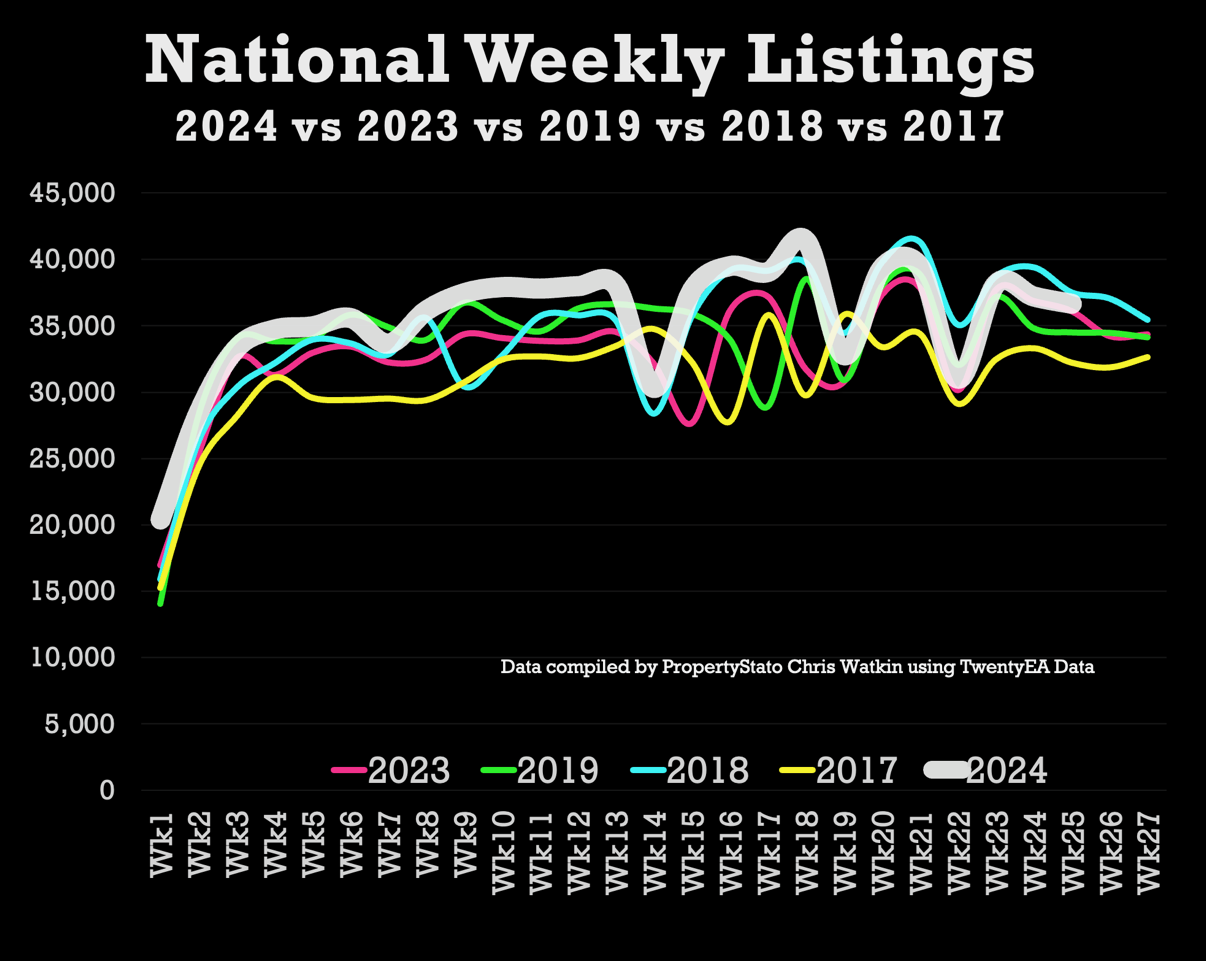
New Properties to Market: The UK saw 36,647 new listings. This year’s YTD listings stand at 888,676, 11.8% higher than the historical 8 year YTD average of 794,888, 7.6% higher than YTD 2017/18/19 and 8.4% higher YTD 2023. Weekly 2024 average : 35,547.
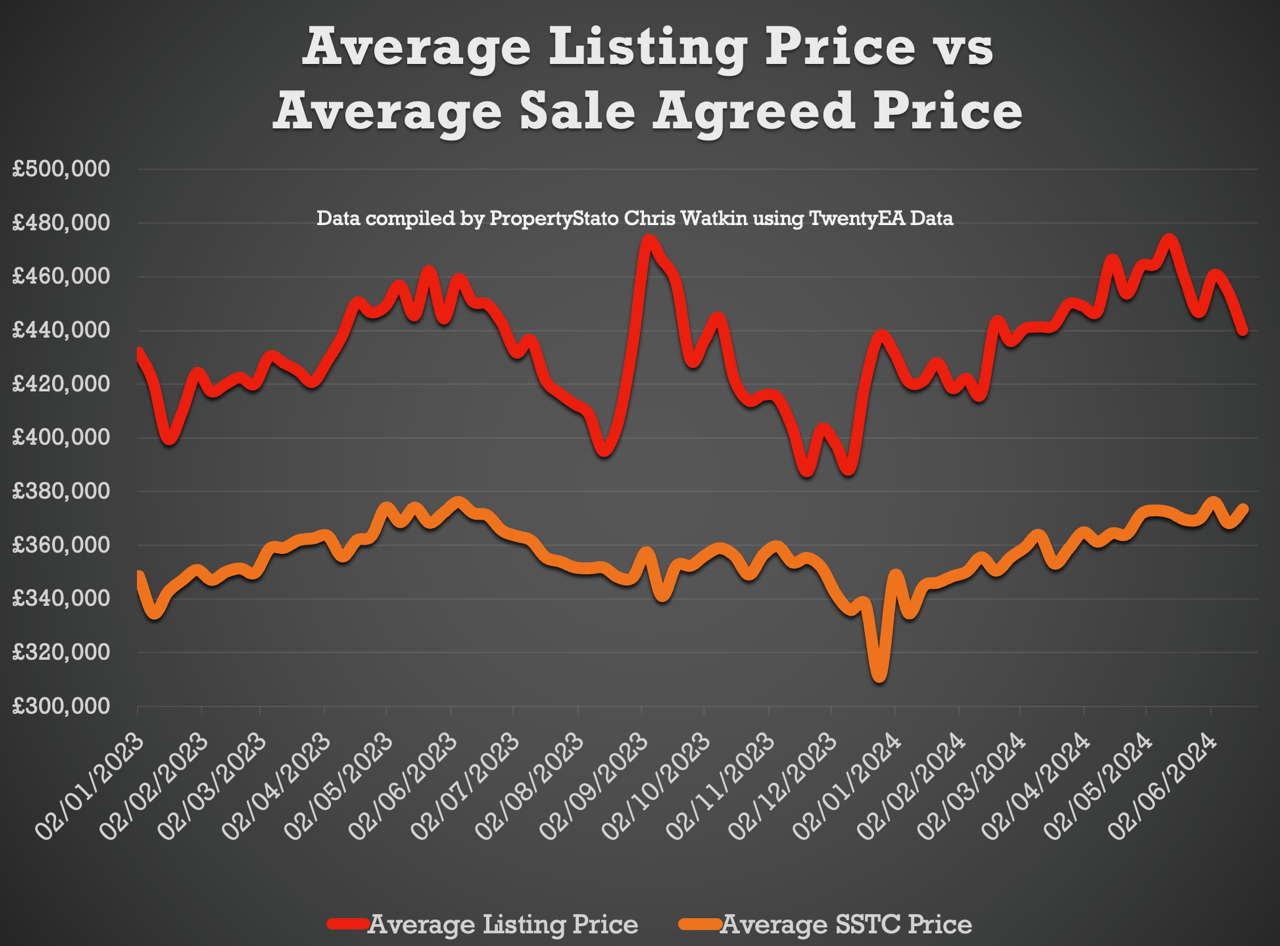
Average Listing Price: £439,996.
Average Asking Price of this week’s Listings vs Average Asking Price of the Properties that Sale Agreed this week: 17.9%. The long-term average is between 16% and 17%. It has been in the early mid/twenties in 2024. Let us hope this isn’t a blip.
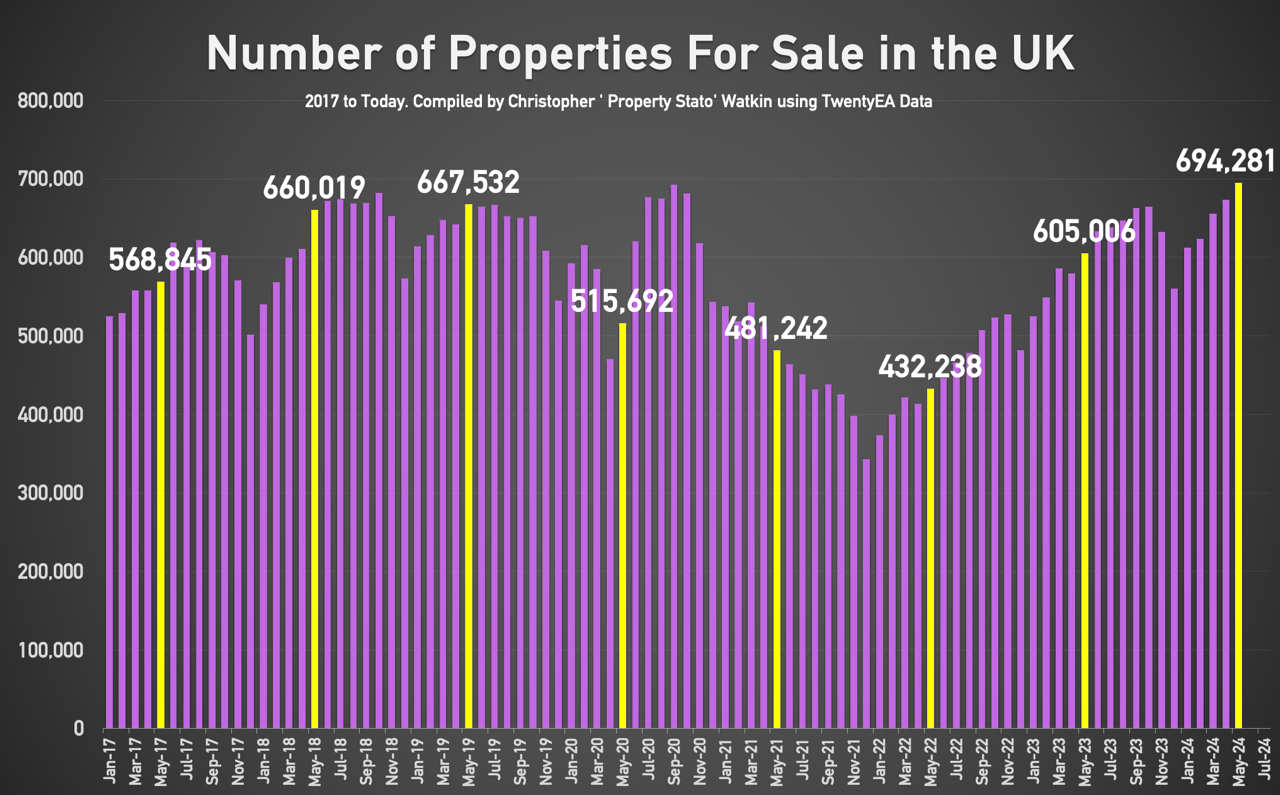
Price Reductions: Last week, 20,944 properties saw price reductions, higher compared to the 8-year Week 25 average of 18,142. Yet there is higher stock levels. Stock levels are at 694,281. This means 1 in 7.89 properties each month are being reduced.
Average Asking Price for Reduced Properties: £393,878.
Gross Sales: 26,472 properties were sold stc last week (2024 weekly average : 24,600 Gross Sales).
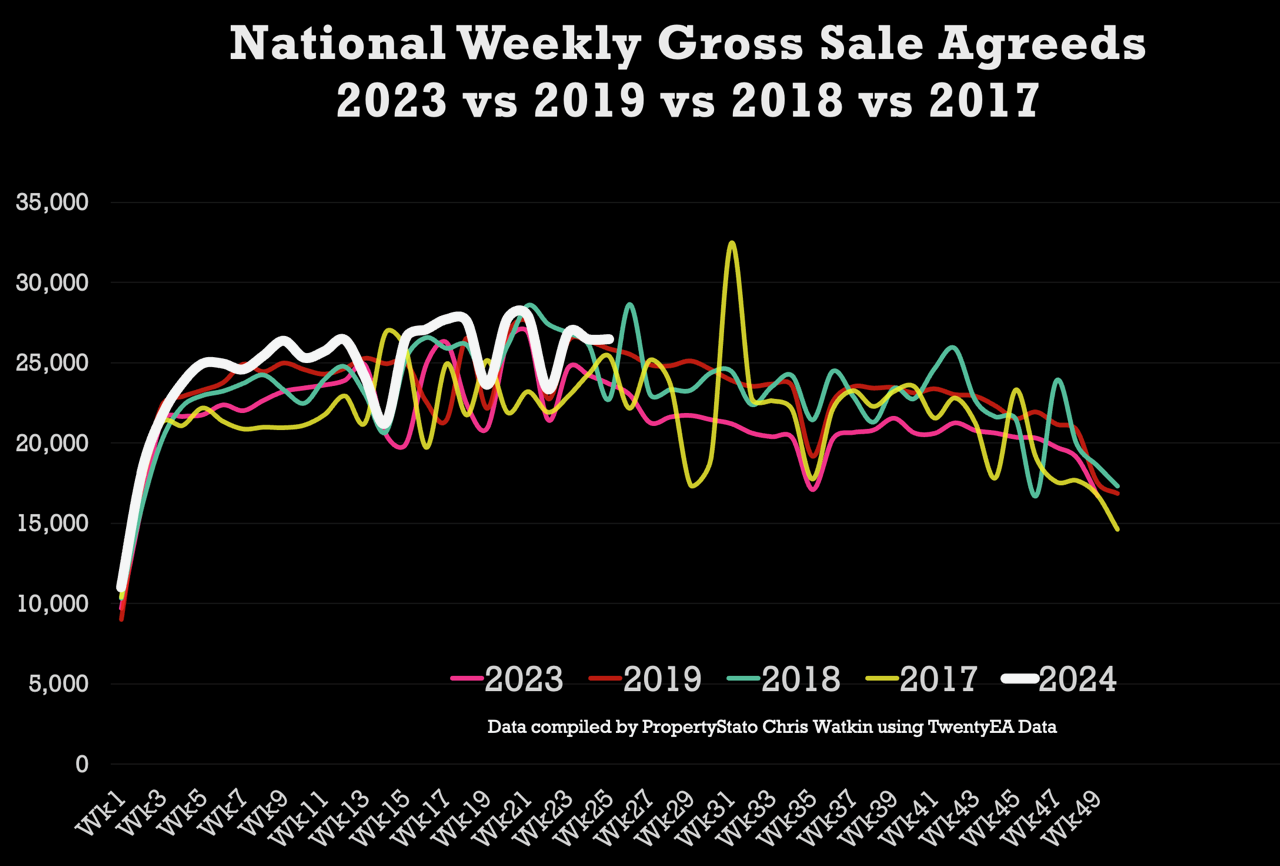
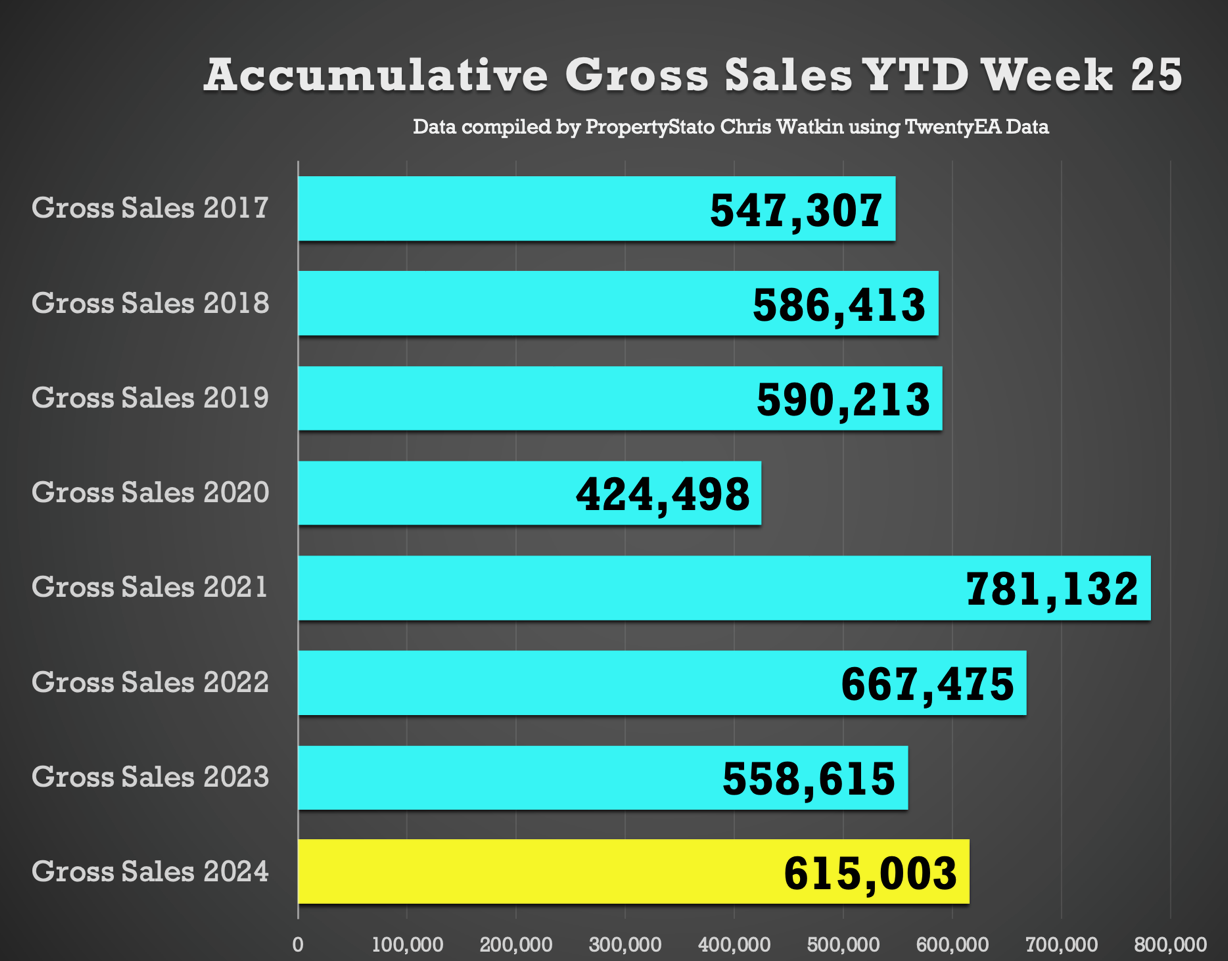
Accumulative Gross Sales YTD: The total YTD stands at 615,003, exceeding the average YTD Gross sales figure of 574,644 from 2017/18/19 and 558,615 in the same week 25 in 2023.
Average Asking Price of Sold STC Properties: Still staying in the mid £360/380k’s range (like has been for 2 years) at £373,313.
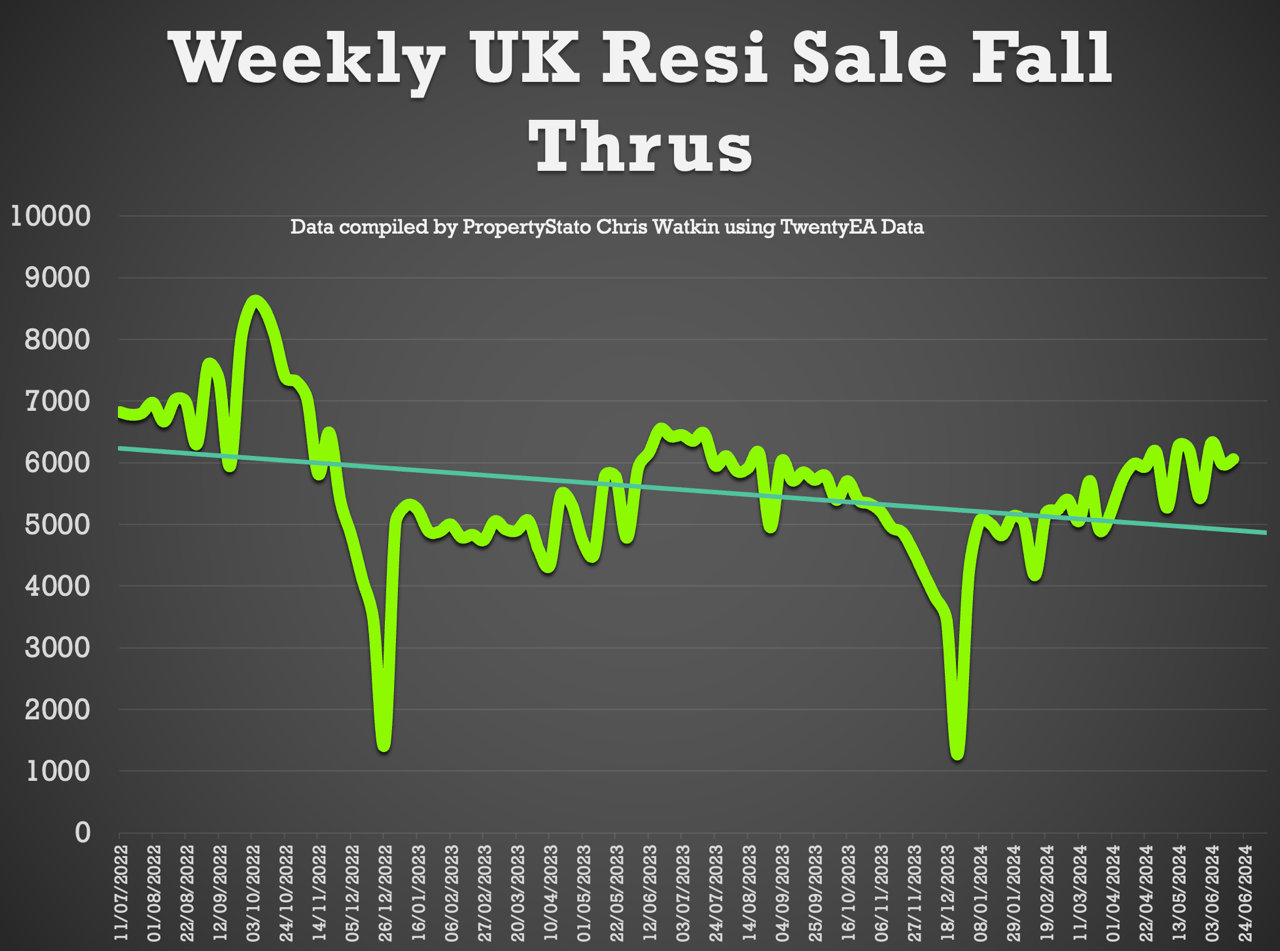
Sale Fall Throughs: Fall throughs this week at 6,055. Last 2 months weekly average 5,958.
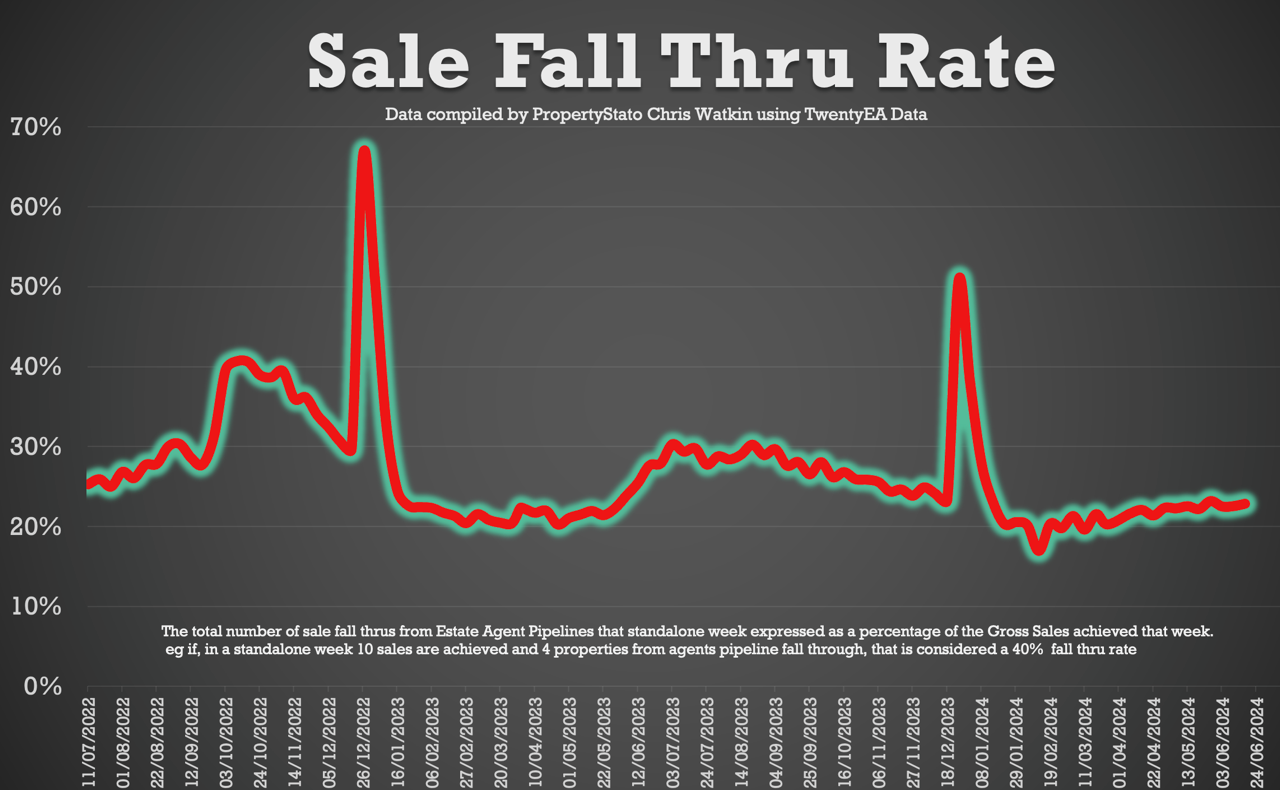
Sale Fall Through % Rate: Similar to last week at 22.9% for week 25. (Comparison – 22.6% for the last 2 months, whilst the long term 8 years average is 24.8% & it was 40%+ in Q4 2022 – the Truss budget!).
Net Sales – 20,417 – 6.3% higher than the 2024 weekly average of 19,204.
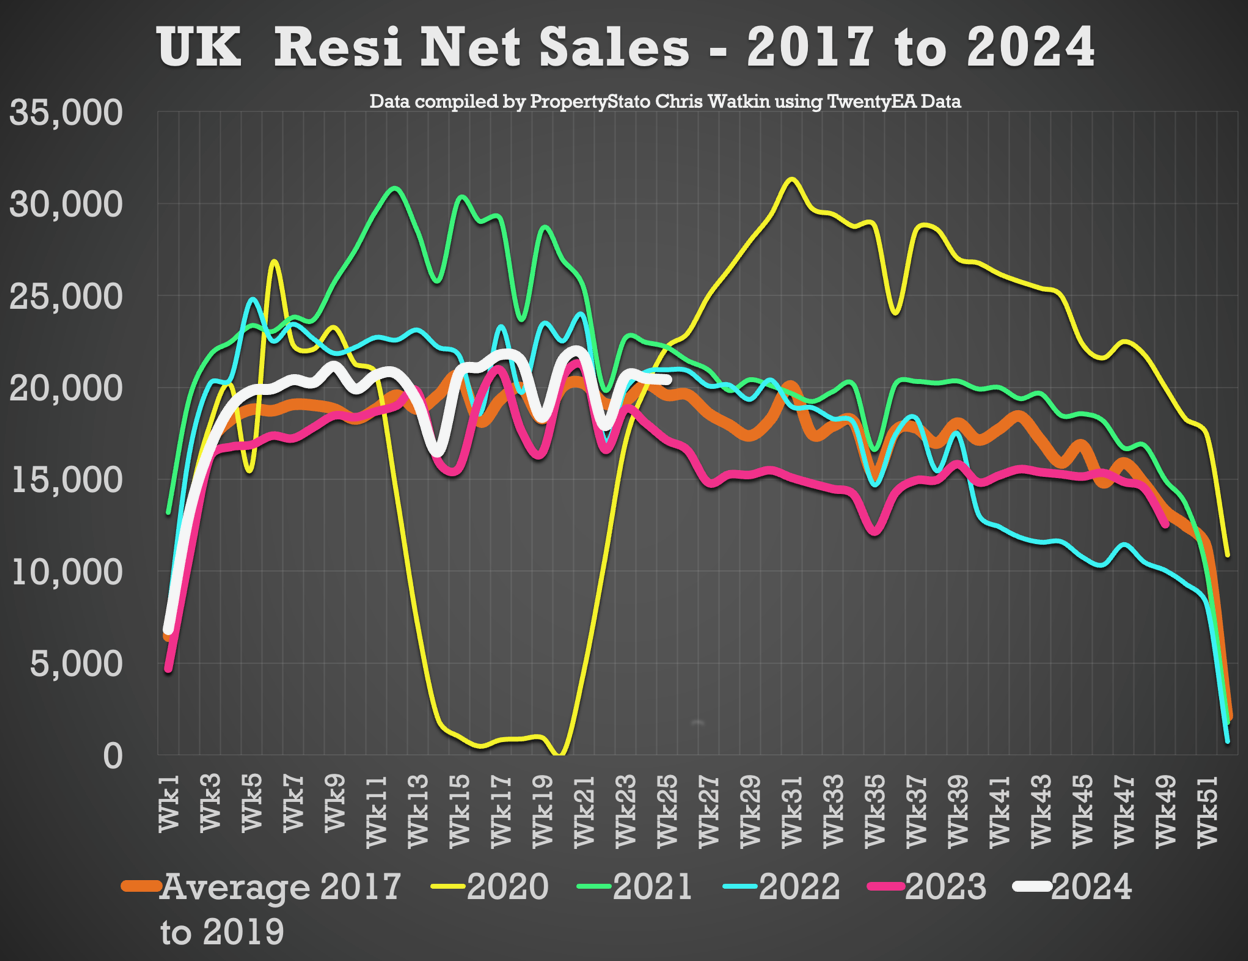
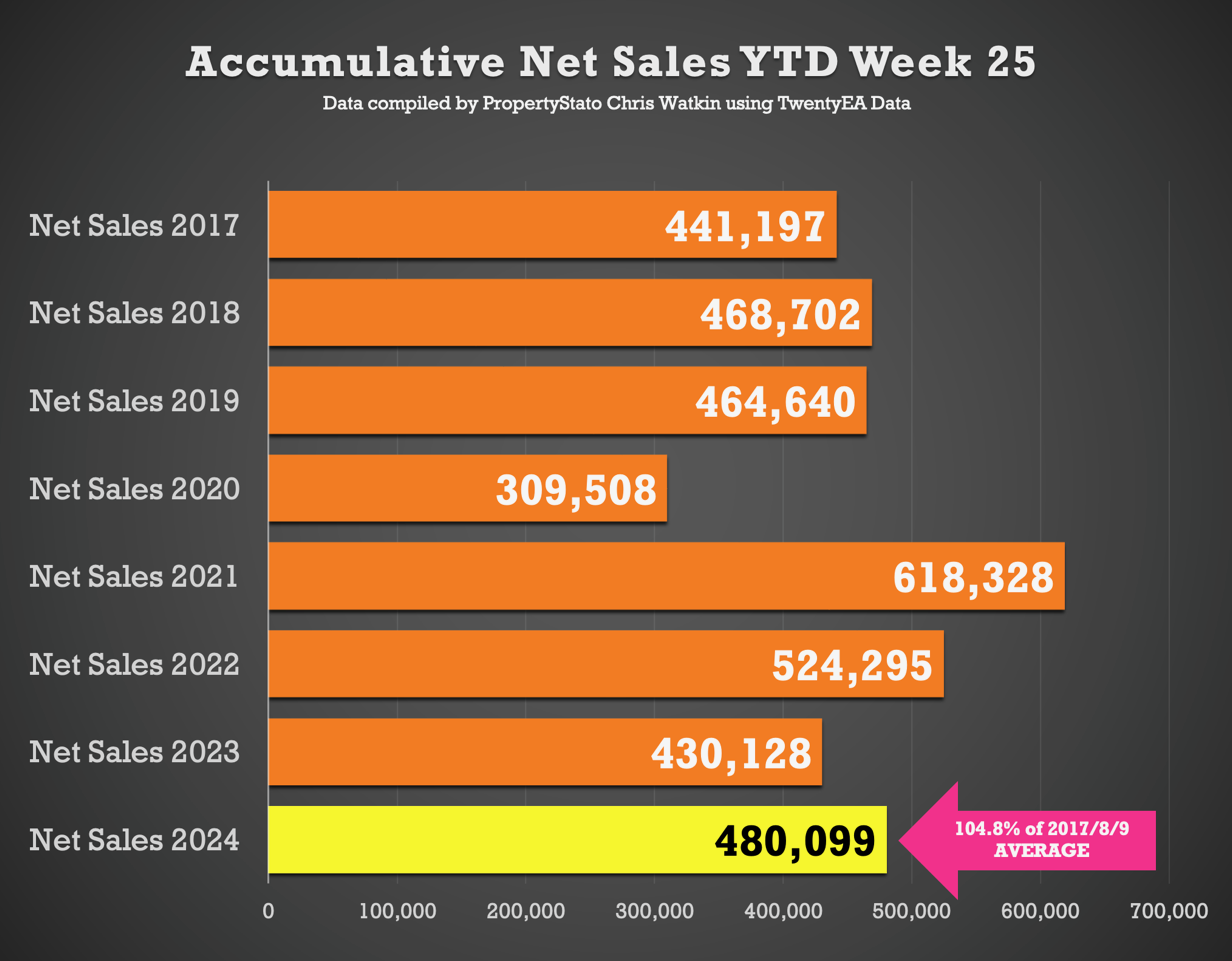
Accumulative Net Sales YTD: The total stands at 480,099, 4.8% higher the 17/18/19 YTD Net sales average (458,180) and 11.6% higher than the YTD figure for 2023 for Net Sales
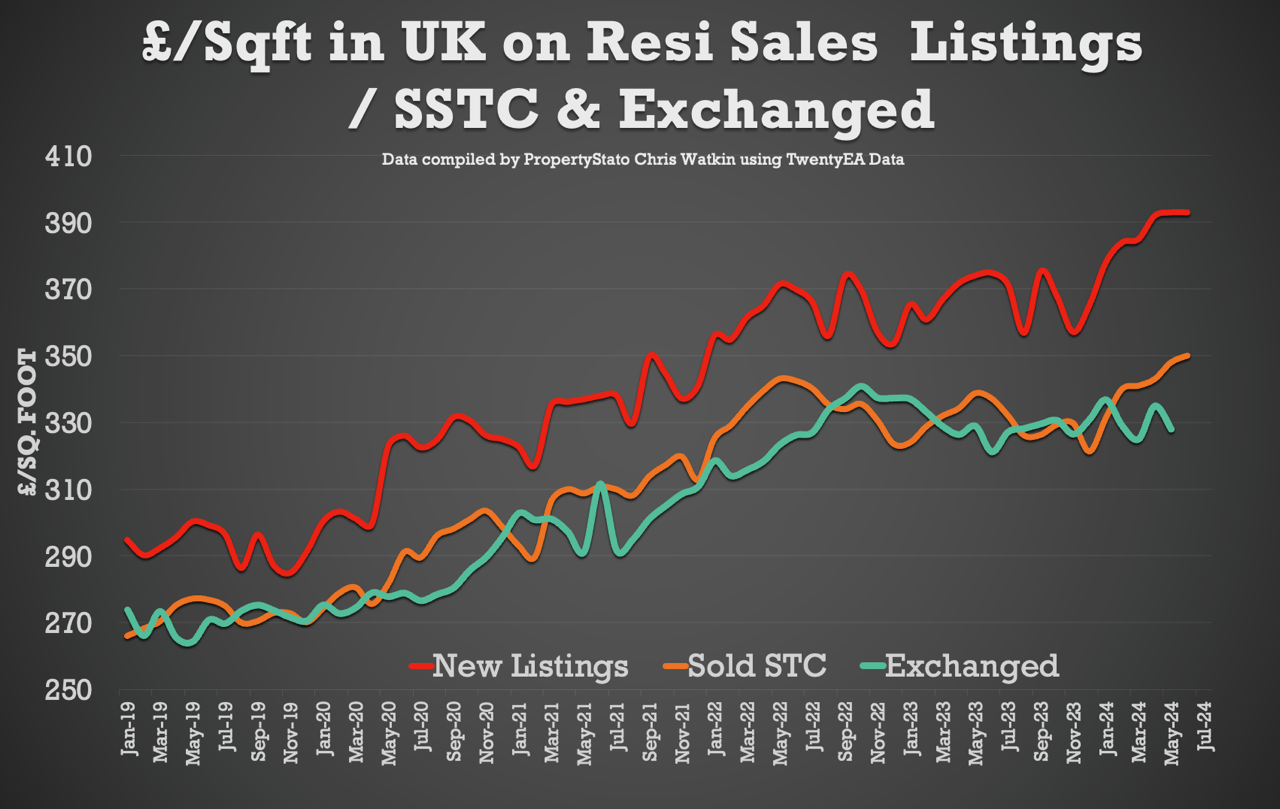
House Prices for June MTD are still at £350/sq.ft. For comparison – in May ’24 in £348/sq.ft, April ’24 – £344/sq.ft, March ’24 – £339/sq.ft, Feb ’24 -£339/sq.ft & Jan ’24 to £331/sq.ft).
Nationwide Real Values today versus Q2 2022- the average UK home is 14.52% cheaper in real terms today than Q2 2022 – Figures from the Nationwide Building Society
Resi Sales Stock Levels – 694,281 properties for sale at the end of May 2024.
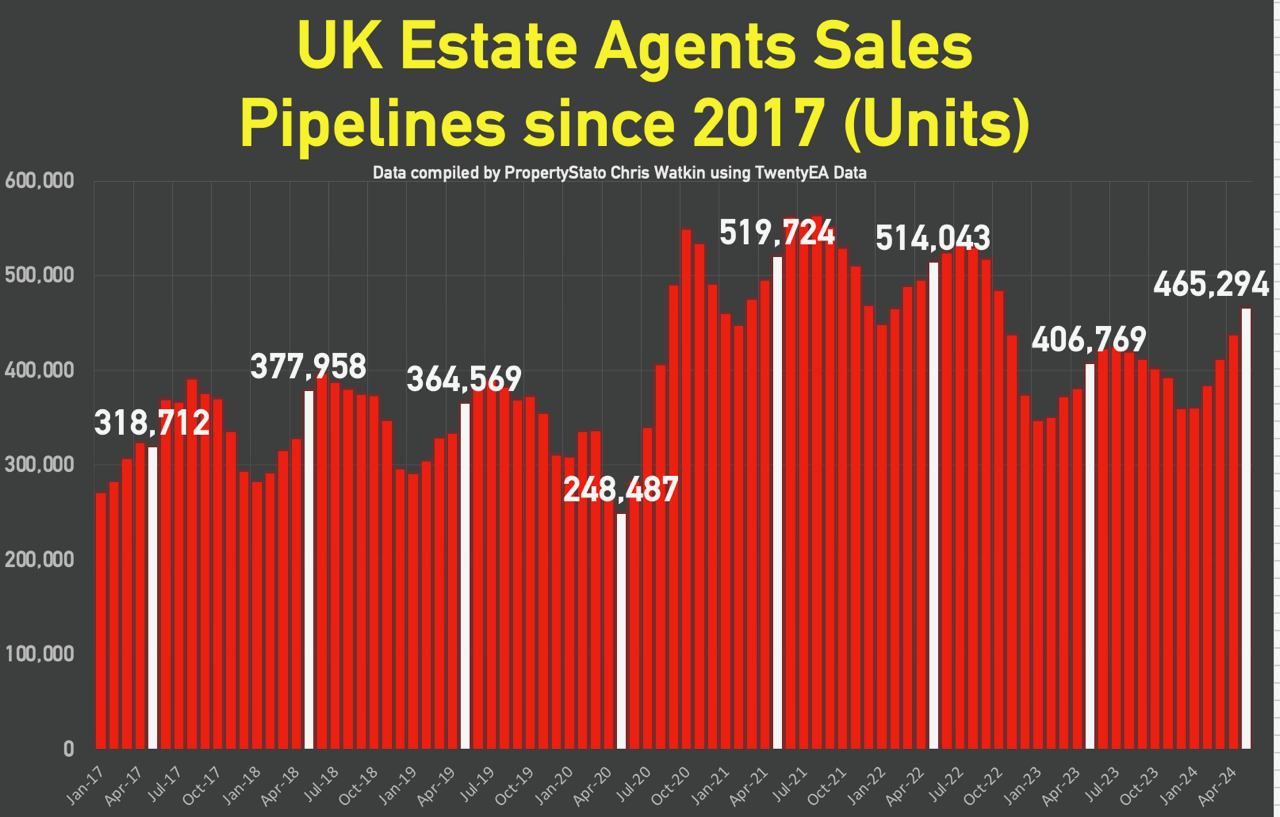
Resi sales in Sales Pipelines – 465,294 properties in Agent’s Sales pipelines at the end of May 2024.
This week’s local focus is on Hatfield.
Comments are closed.