


This week’s UK Property Market Stats Show for week ending Sunday 9th June 2024 features Rob Smith, boss of Hunters & Whitegates.
The headlines are as follows:
+ House prices achieved in June are 6.34% higher than January 2024
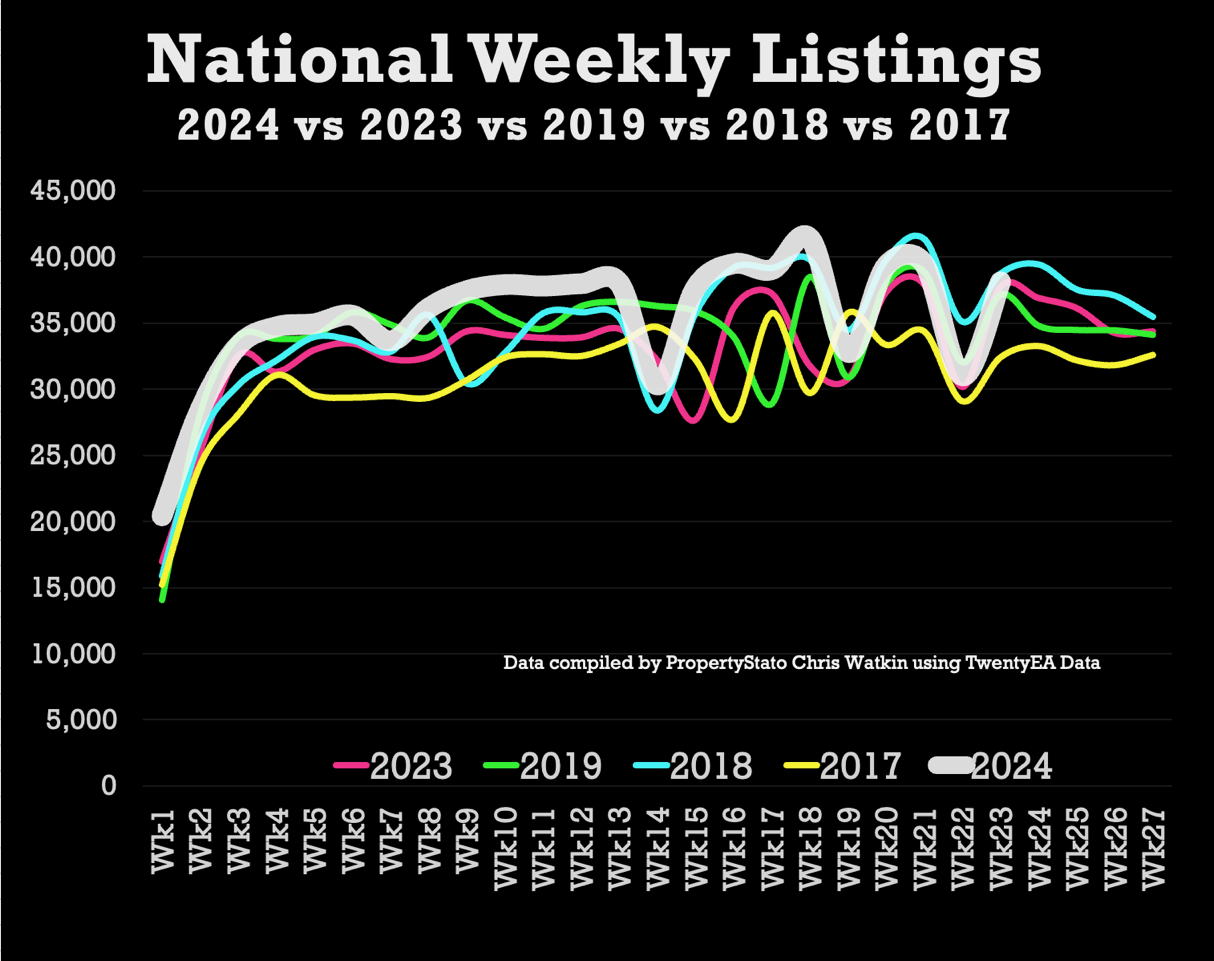
+ Listings – 23% higher than last week (as predicted because of the Bank Holiday weekend rebound) at 36k UK listings. YTD 9.1% higher than 2023 and 8% higher YTD than 2017/18/19
+ Total Gross Sales – 26,893 (24,712 same week in 2023). YTD gross sales are 10.1% higher than 2023 YTD levels and 6% higher than 2017/18/19 levels.
+ Net Sales – 20,575, 14.7% higher from last week’s figure (again, because of the Bank Holiday) and 6% higher than than the last 7 year average (2017 to 2023 inclusive).
+ Sale fall-throughs remain steady at just over one in five sales.
Chris’s In-Depth Analysis (Week 23) :
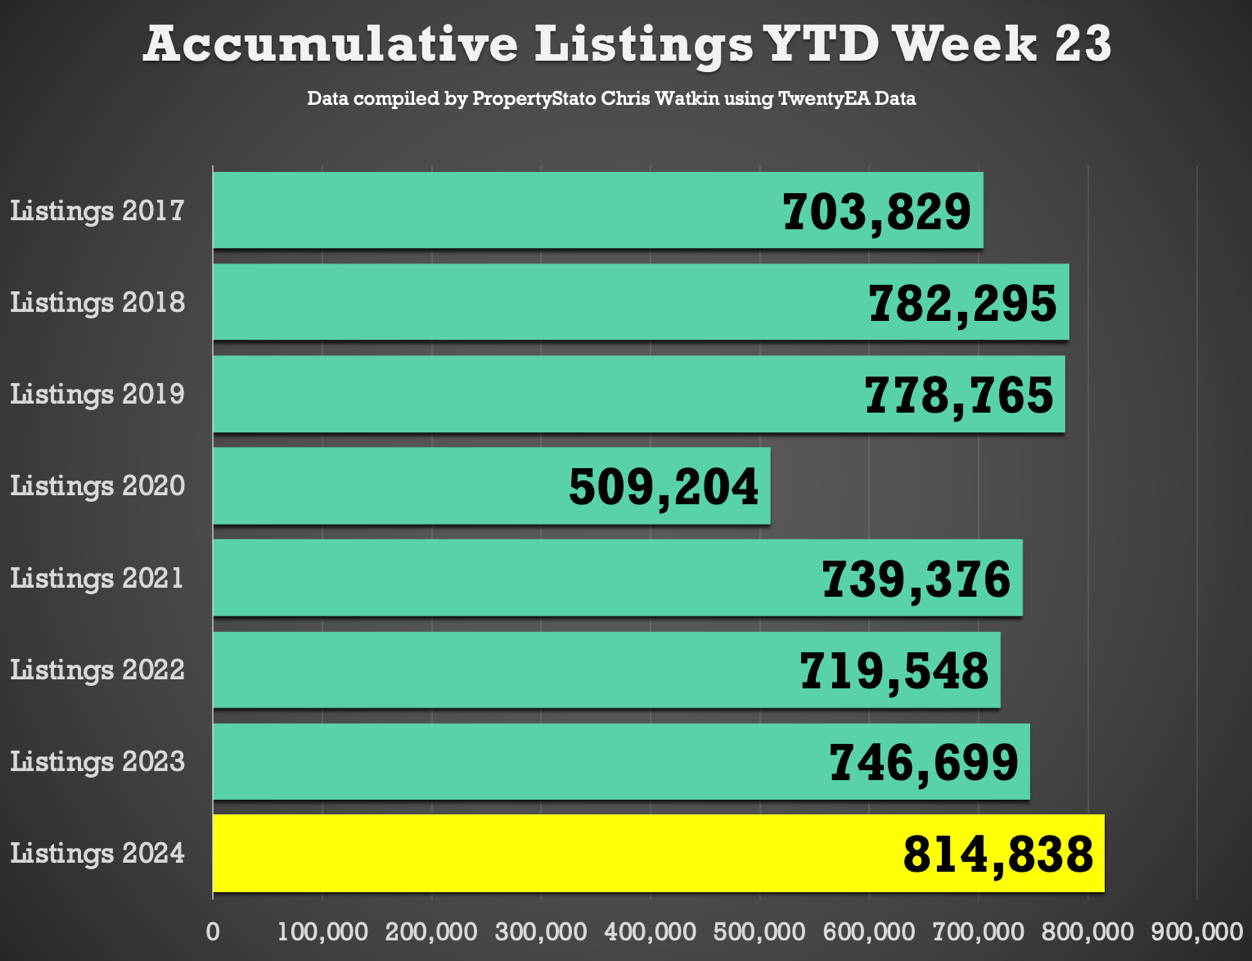
New Properties to Market: The UK saw 38,114 new listings. This year’s YTD listings stand at 814,838, 12.5% higher than the historical eight-year YTD average of 724,319, 7.9% higher than YTD 2017/18/19 and 9.1% higher YTD 2023.
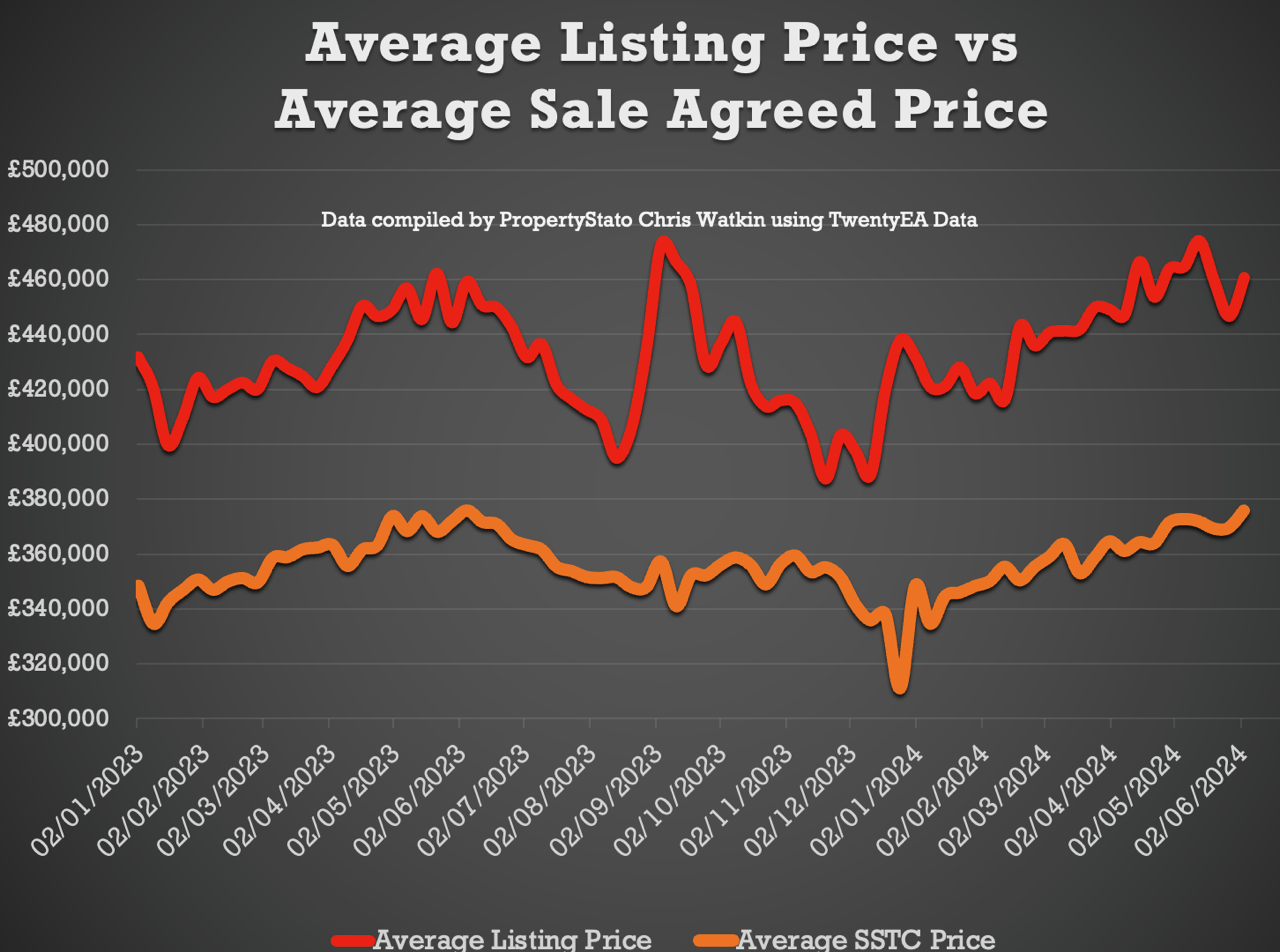
Average Listing Price: £460,665 .
Average Asking Price of this week’s Listings vs Average Asking Price of the Properties that Sale Agreed this week: 22.5%. The long-term average is between 16% and 17%. Over valuing in the whole of the UK, higher valuing properties for sale (downsizing) and a lower propensity of London & SE properties to sell causing this.
Price Reductions: Last week, 23,889 properties saw price reductions, a significant number compared to the 8-year Week 23 average of 16,438. This means 1 in 6.21 properties each month are being reduced (Long term average 1 in 9.9 per month)
Average Asking Price for Reduced Properties: £423,882
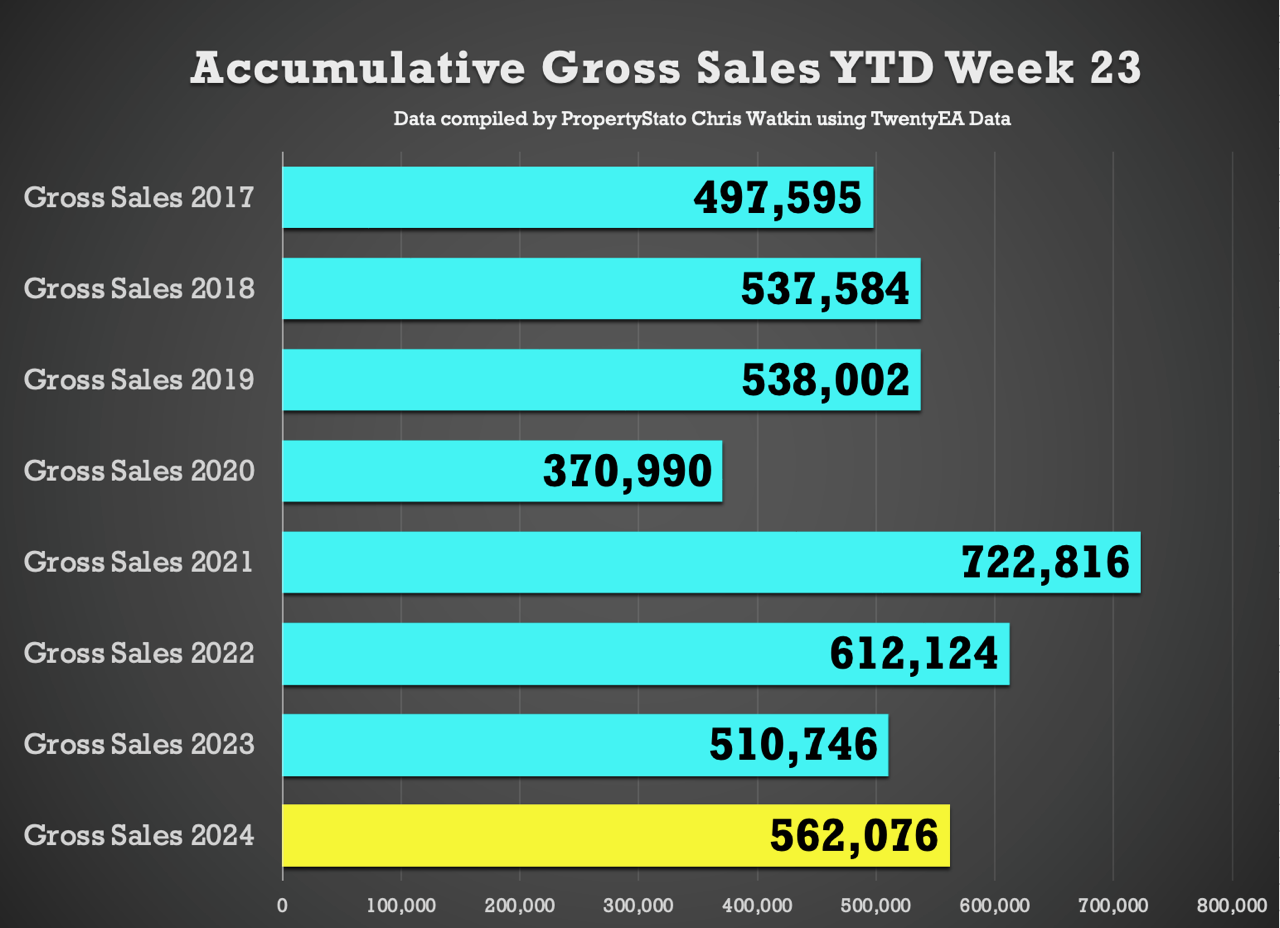
Gross Sales: 26,893 properties were sold stc last week
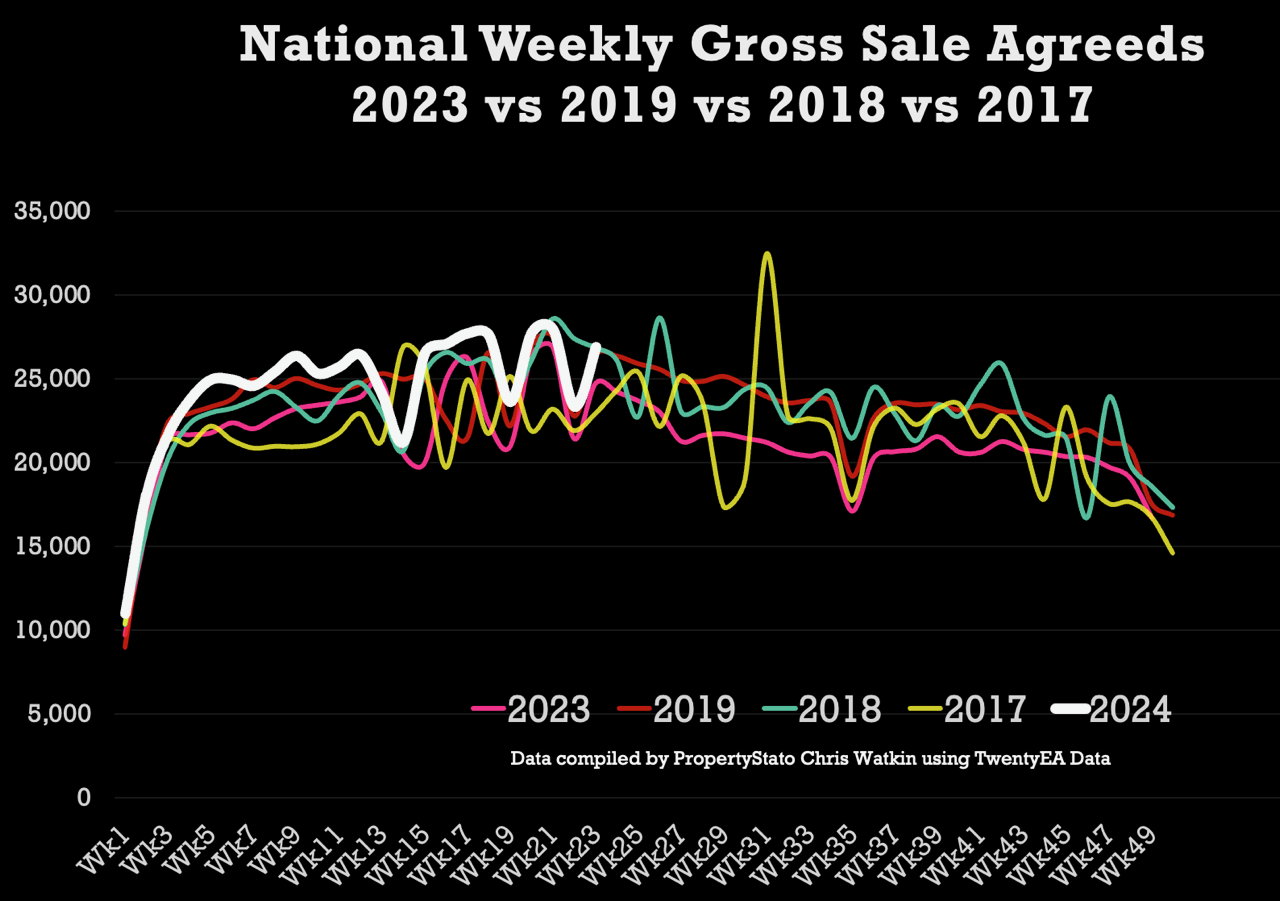
Accumulative Gross Sales YTD: The total stands at 562,076, exceeding the average of 524,394 from 17/18/19 and 510,746 in the same week 23 in 2023.
Average Asking Price of Sold STC Properties: Still staying in the mid £360/380k’s range (like has been for 2 years) at £375,992.
Sale Fall Throughs: Fall thrus have been slowly creeping up in the last two months (see the graph). This week at 6,318. This does not particularly concern me as sales up, and the more important metric is the sale fall thru % rate (see below).
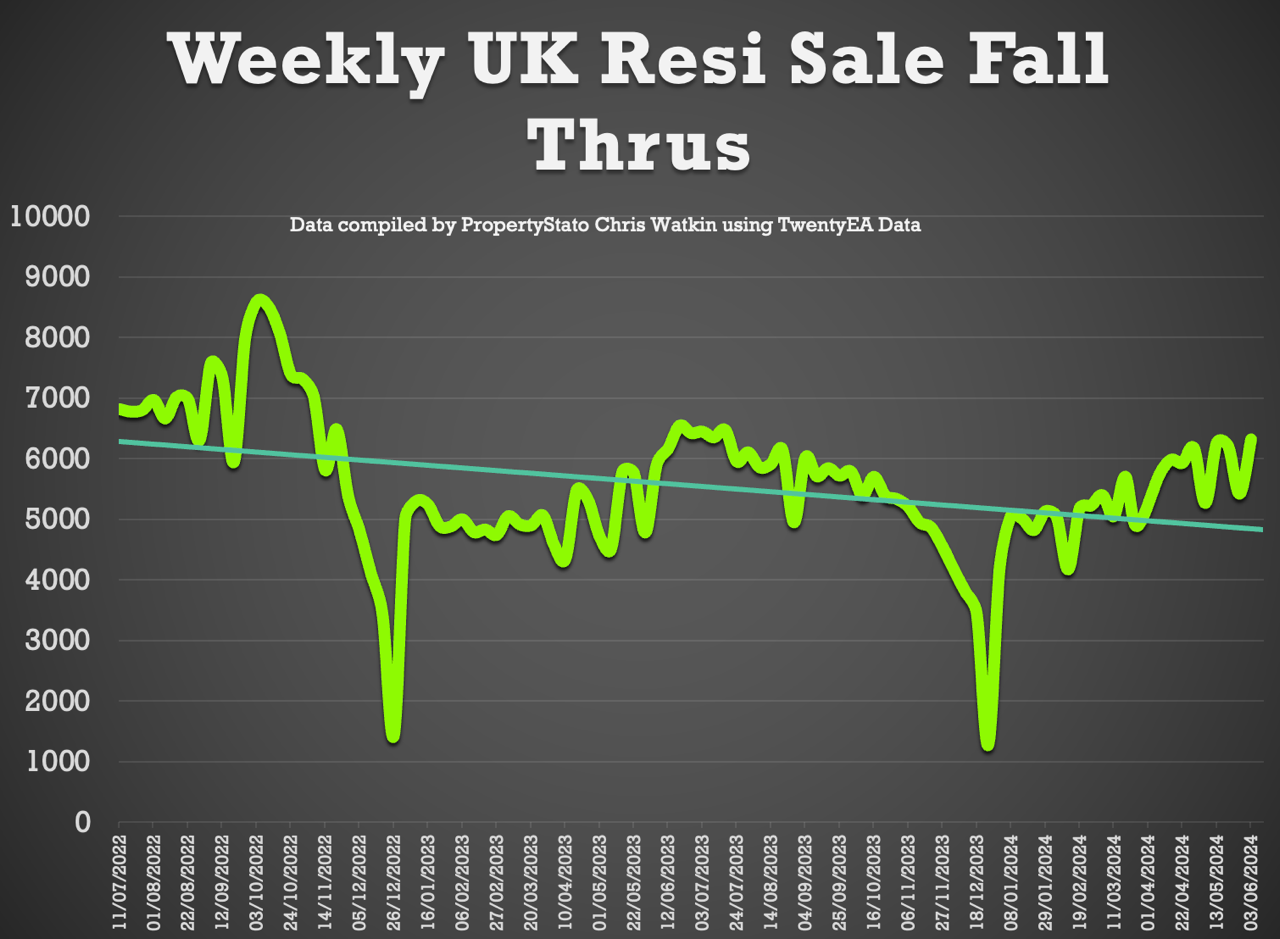
Sale Fall Through % Rate: Slight dip from last week good news) to figures seen in the last few months, to 22.5% for week 23. (Comparison – 21.82% for the last 3 months, whilst the long term 8 years average is 24.8% & it was 40%+ in Q4 2022 – that budget!) GRAPH 15
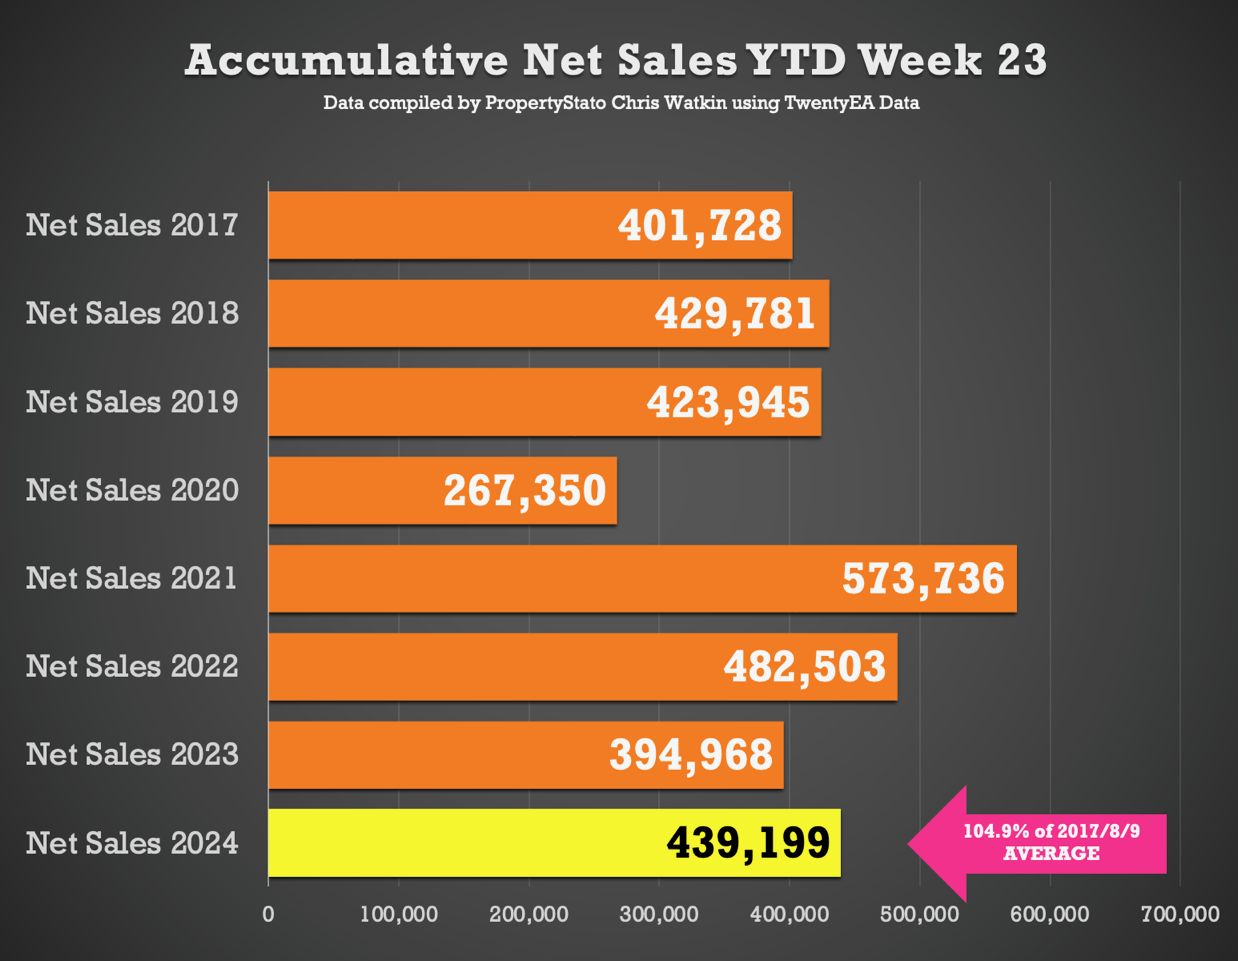
Net Sales – at 20,575. 7.7% higher than the 2024 YTD average 19,096.
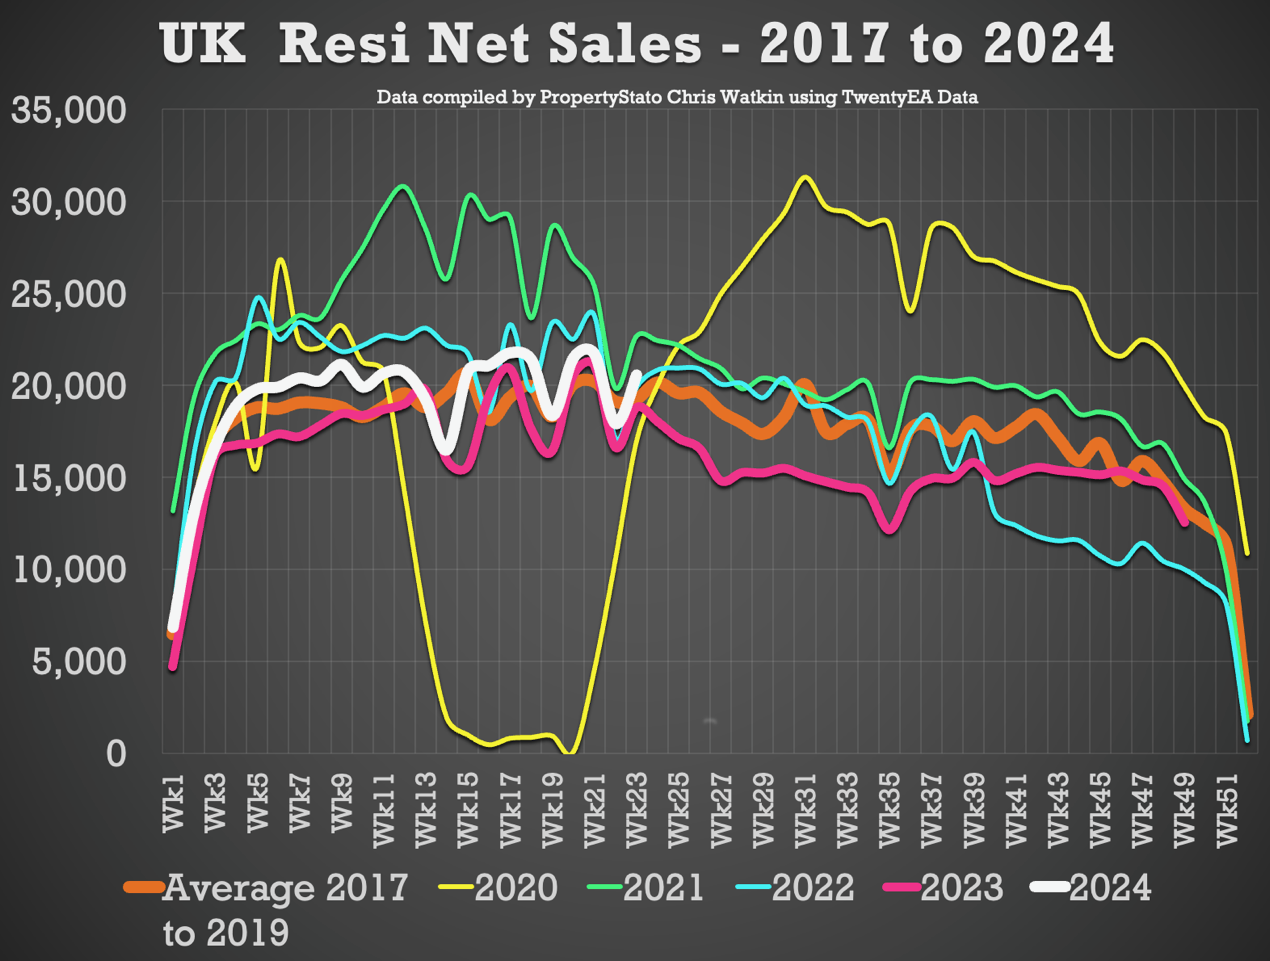
Accumulative Net Sales YTD: The total stands at 439,199, 4.9% higher the 17/18/19 YTD Net sales average (418,485) and 11.2% higher than the YTD figure for 2023 for Net Sales.
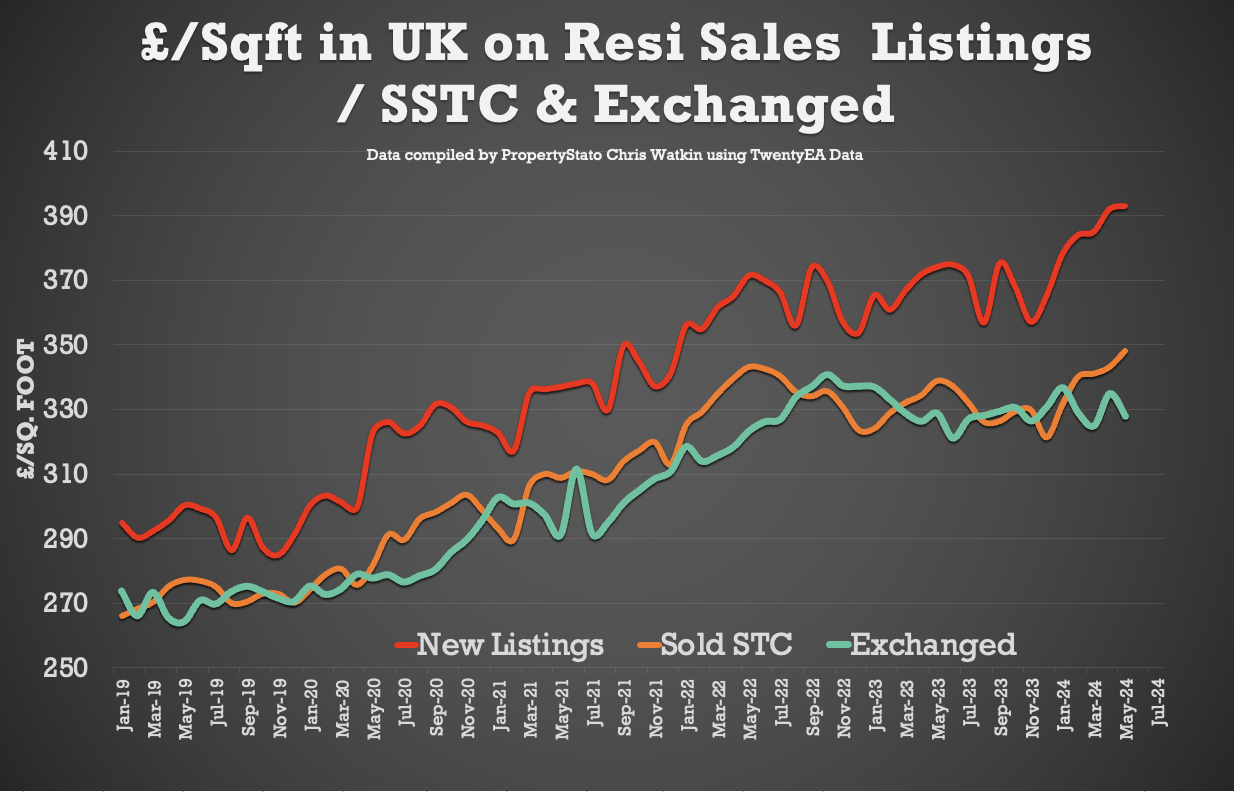
House Prices for June MTD are £352/sq.ft (a record). For comparison – in May ’24 in £348/sq.ft, April ’24 – £344/sq.ft, March ’24 – £339/sq.ft, Feb ’24 -£339/sq.ft & Jan ’24 to £331/sq.ft).
Therefore, house prices are 6.34% higher than Jan ’24. For those wondering why I look at £/sq.ft, there is a correlation of 92% between the the change in £/sqft at sale agreed and the Land Registry 5 months later.
Therefore, by following the £/sq.ft figures, we know what will happen to the Land Registry 5 or 6 months in advance (The Pearson correlation coefficient (rr) measures how strongly two variables are related.
This score of +0.92 (ie 92% in laymen’s terms) indicates a very strong positive relationship, meaning as one variable increases, the other also increases significantly. This is close to the maximum value of +1, suggesting a nearly perfect linear relationship)
This week’s local focus is on Bury.
Probably one of the best set of stats I’ve ever seen. Would love to get in touch with you to ask a couple of questions. This data is REALLY useful if you know how to read it. Thanks!!
You must be logged in to like or dislike this comments.
Click to login
Don't have an account? Click here to register
More than happy to have a chat. You get hold of me on LinkedIn easily
You must be logged in to like or dislike this comments.
Click to login
Don't have an account? Click here to register
Why aren’t the crm’s providing this data? They have the stats!
You must be logged in to like or dislike this comments.
Click to login
Don't have an account? Click here to register