

 This week’s UK Property Market Stats Show, for week ending Sunday, 30th June 2024, features special guest, Kristian Stott.
The headlines for Week 26 of 2024 are as follows:
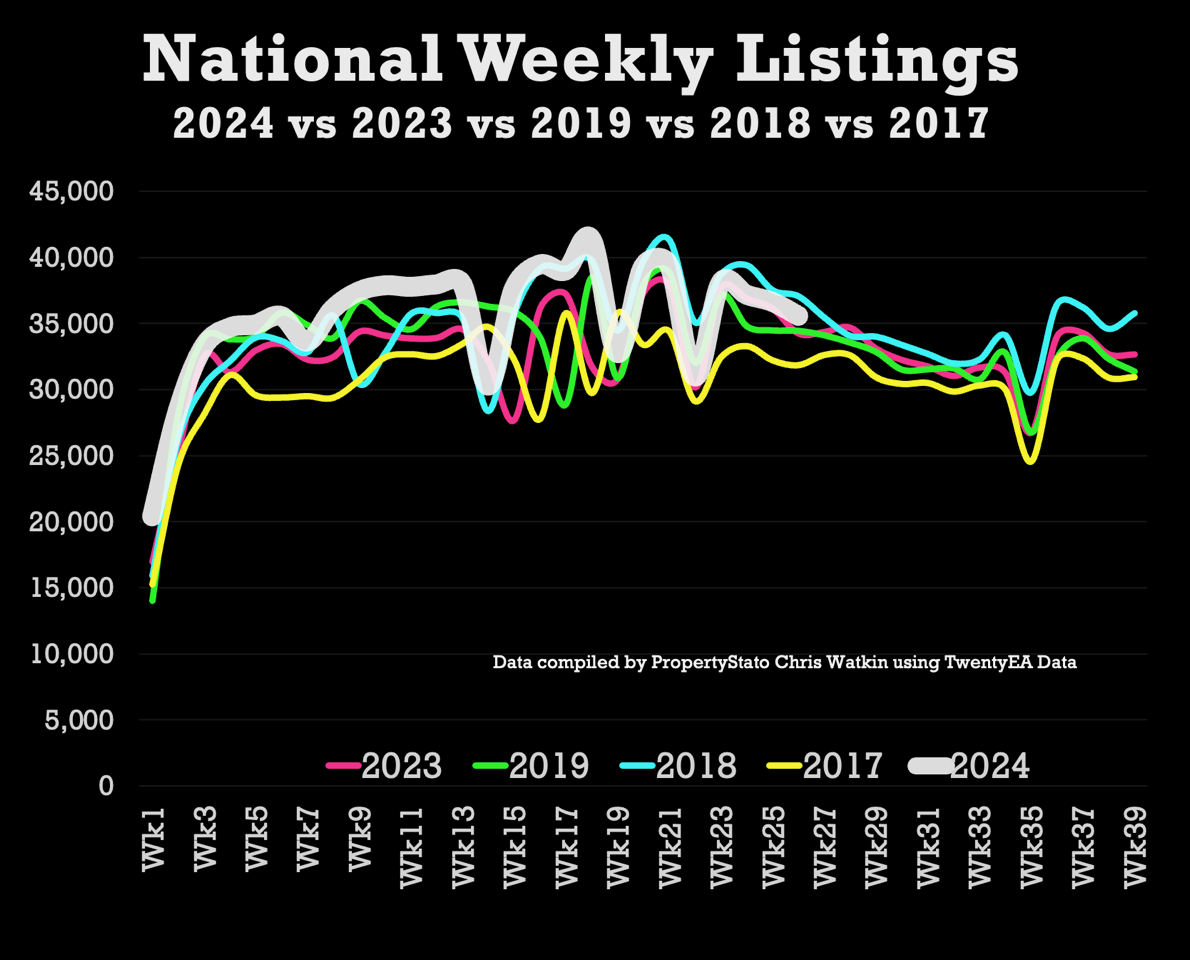
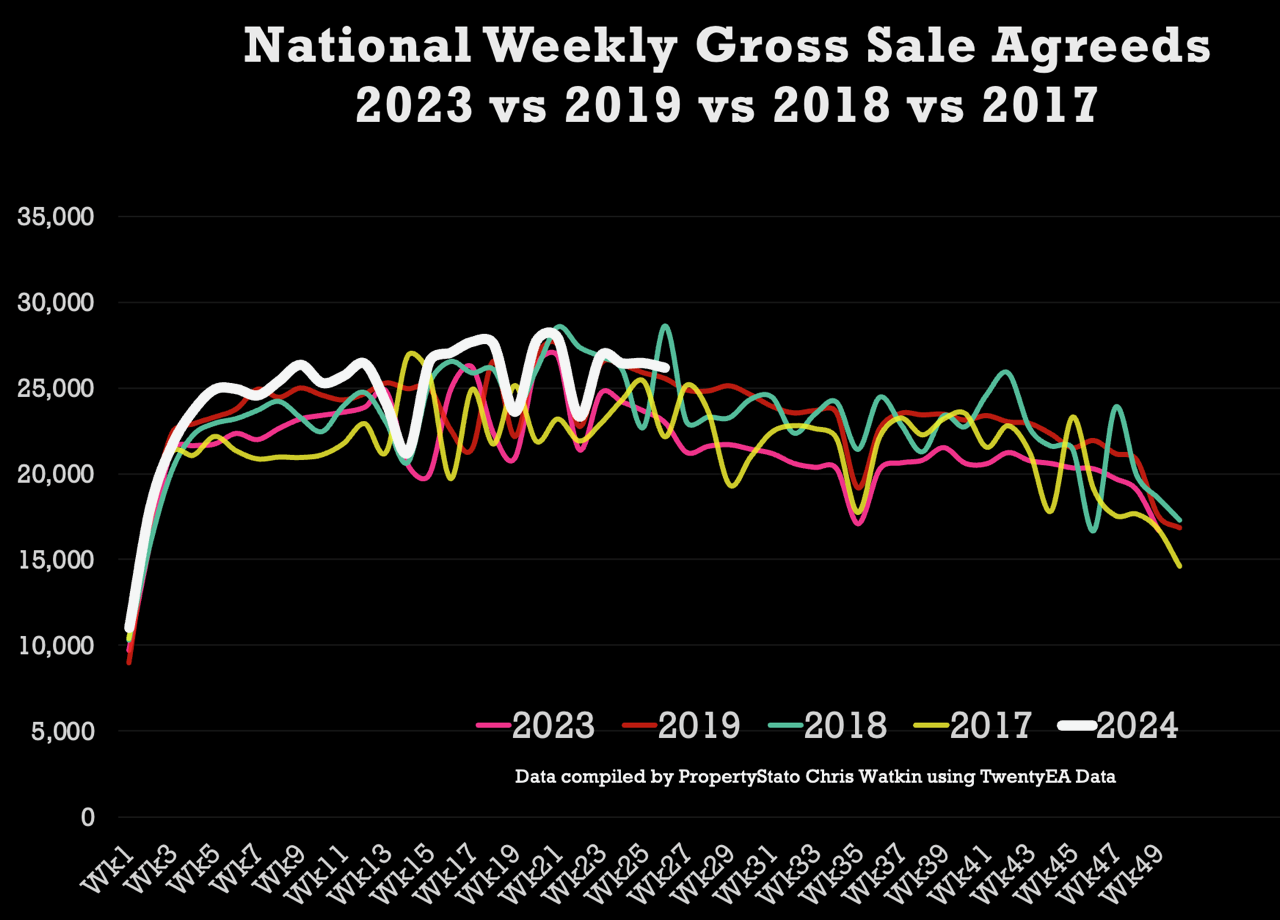
+ UK house prices on homes sold (stc) in June continue to remain strong at £348/sq.ft – 5.1% higher than Dec 2023 · Listings – 35.6k UK listings this week. 7.5% higher YTD than 2017/18/19/20 YTD average. · Total Gross Sales – 26,198 – 6.9% higher than 2017/18/19
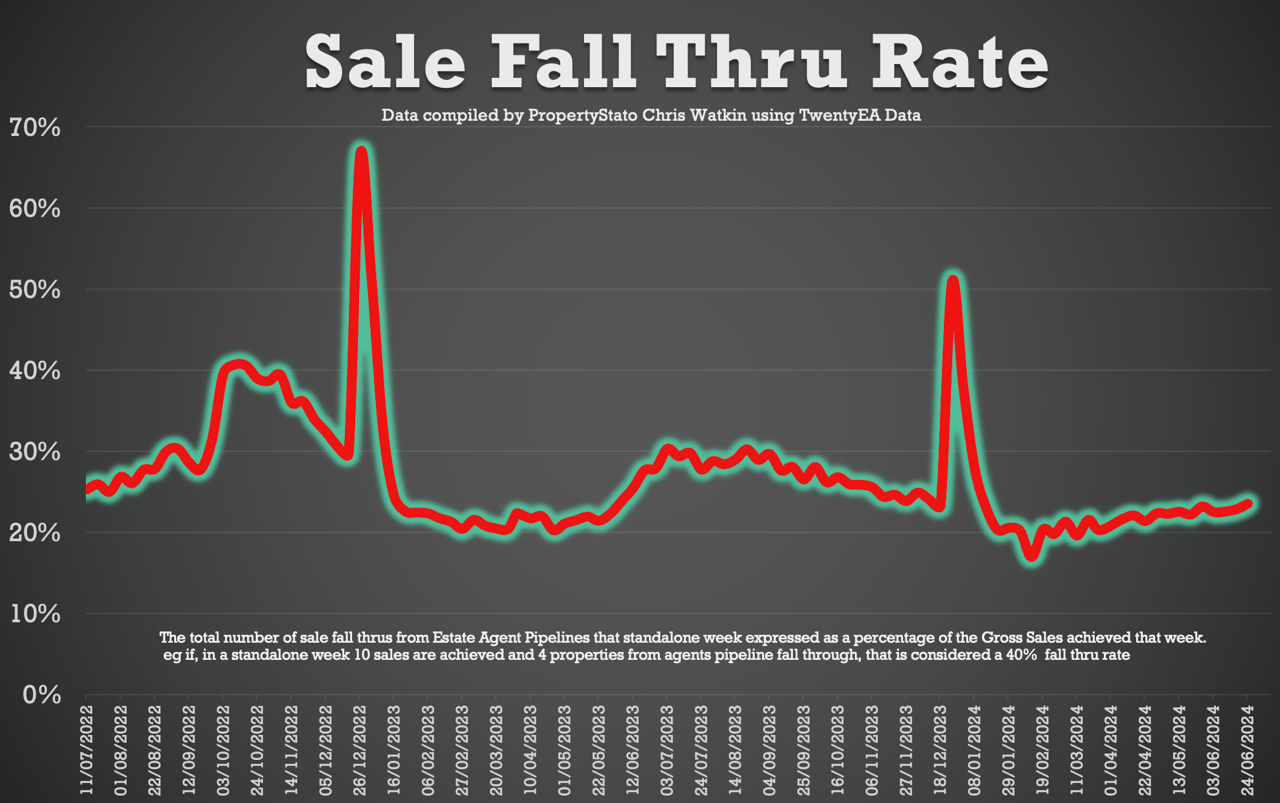
+ YTD levels, 6.4% higher than the 2024 weekly average & 10.2% higher than 2023 YTD levels. · Net Sales – 20,028 this week, 20.8% higher than the same Week in 2023. · Sale fall-throughs crept up slightly at just under 1 in 4 sales (23.5%) – 7 year Long Term
+ Average is 24.8% – so nothing to worry about .
Overall, the general election has had no real impact on the UK property market over the past month or so, as UK house prices achieved at SSTC are 5.1% higher than December 2023.
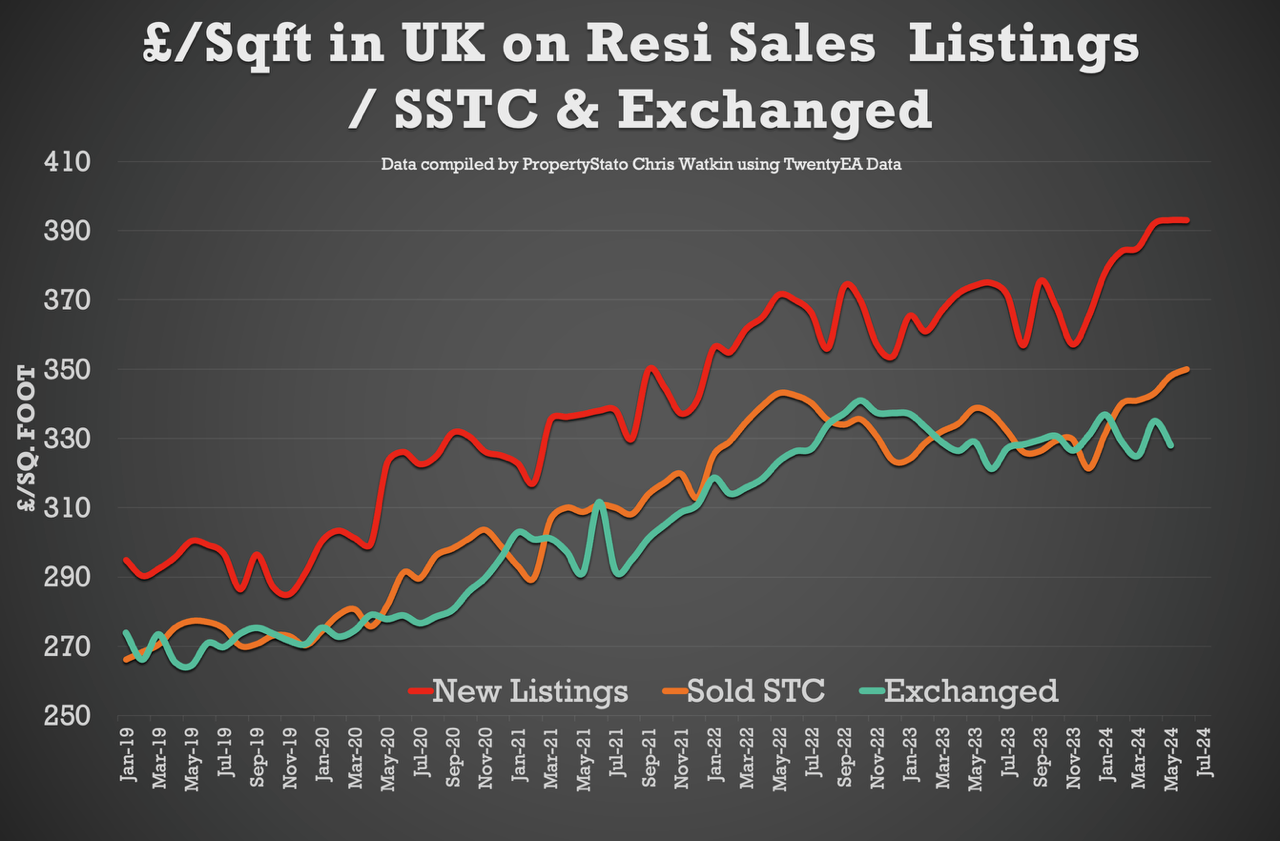
Chris’s In-Depth Analysis
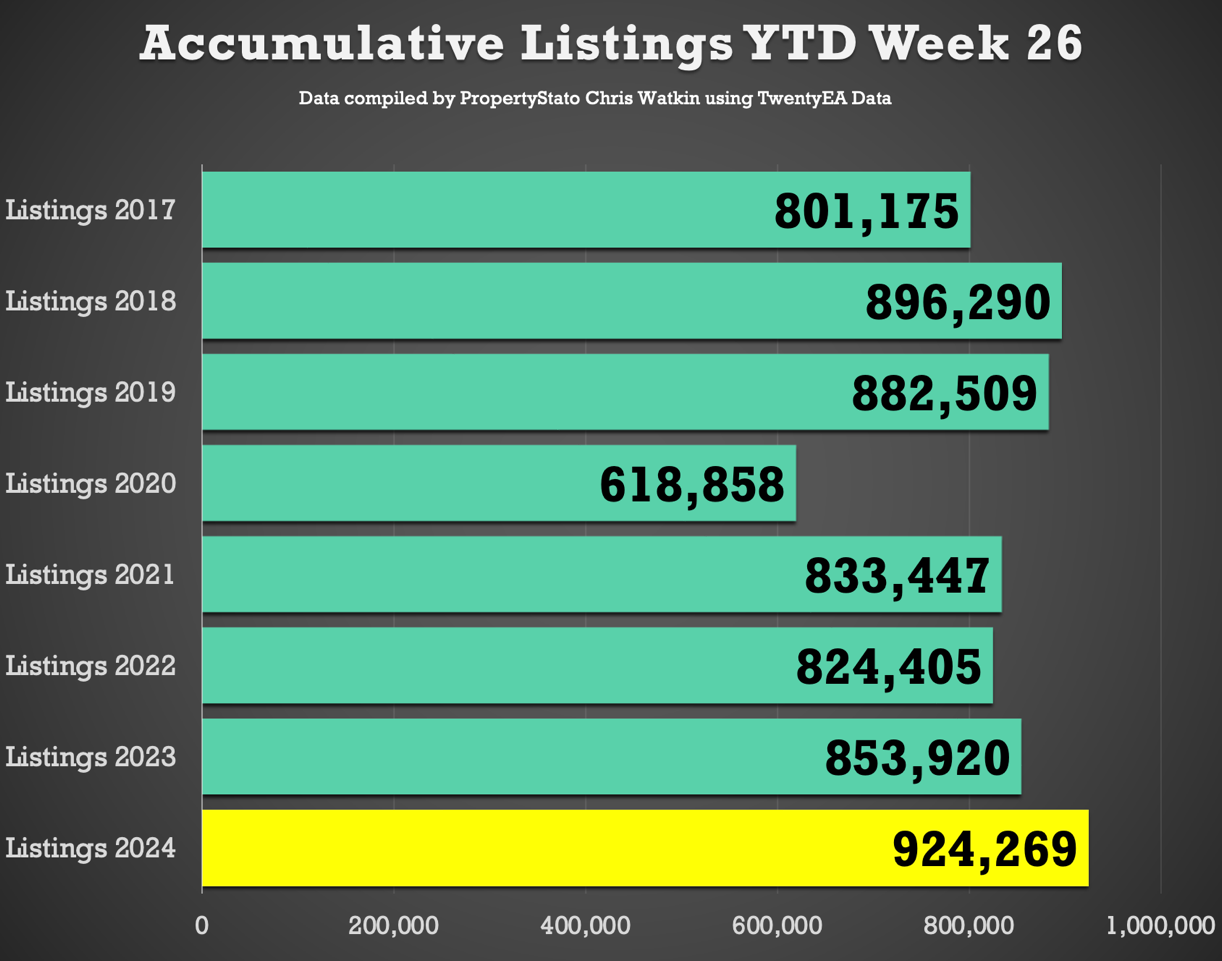
+ New Properties to Market: The UK saw 35,593 new listings. This year’s YTD listings stand at 924,269, 11.4% higher than the historical 8 year YTD average of 829,359, 7.5% higher than YTD 2017/18/19 and 8.2% higher YTD 2023. Weekly 2024 average: 35,549.
Average Listing Price: £442,177.
Average Asking Price of this week’s Listings vs Average Asking Price of the Properties that Sale Agreed this week: 21.1%. The long-term average is between 16% and 17%.
Price Reductions: Last week, 20,523 properties saw price reductions, higher compared to the 8-year Week 26 average of 18,230. Yet there is higher stock levels. Stock June levels are at 694,281. This means 1 in 8 properties each month are being reduced.
Average Asking Price for Reduced Properties: £401,075.
Gross Sales: 26,198 properties were sold stc last week (2024 weekly average : 24,661 Gross Sales).
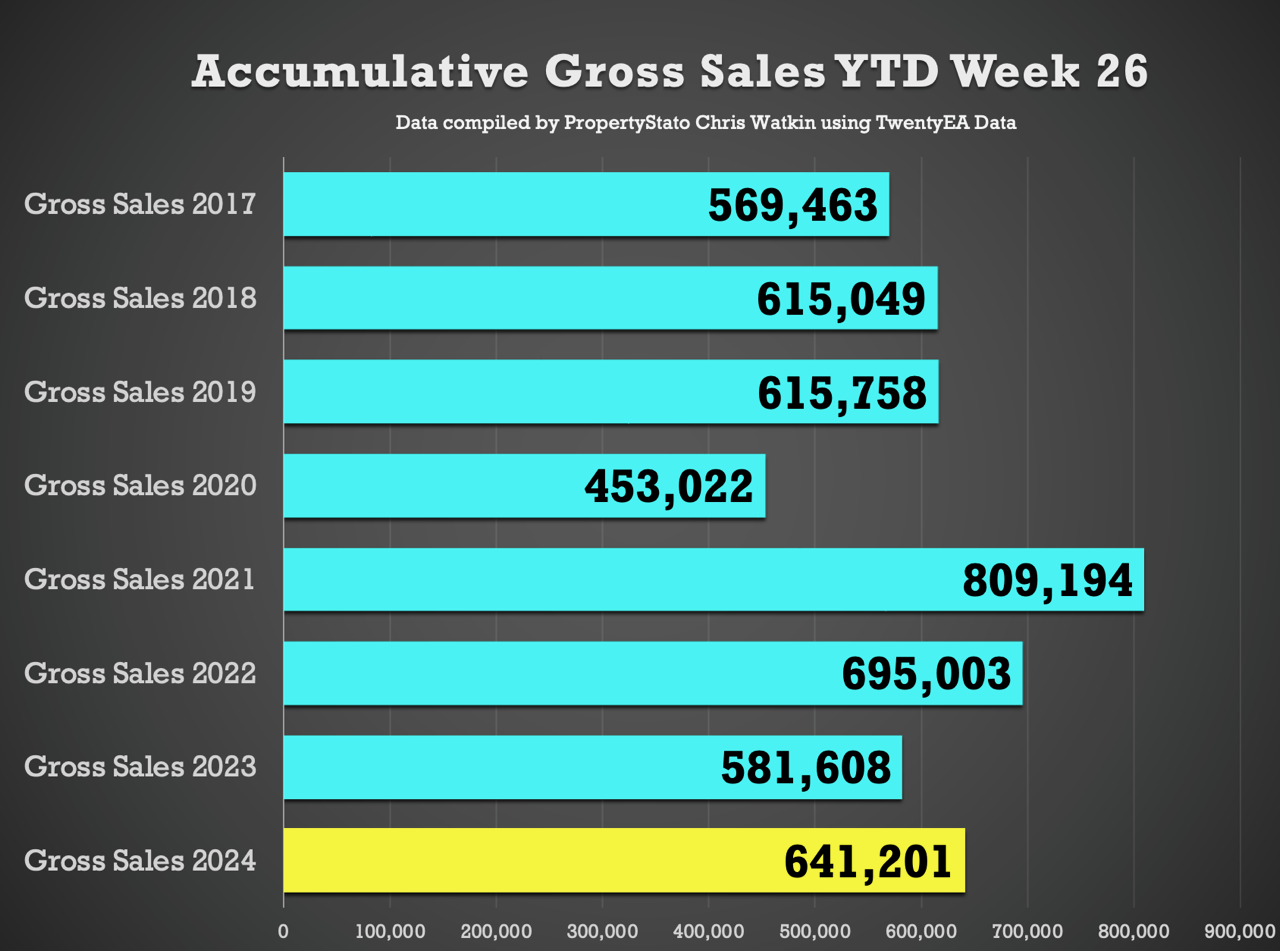
Accumulative Gross Sales YTD: The total YTD stands at 641,201, exceeding the average YTD Gross sales figure of 600,090 from 2017/18/19 and 581,608 in the same week 26 in 2023.
* Average Asking Price of Sold STC Properties: Still staying in the mid £360/380k’s range (like has been for 2 years) at £371,233.
Sale Fall Throughs: Fall thrus this week at 6,170. Last 3 months weekly average 5,977.
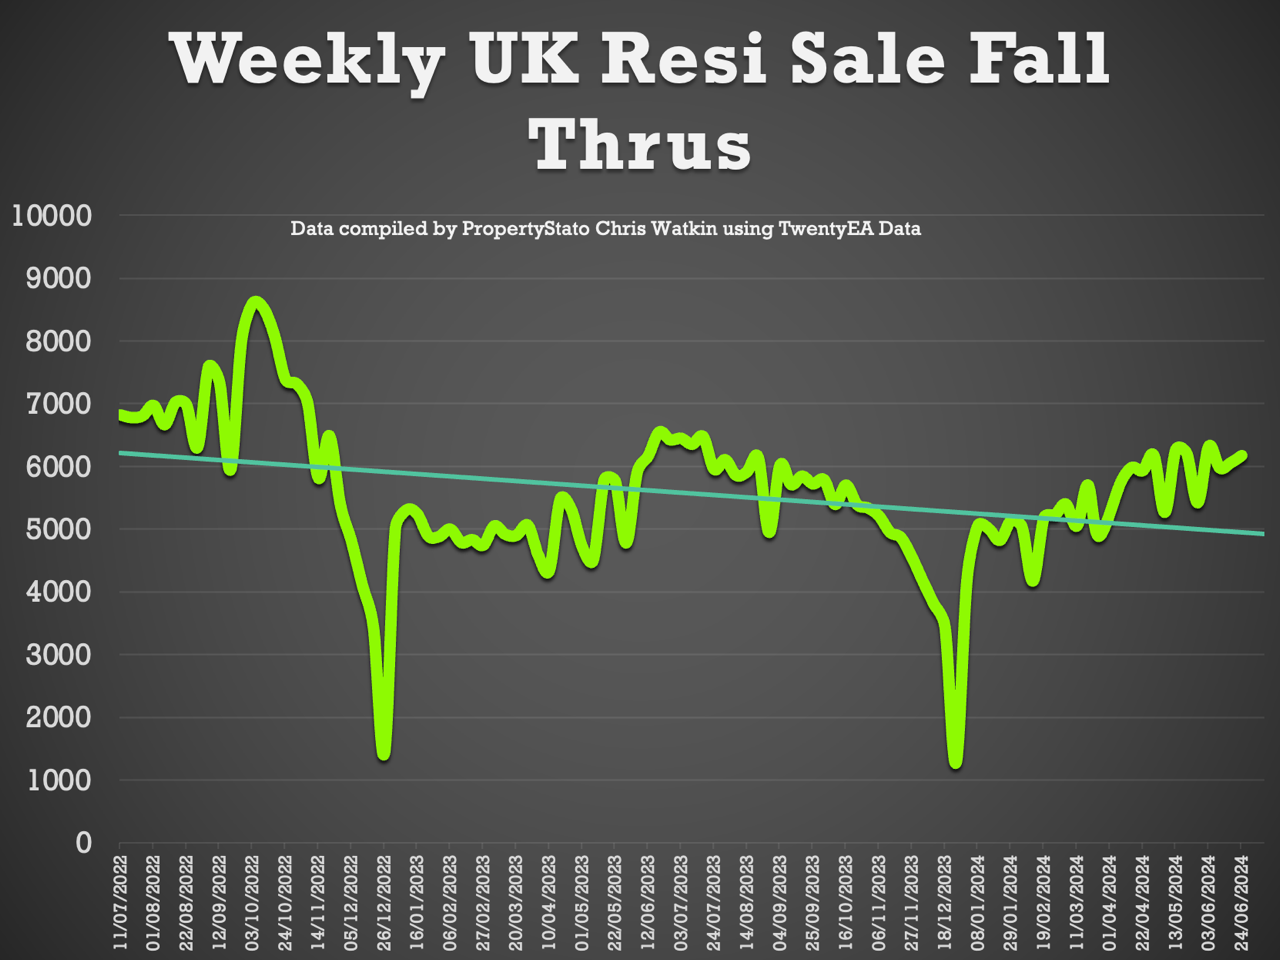
* Sale Fall Through % Rate: Similar to last week at 23.6% for week 26. (Comparison – 22.5% for the last 3 months, whilst the long term 8 years average is 24.8% & it was 40%+ in Q4 2022 – the Truss budget!)
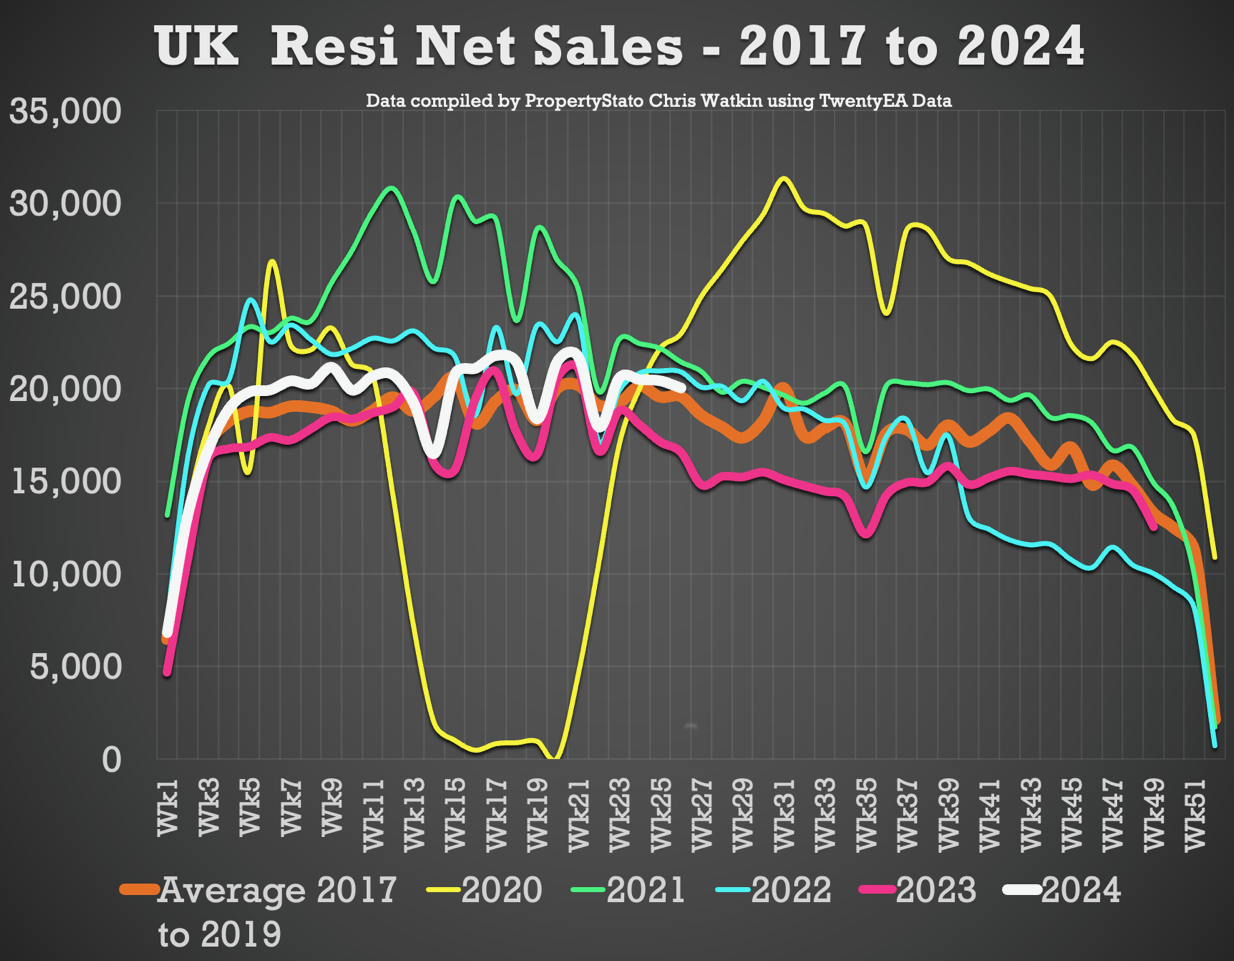
* Net Sales – 20,028 – 4.1% higher than the 2024 weekly average of 19,235.
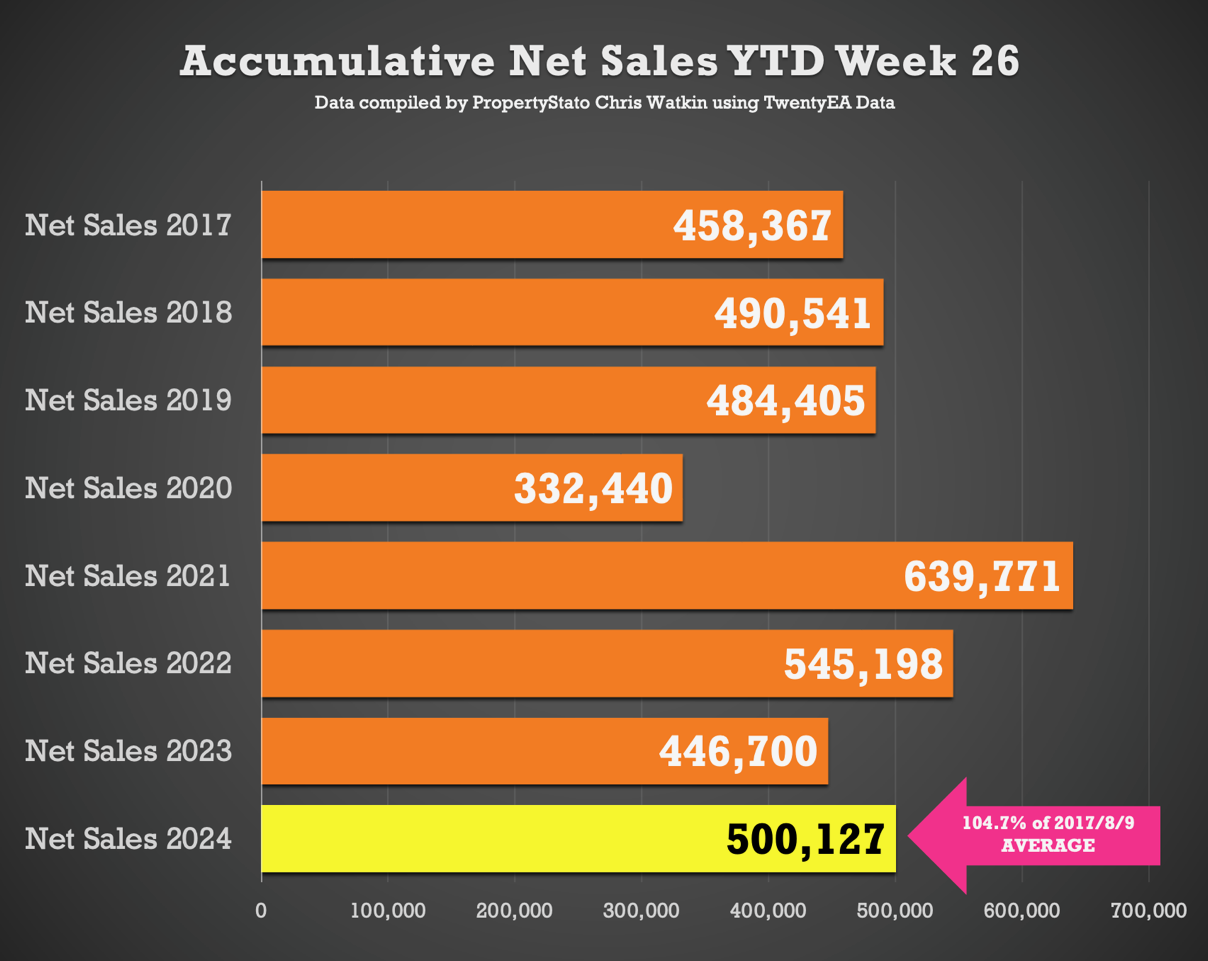
Accumulative Net Sales YTD: The total stands at 500,127, 4.7% higher the 17/18/19 YTD Net sales average (477,771) and 12% higher than the YTD figure for 2023 for Net Sales.
House Prices on the House sales agreed (SSTC)in June MTD are at £348/sq.ft. For comparison – in May ’24 in £348/sq.ft, April ’24 – £344/sq.ft, March ’24 – £339/sq.ft, Feb ’24 -£339/sq.ft & Jan ’24 to £331/sq.ft).
This week’s local focus is on Runcorn.
Comments are closed.