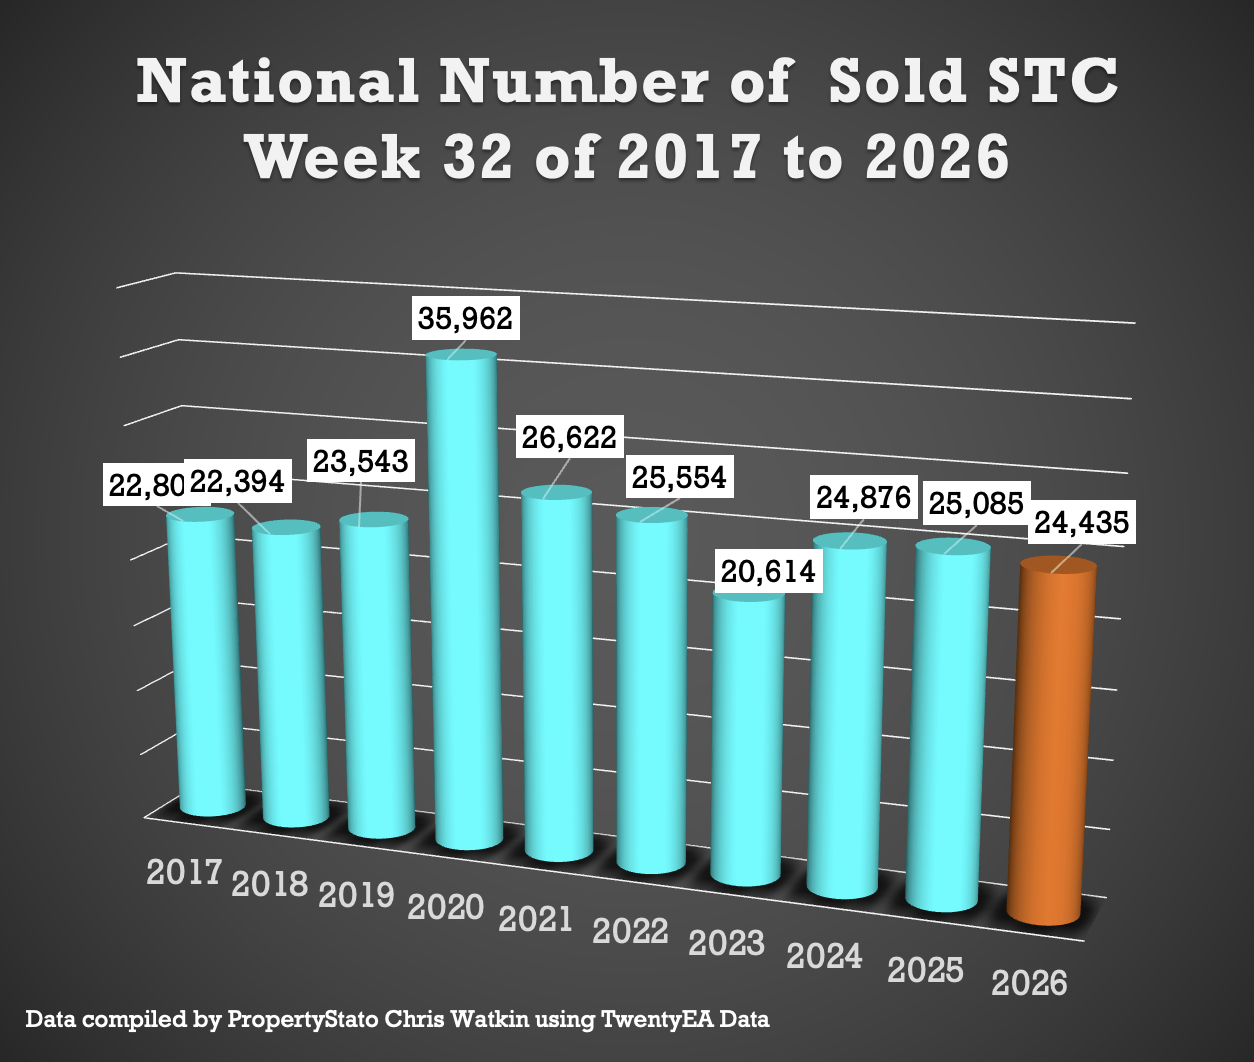
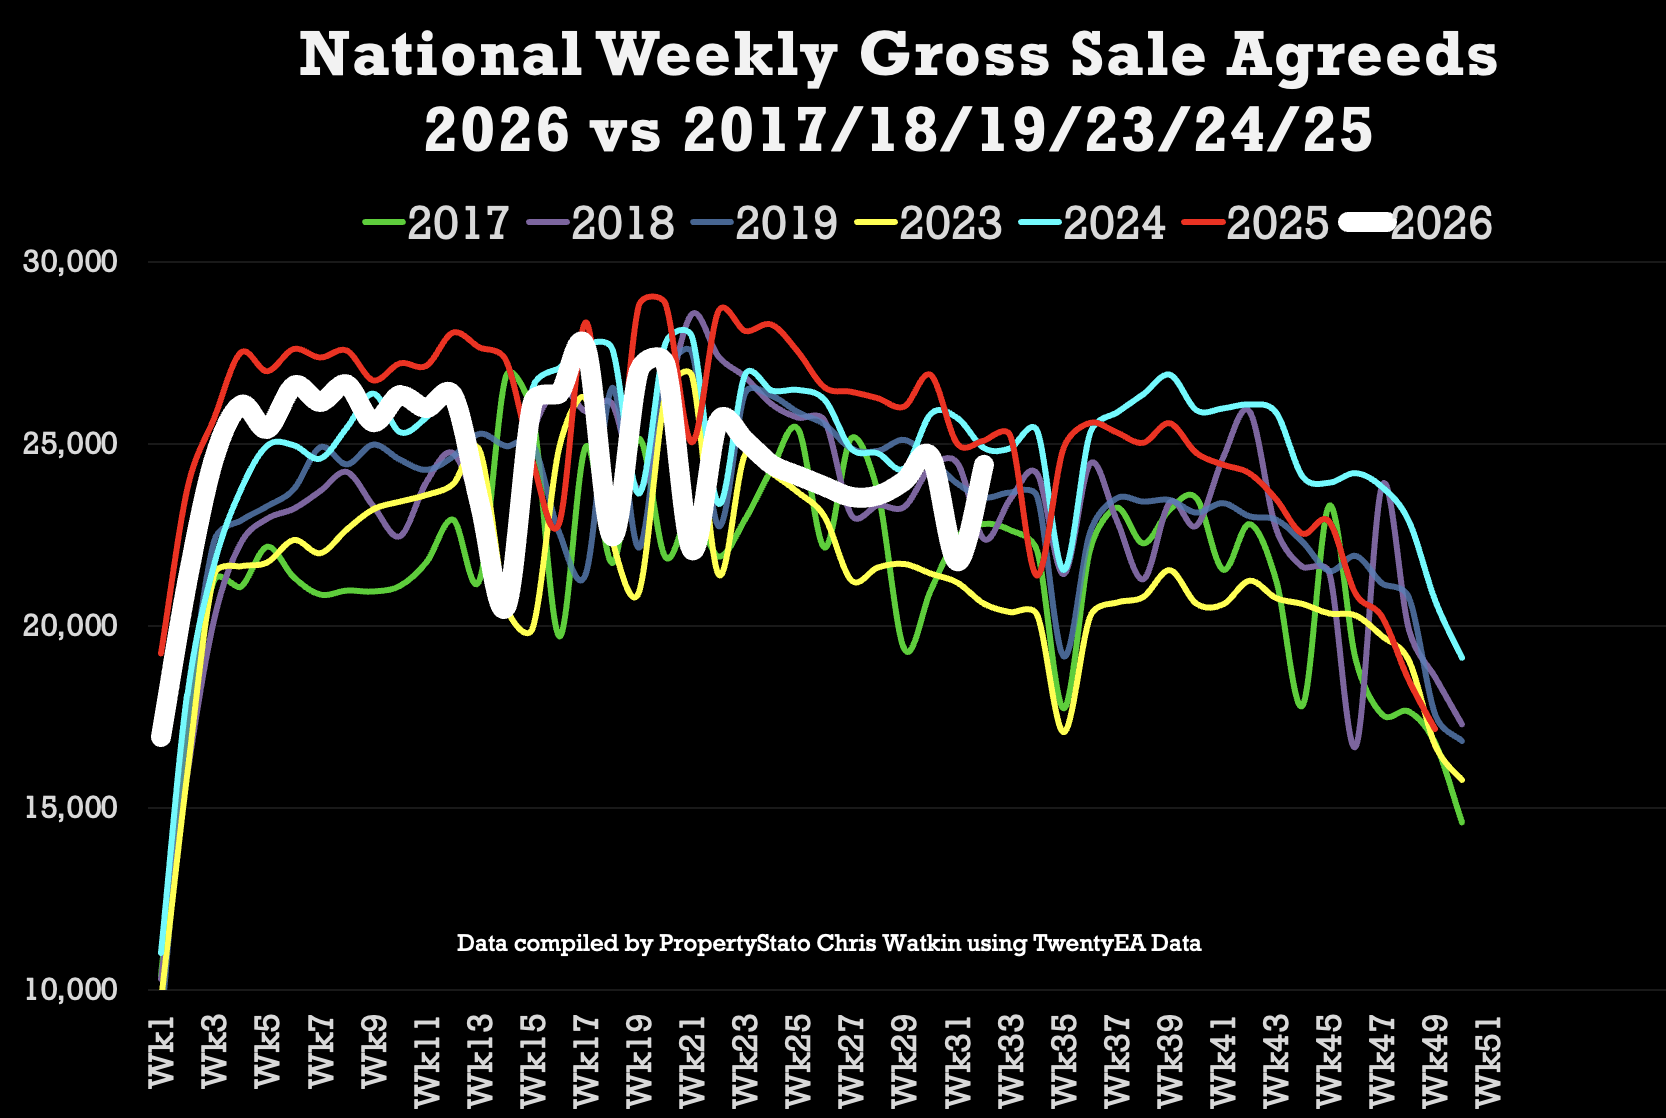
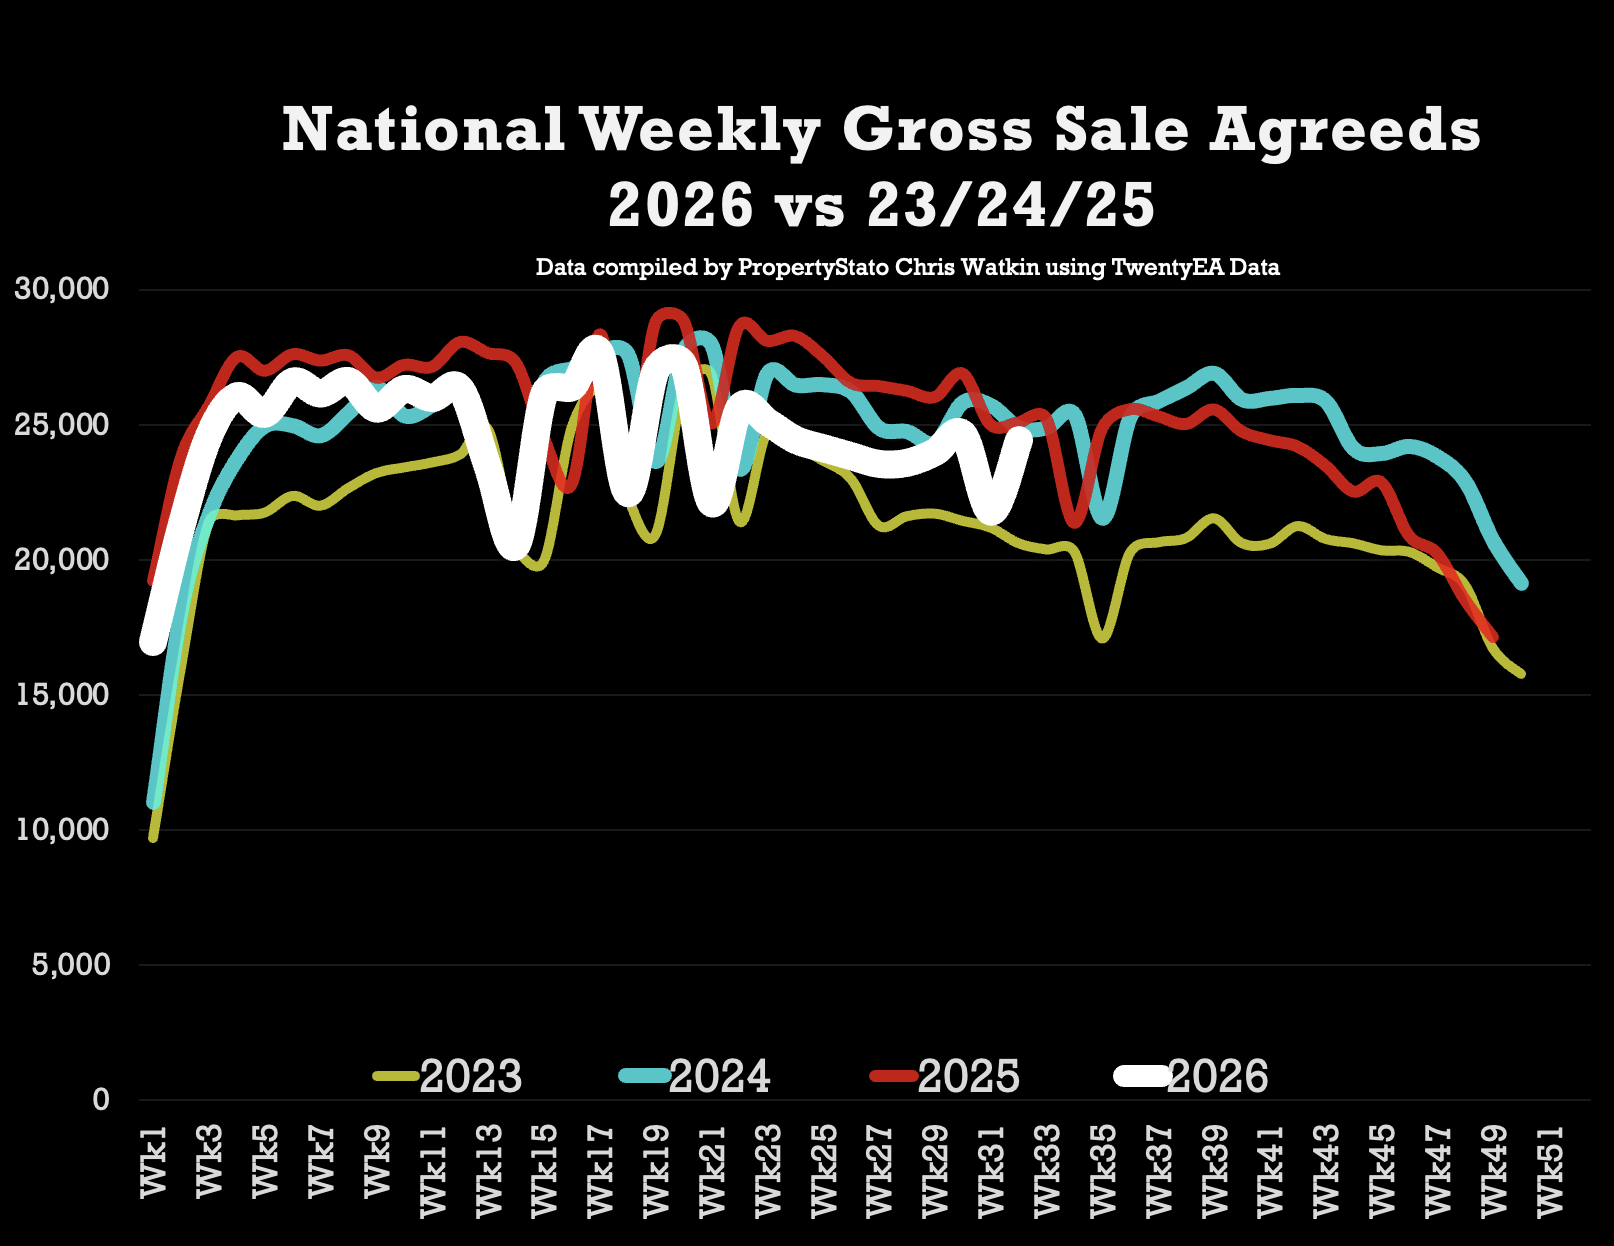
After last week’s unexpected drop in sales agreed, the UK property market has bounced back. 24.4k homes went sold subject to contract in Week 32, up from around the unexpected drop to 21.7k the week before and much closer to where we would expect the market to be at this point in August. The evidence increasingly suggests last week’s fall may simply have been a hangover from the hot weather, or higher numbers of people on holiday and the summer slowdown, rather than anything more sinister.
Yet beneath that headline, the market remains brutally price sensitive. Half the homes leaving estate agents’ books are still withdrawing unsold, while four out of five homes listed and sold so far in 2026 achieved that sale without needing a price reduction. The message is becoming increasingly difficult to ignore – getting the pricing strategy right from the beginning matters enormously.
This week in the YouTube video, I am joined by Iain White, one of the property industry’s most experienced operators, to dissect the numbers, graphs, charts and discuss where estate agents are getting it right and wrong.
Then Iain and myself head to Oxford, where we use cold, hard data to compare its estate agents on market share, exchanges, withdrawals, pricing, fall-throughs and the prices they actually achieve for their sellers and see who is the best estate agent in the city.
These are the main stats for week 32, week ending 16th August 2026.
Listings
Week 32
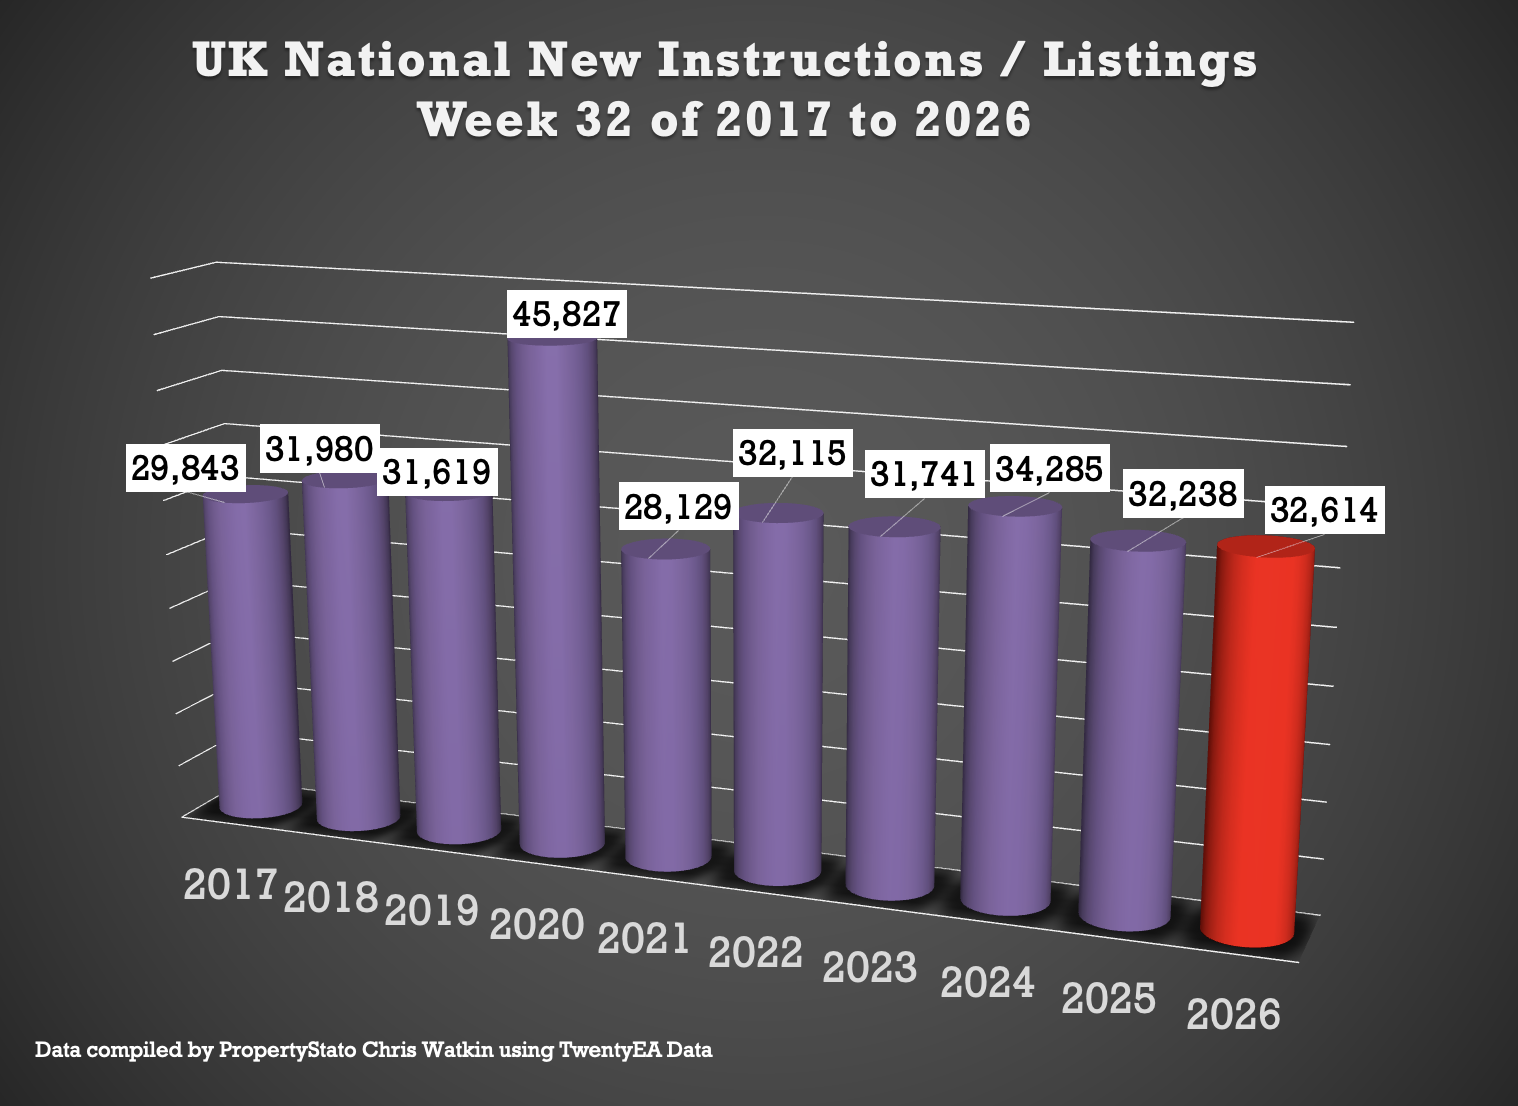
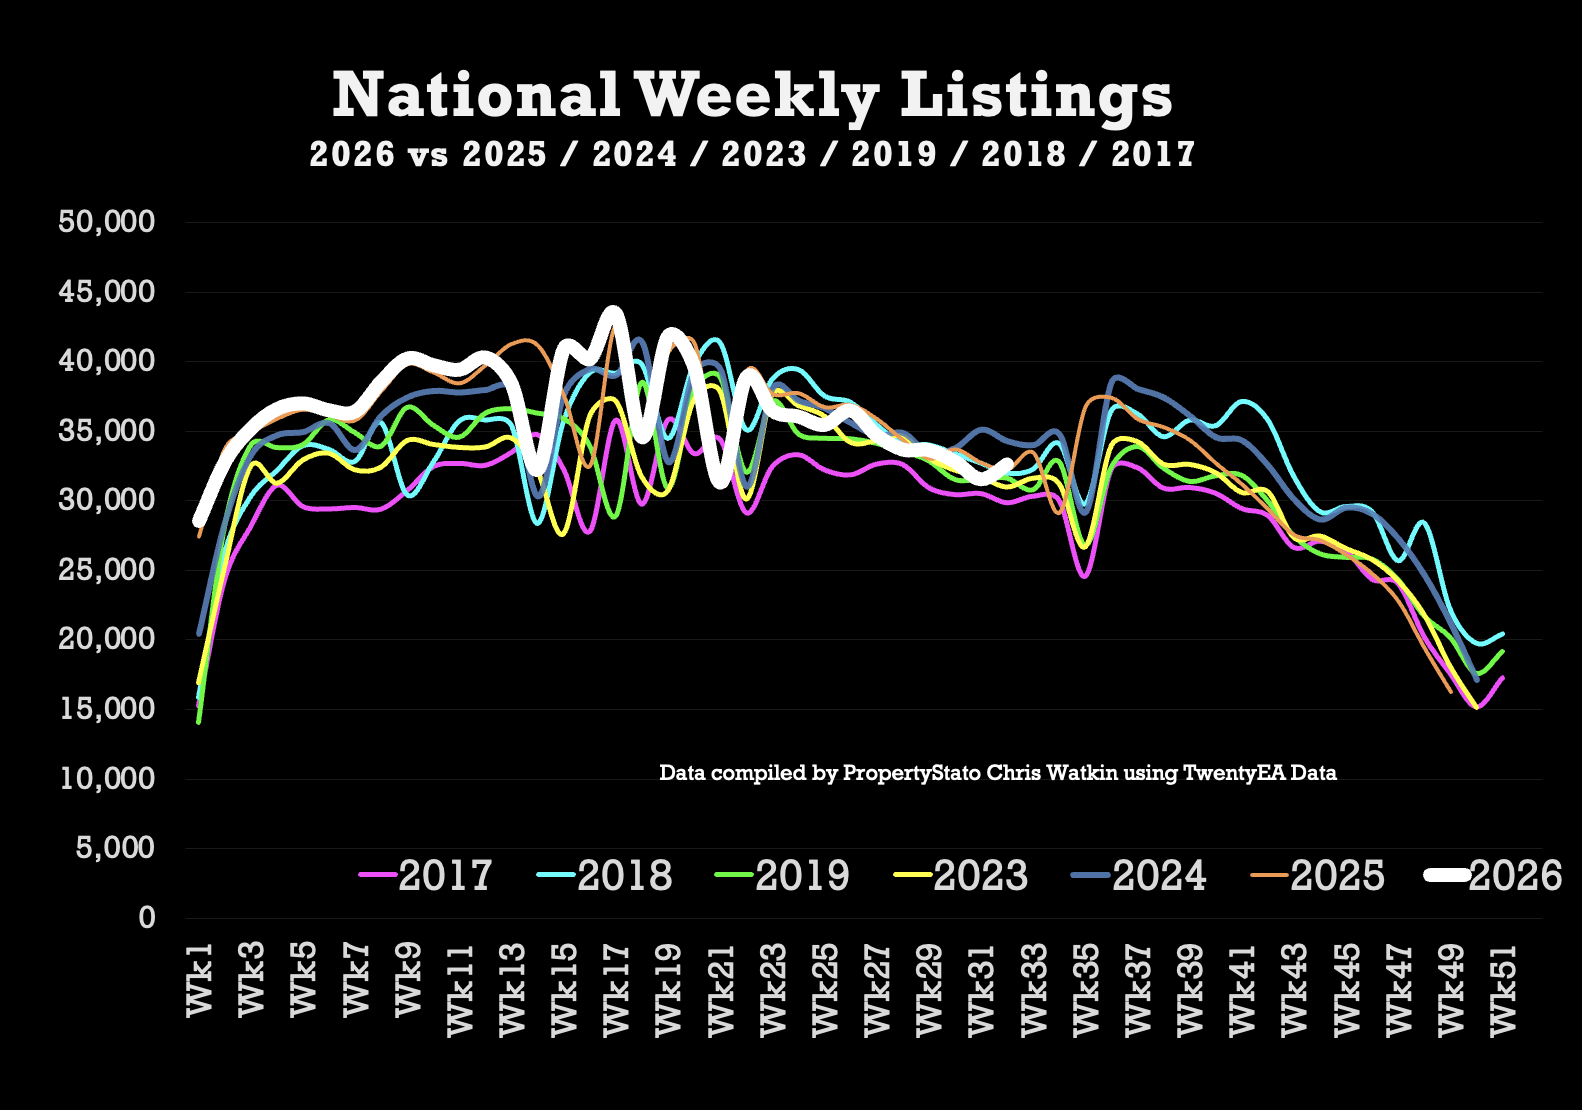
32.6k new listings this week, (31.5k last week).
Weekly 2026 average: 36.4k.
10 year week 30 average: 33k
Year to Date
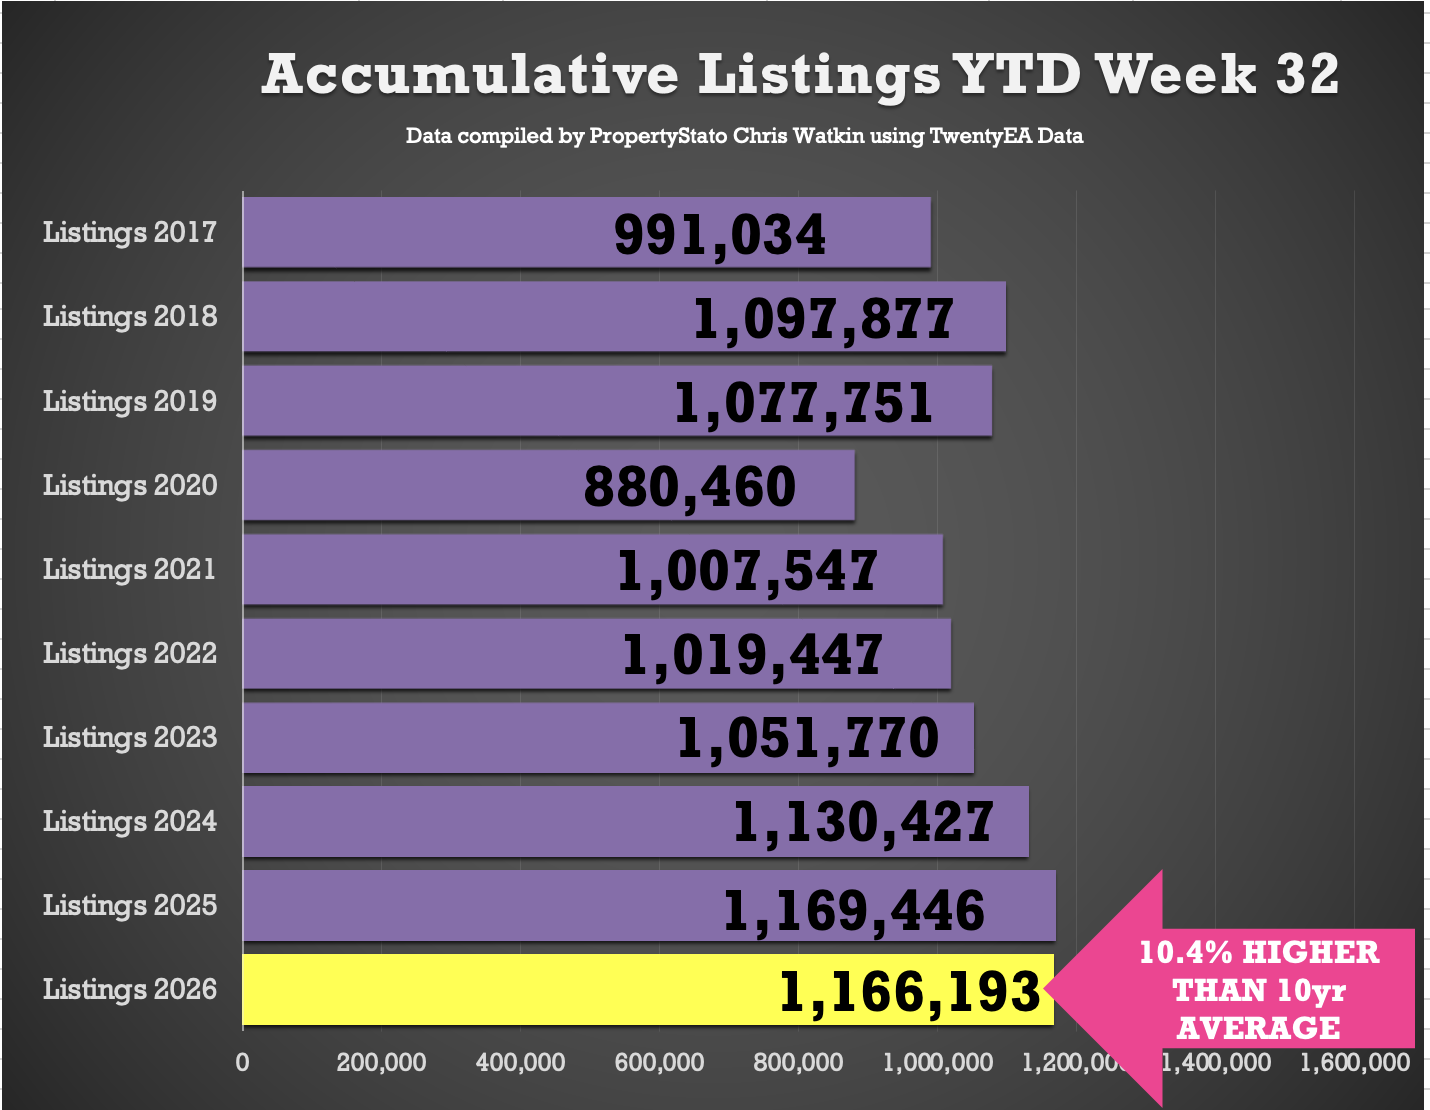
1.166m new listings YTD
0.3% lower than 2025 YTD (1.169m)
3.2% ahead of 2024 YTD (1.130m)
10.5% higher than the 2017–19 average YTD (1.059m).
UK Gross Resi Sales
Week 32
24.4k homes sold STC this week 32 (21.8k last week)
10 year week 32 average: 25.2k
2026 weekly average: 24.6k
Year to date for house sales
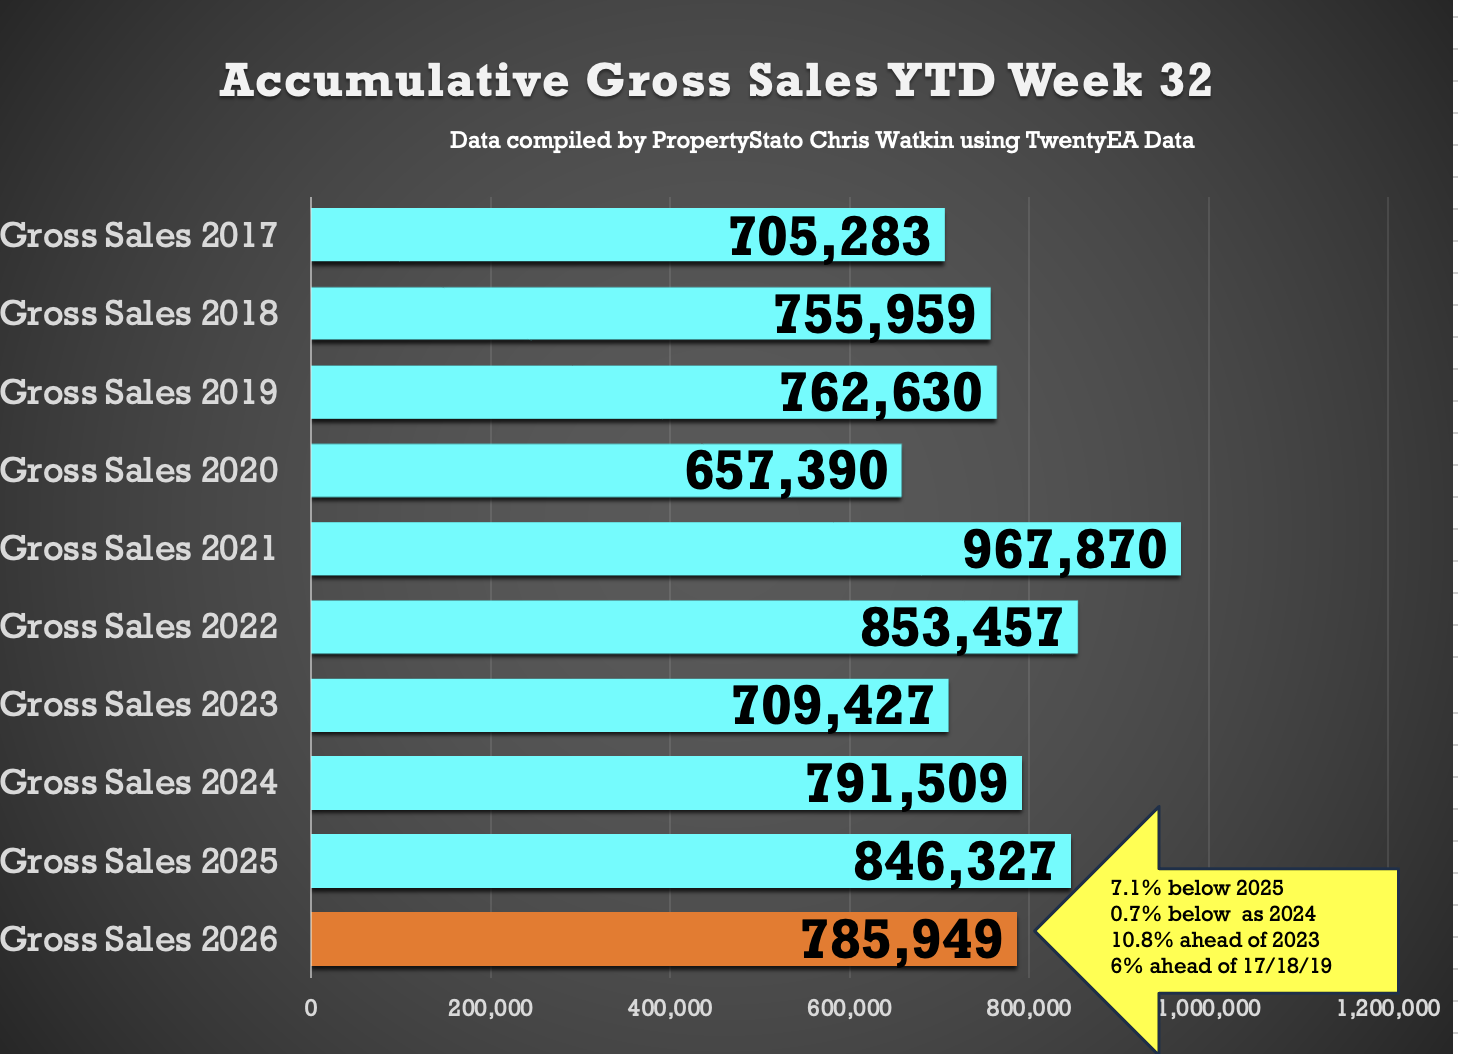
786k UK homes sold STC YTD
7.1% lower than 2025 YTD (846k)
0.7% lower to 2024 YTD (792k)
10.8% higher than 2023 YTD (709k)
6% higher above pre-Covid 2017-19 years (742k)
Decade average – 784k YTD.
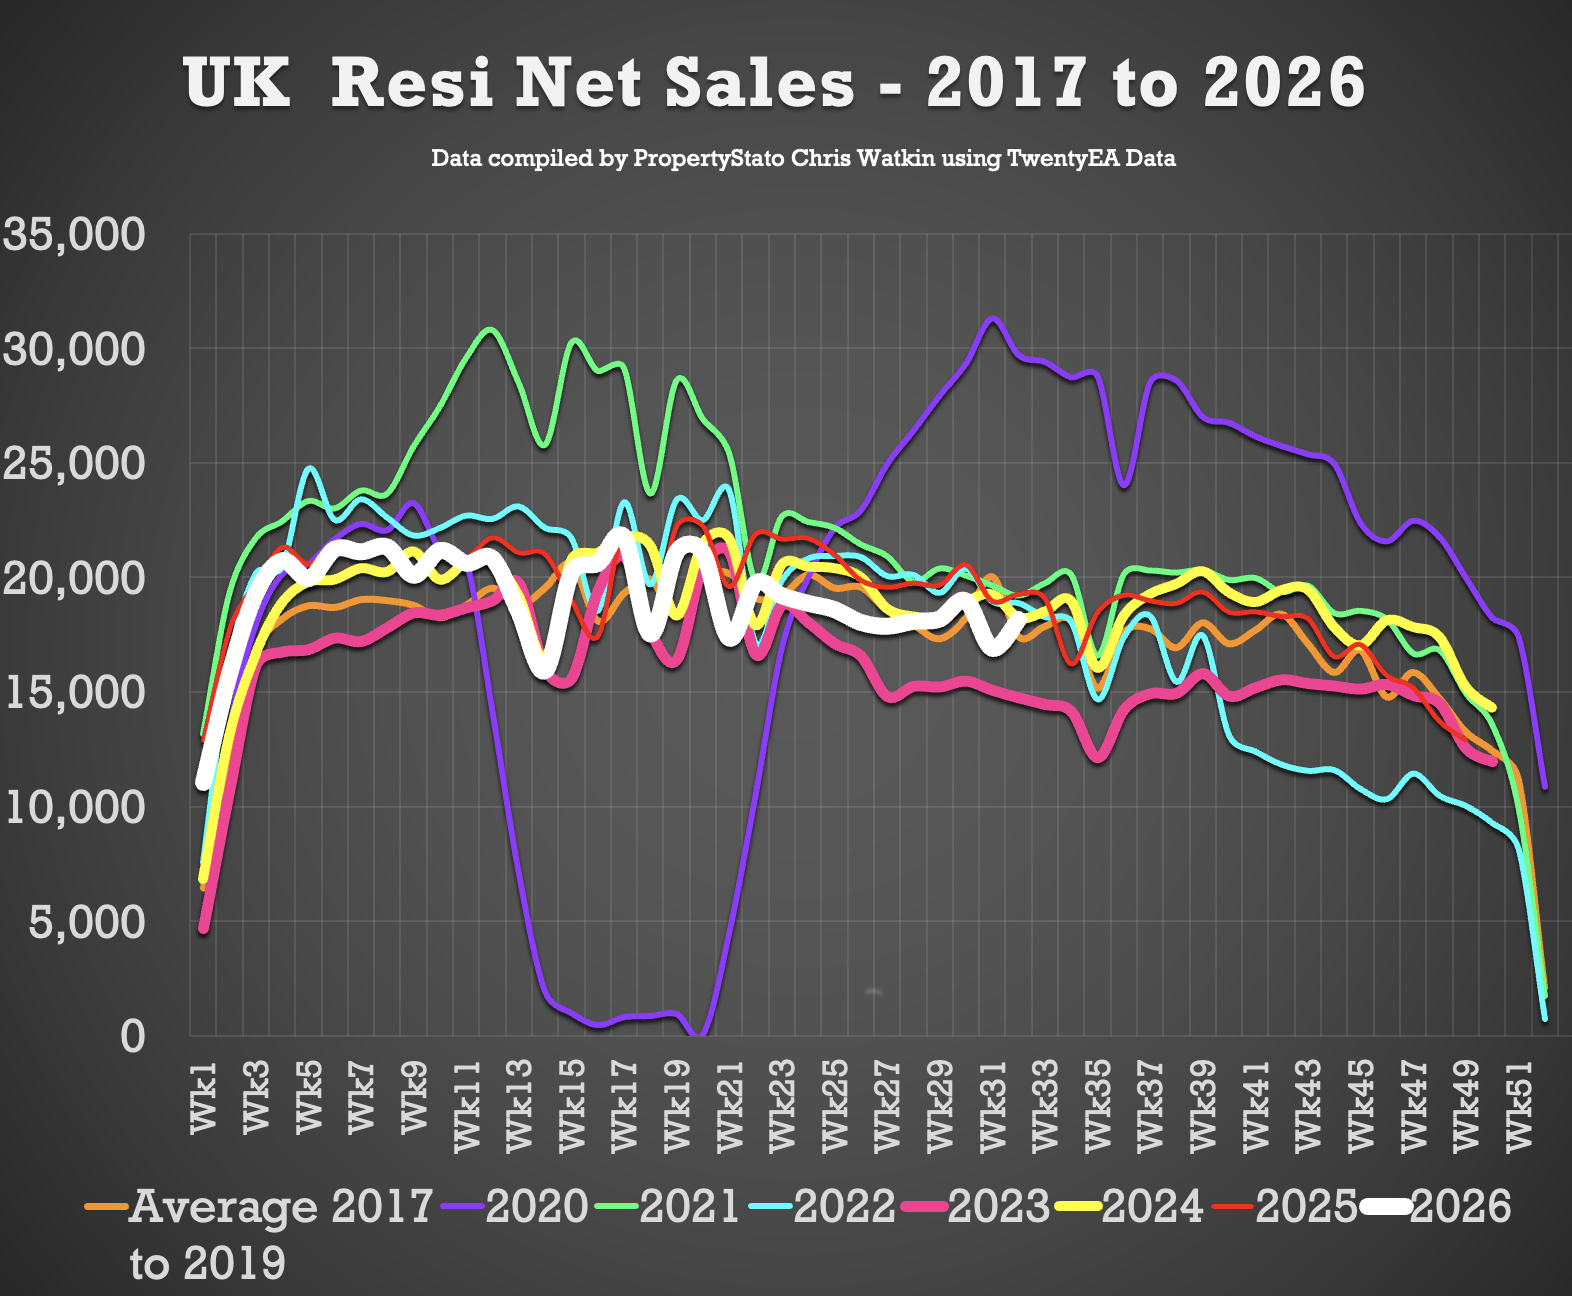
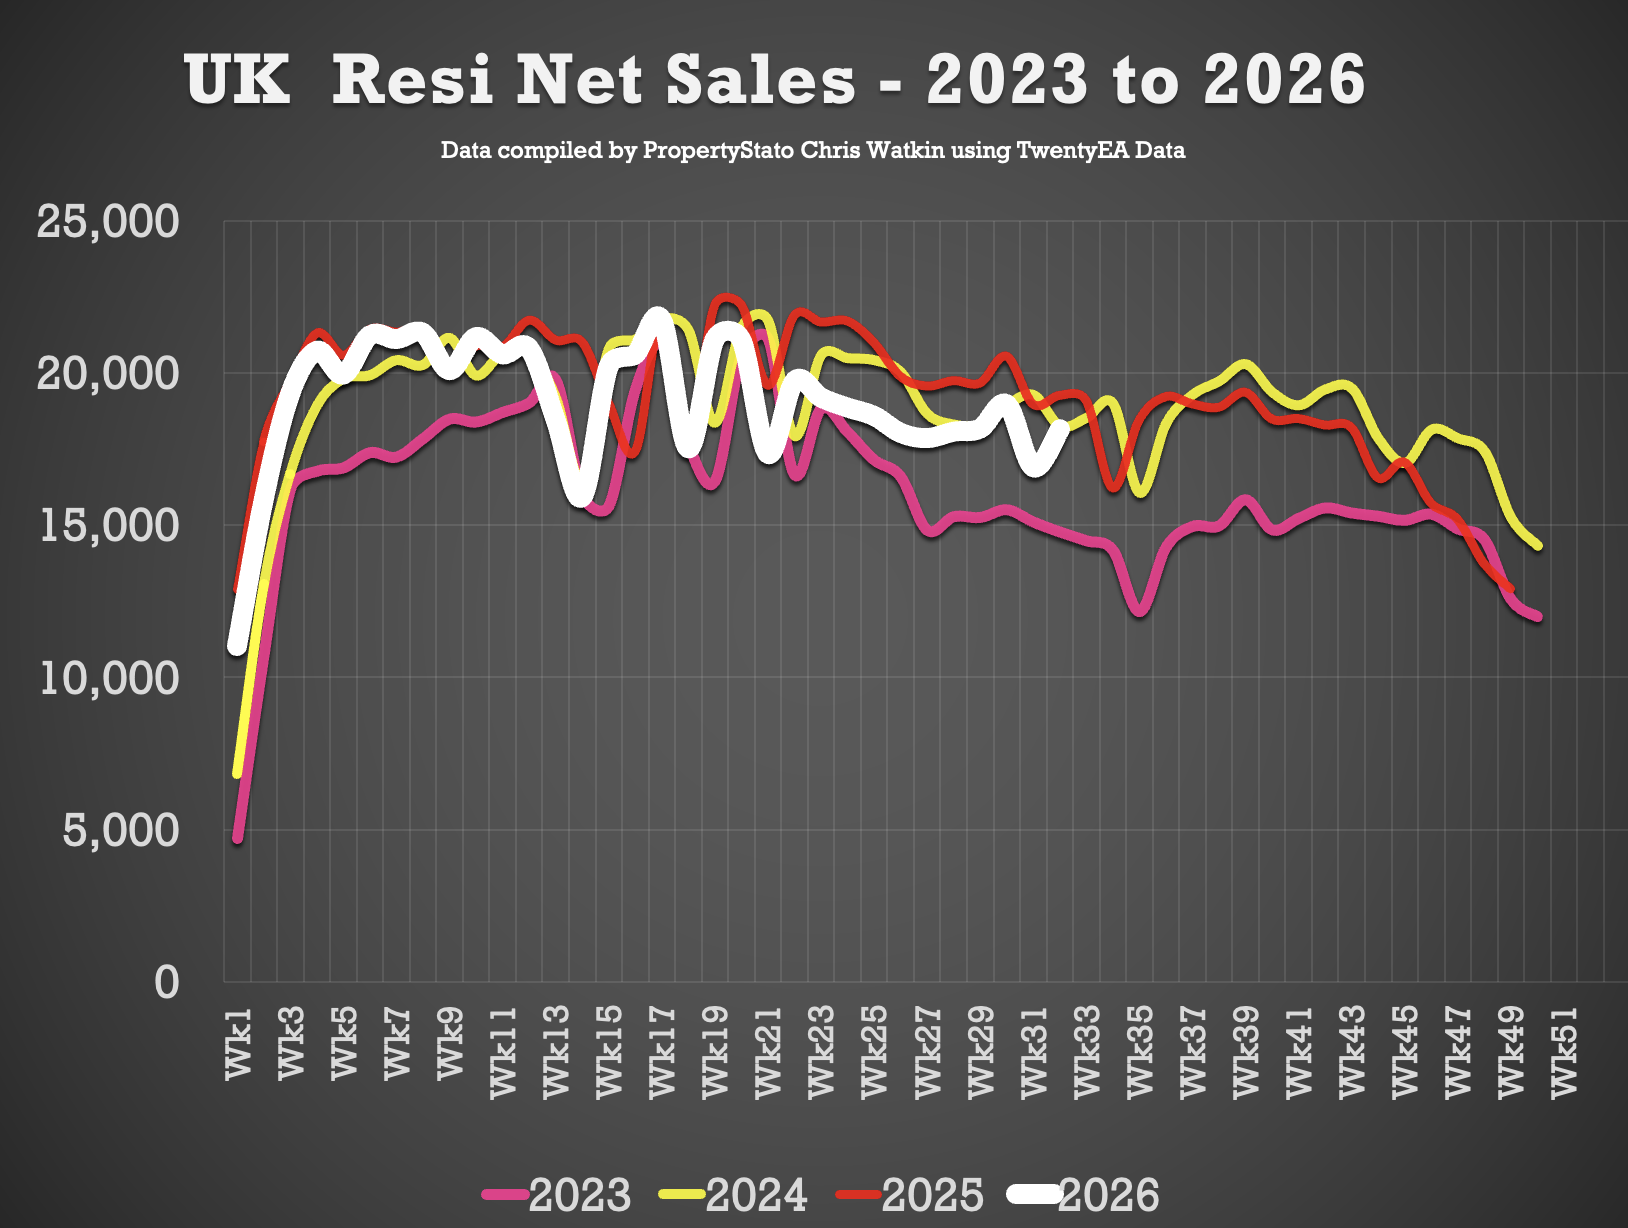
UK Net Resi Sales YTD
(Net sales being gross sales less sale fall-throughs)
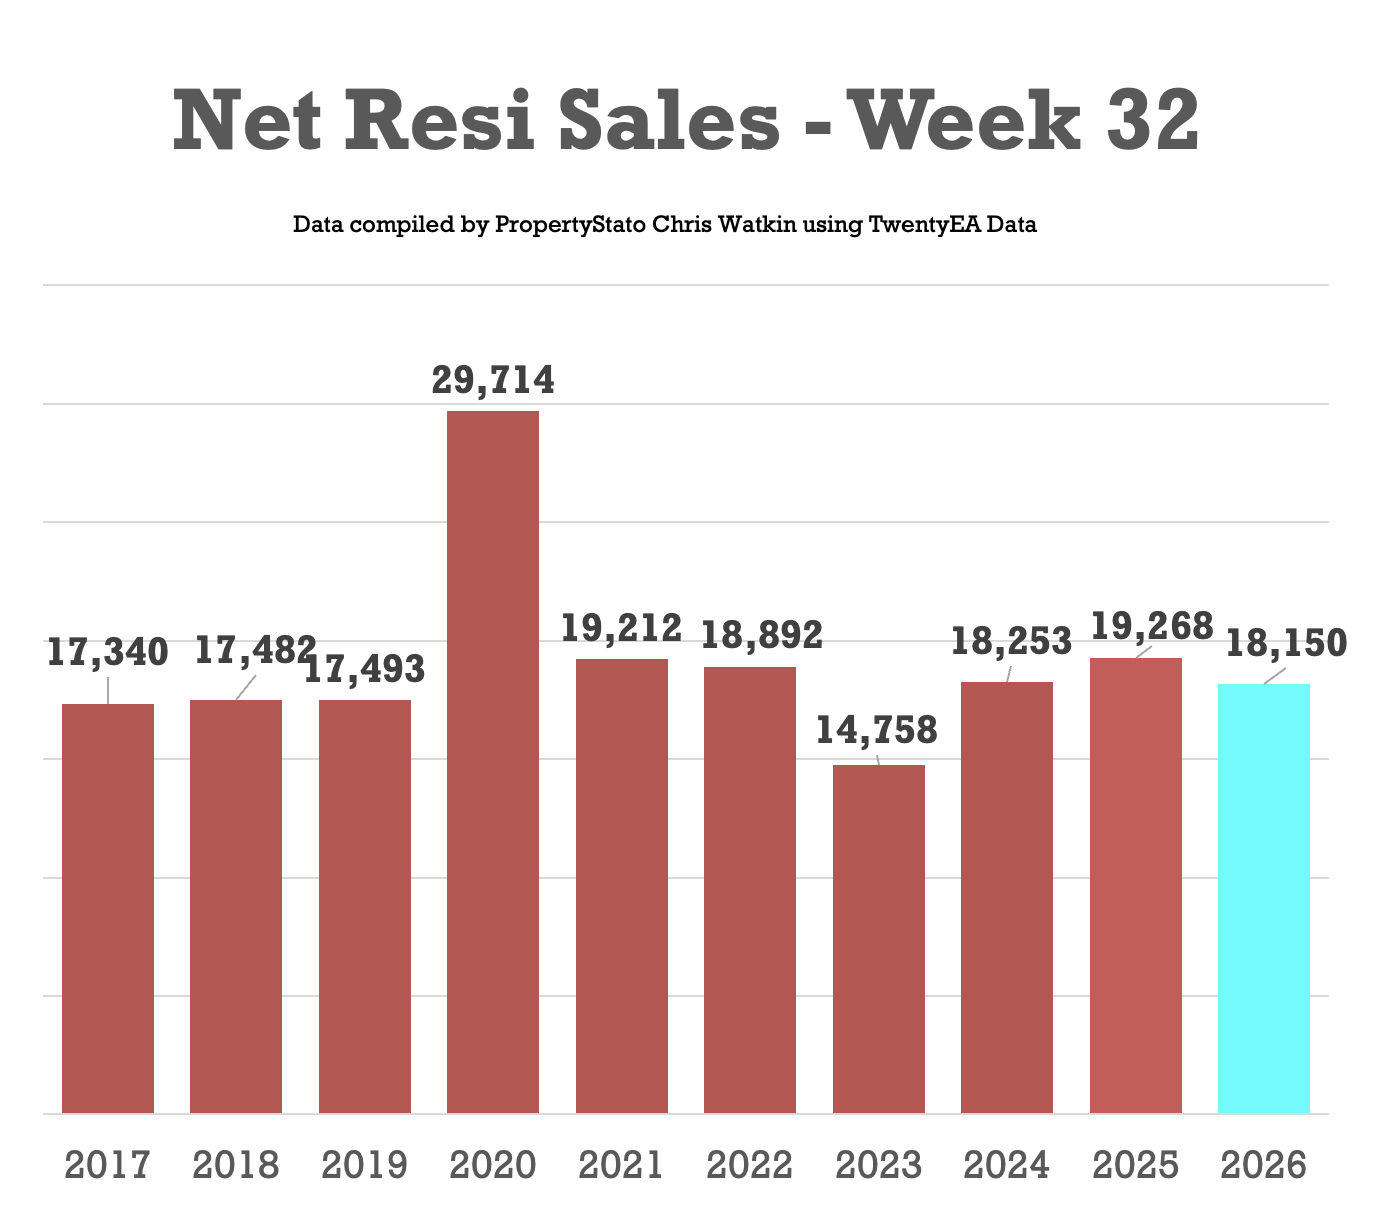
Week 32
18.2k net sales (16.9k last week)
10 year Week 32 average: 19.1k
Weekly average for 2026: 19.1k
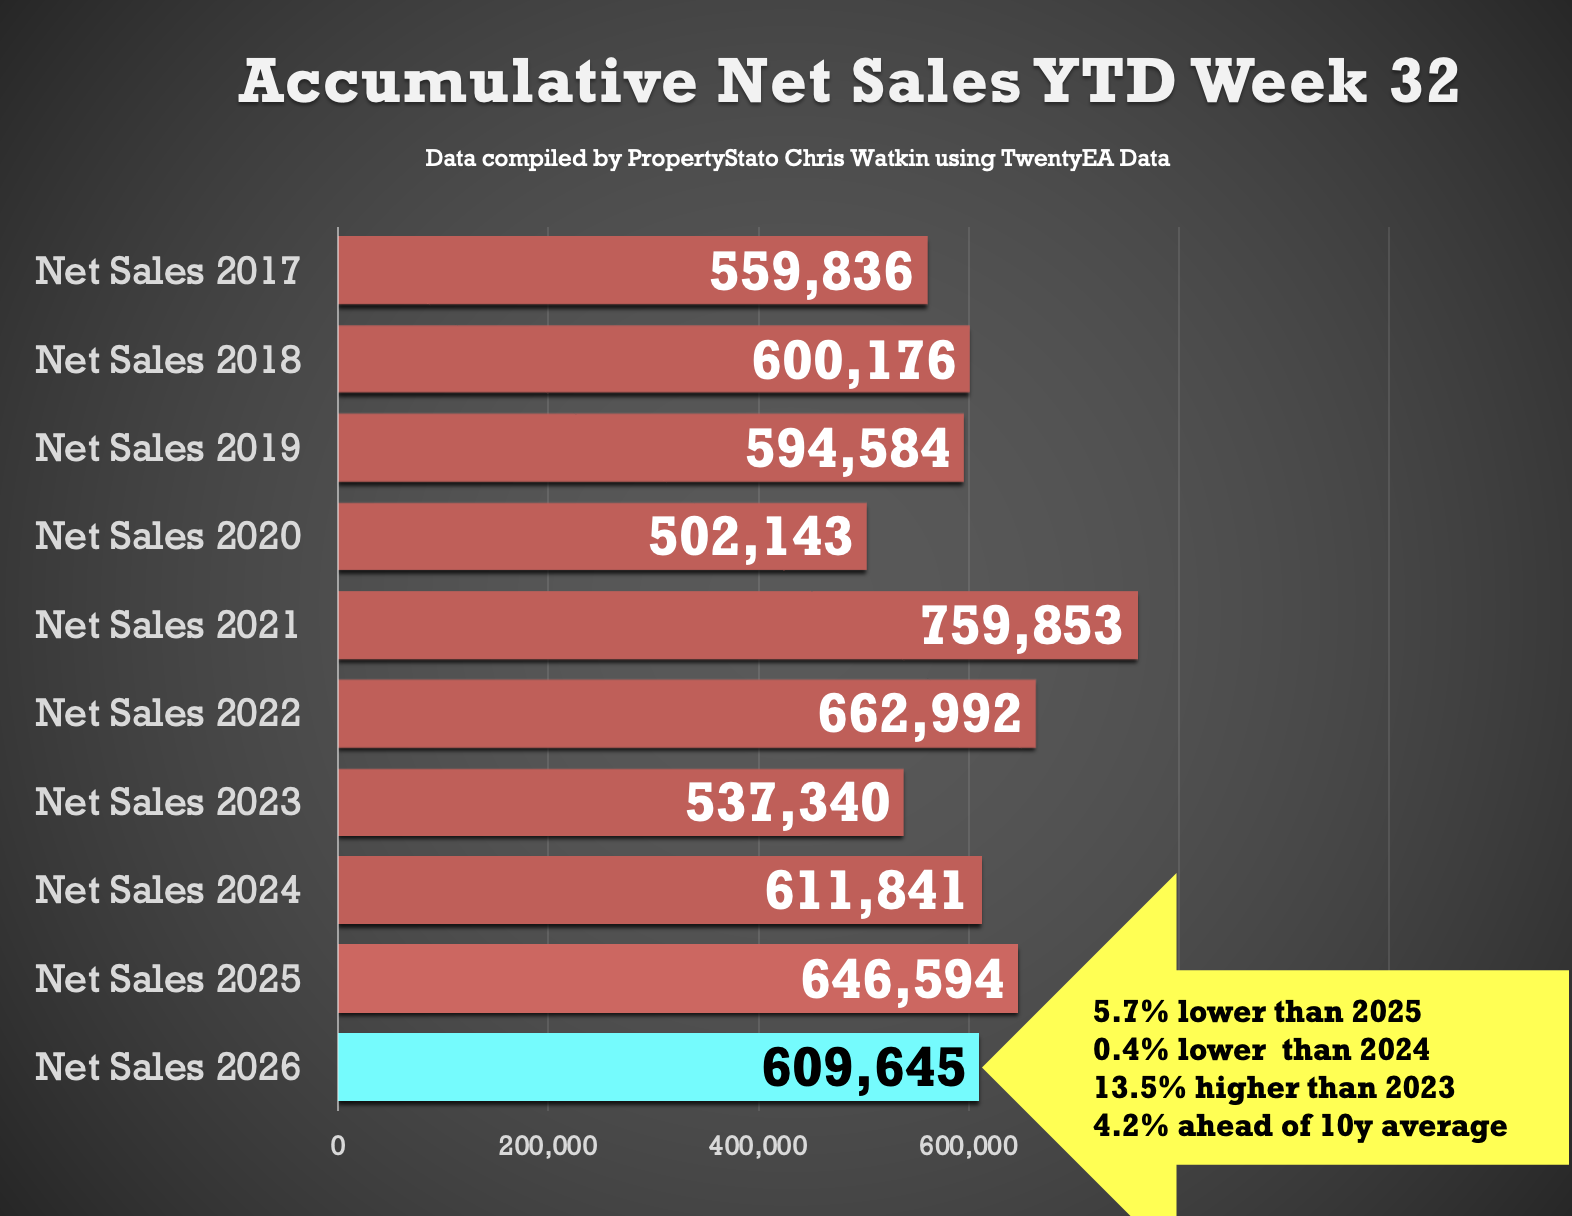
Year to date
609k UK net home sales YTD
5.7% lower than 2025 (647k)
0.4% lower than 2024 (612k)
13.5% ahead of 2023 (537k)
4.2% above the 2017–19 average (585k)
Exchanges & Withdrawals
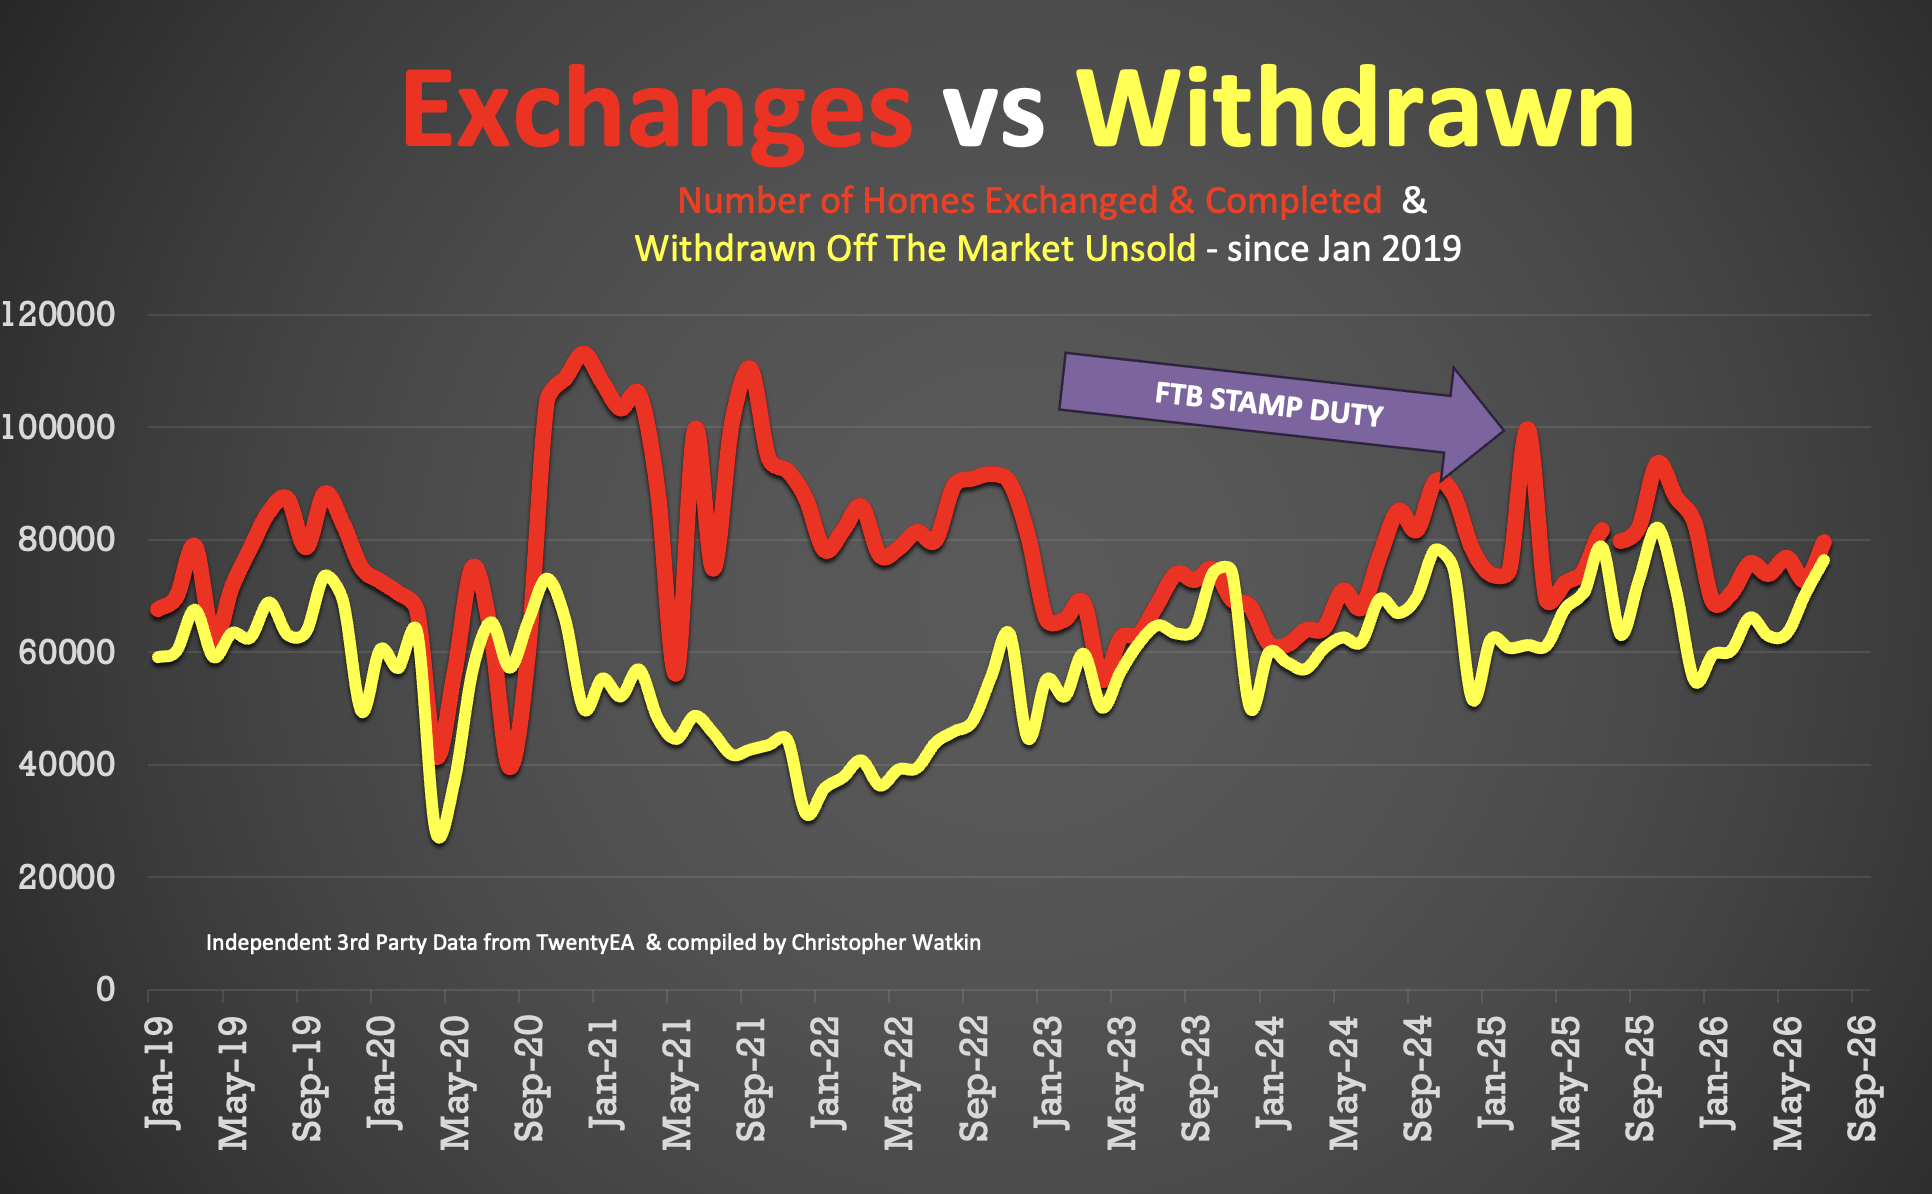
- 79.6k Exchanges in July 2026 (note this figure will rise during August as more exchanges get reported)
- 76.3k Withdrawals in July 2026 – again, this figure will increase as more July withdrawals come through the system throughout August
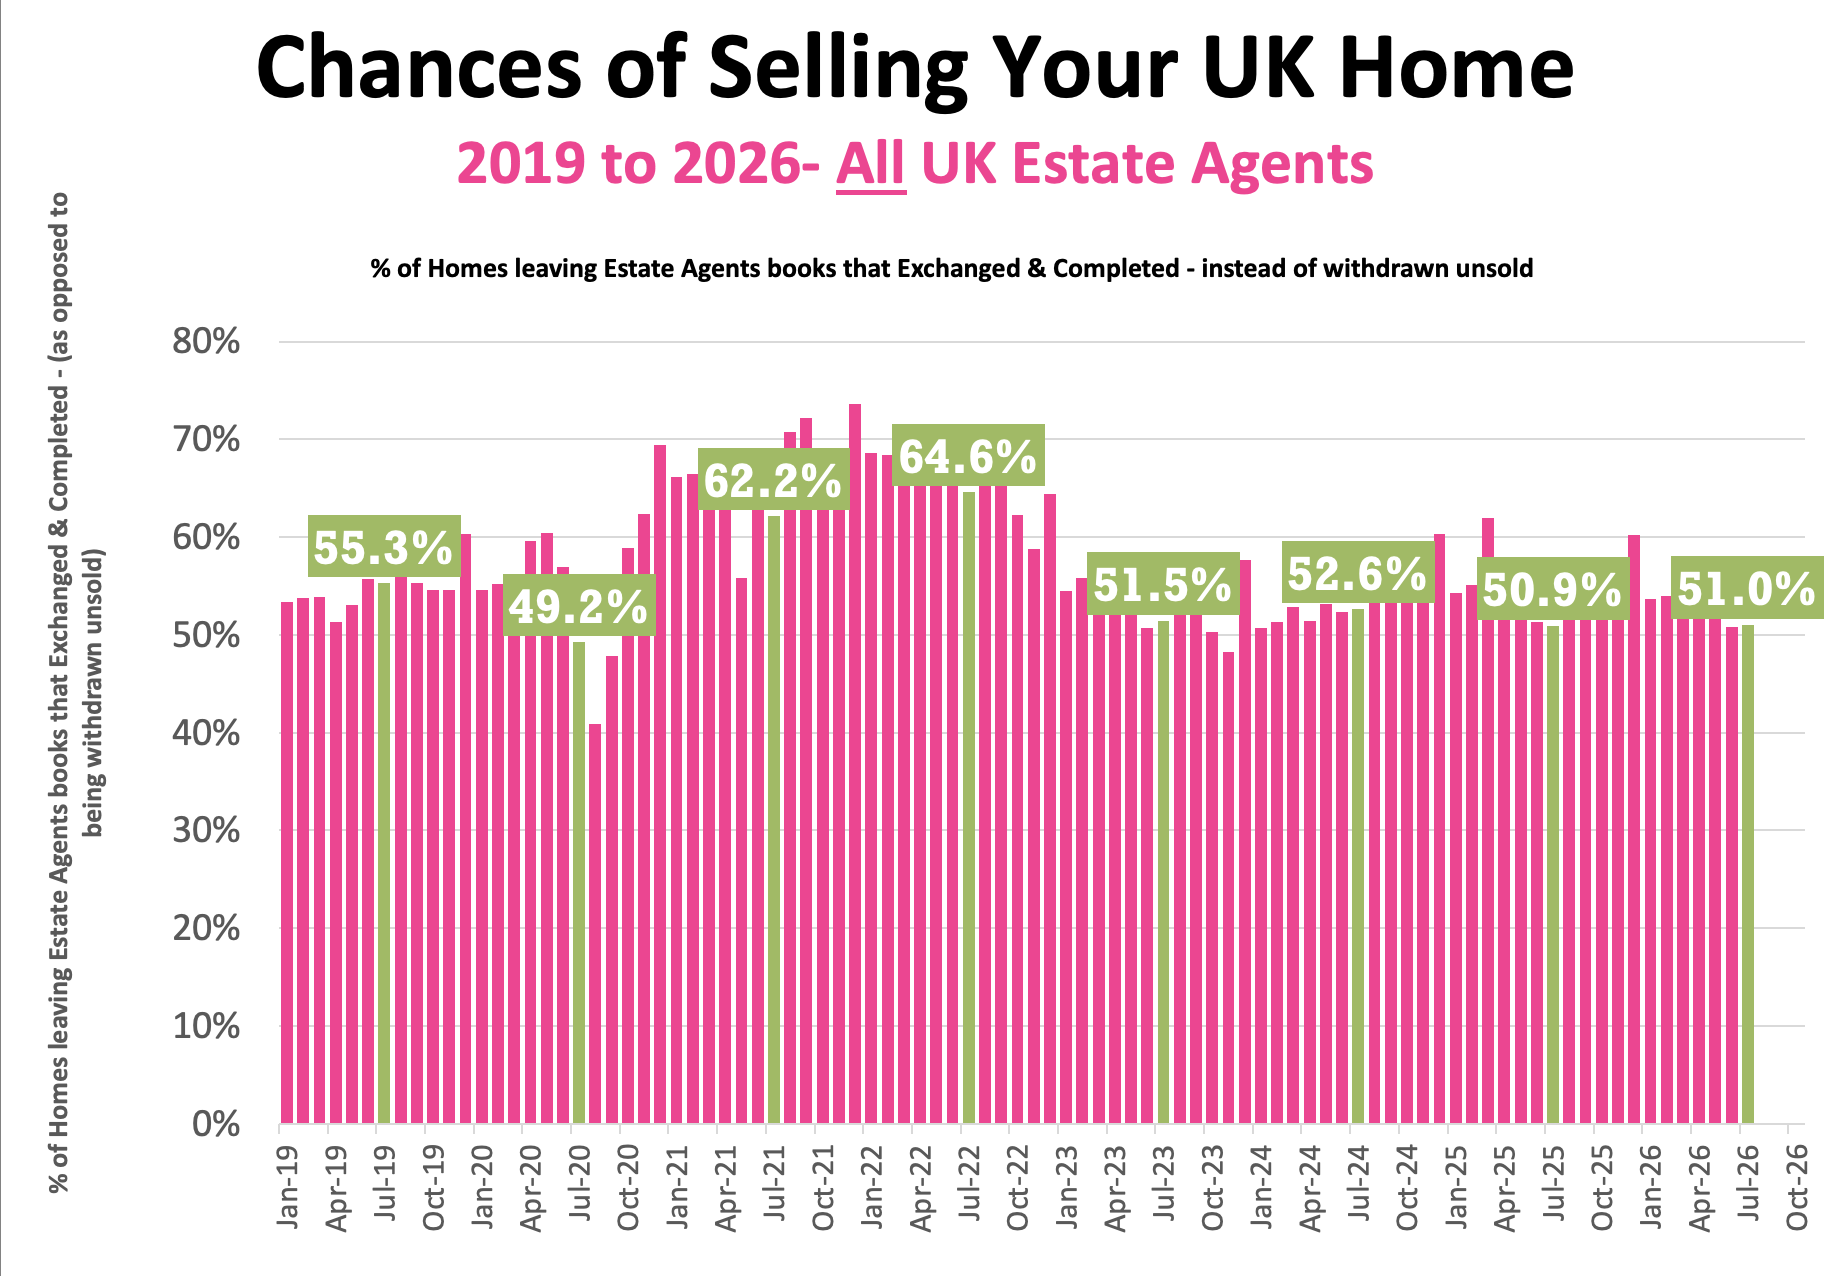
- Therefore, in July 2026, only 51% of homes that left agents’ books exchanged and completed in July (the rest – 49% withdrew, unsold)
- 57.6% is the seven-year average exchange to listings ratio (which includes the crazy years post lockdown 18 months).
Additional info
Price reductions
- 22.5k reductions this week on 767k UK homes for sale
- 13.7% of UK homes for sale were reduced in July (down from 14.3% in June)
- 2026 YTD average 13%, versus the six-year long-term average of 11.2%
Price difference between asking price of listings and asking price of those homes that go sold STC
- 9.9% difference (long term ten-year average is 16% to 17%). (£392k ave listing ave asking price vs £357k sale agreed ave asking price)
Sell-through rate
- 14.2% of homes on agents’ books went SSTC in June 2026 (compared to 13.8% in June ’26)
- Pre-Covid average: 15.5%
Sale fall-through
- Fall-thru rate 25.7%
- Decade average: 24.5%
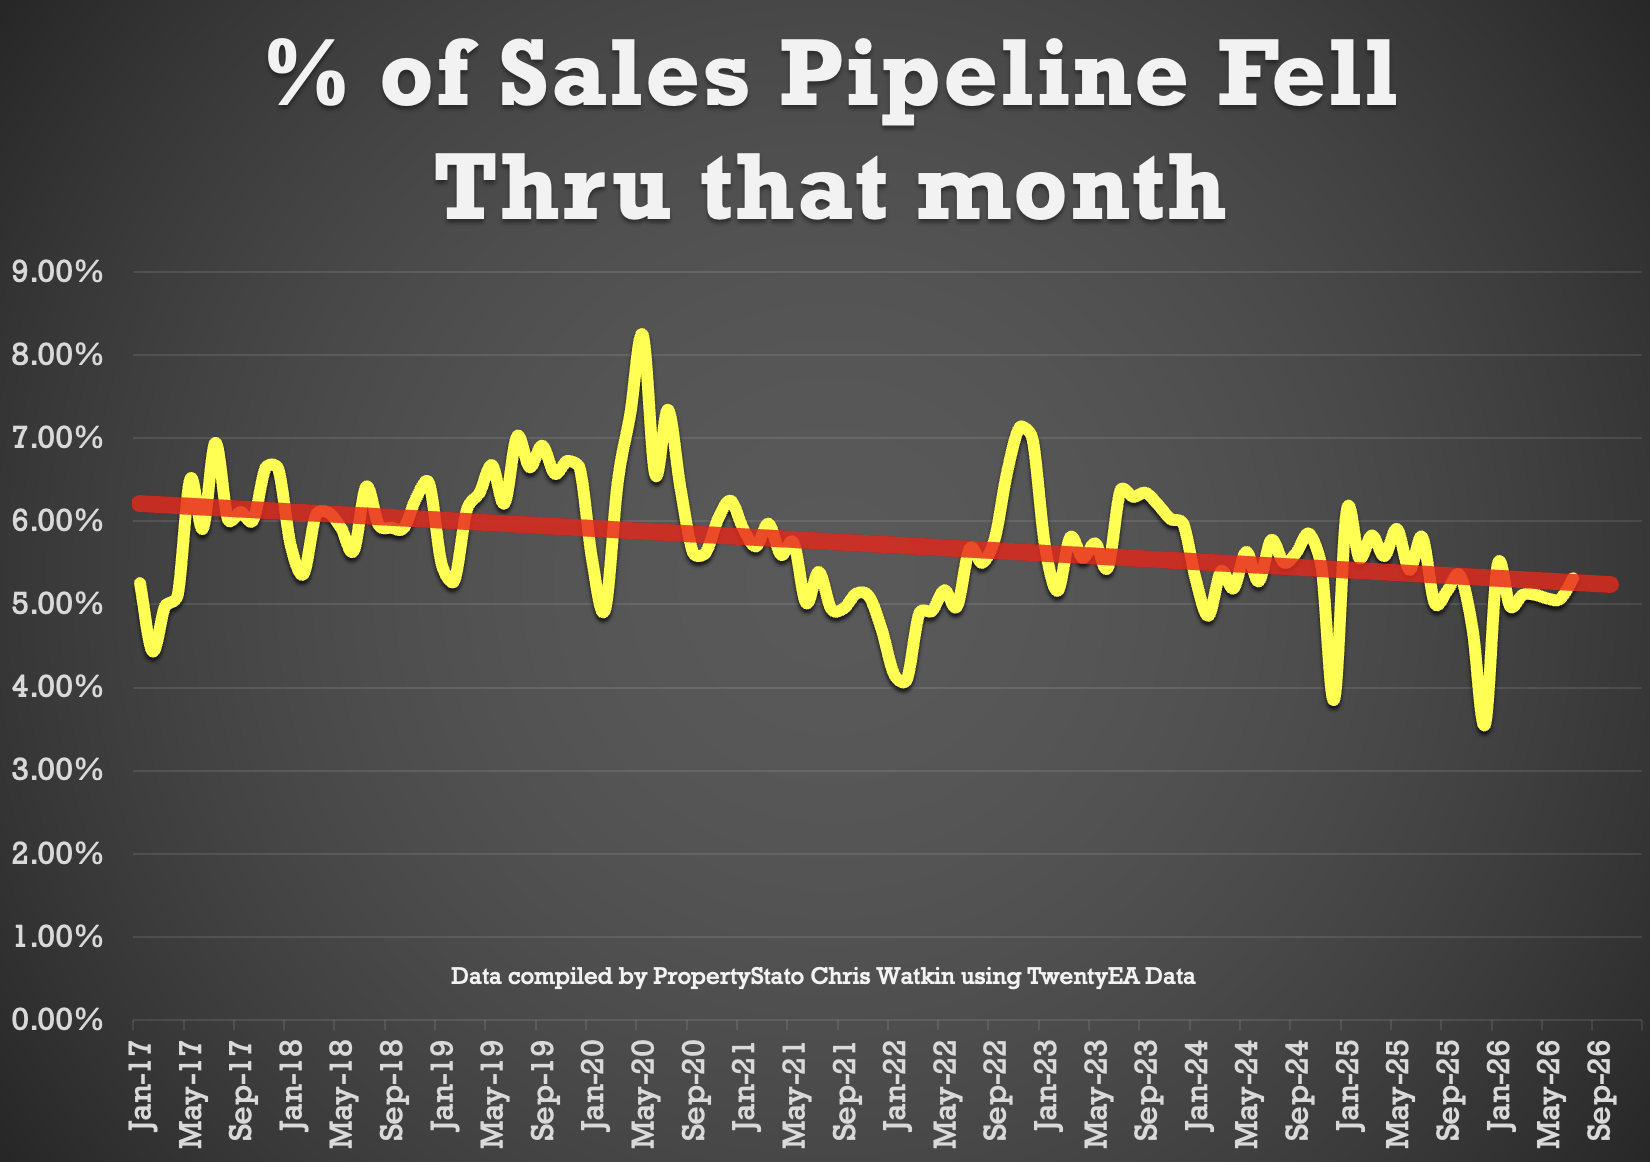
- 5.07% of homes sold STC fell through in June 2026, below both the 2025 average of 5.3% and the ten-year average of 5.8%
Stock levels
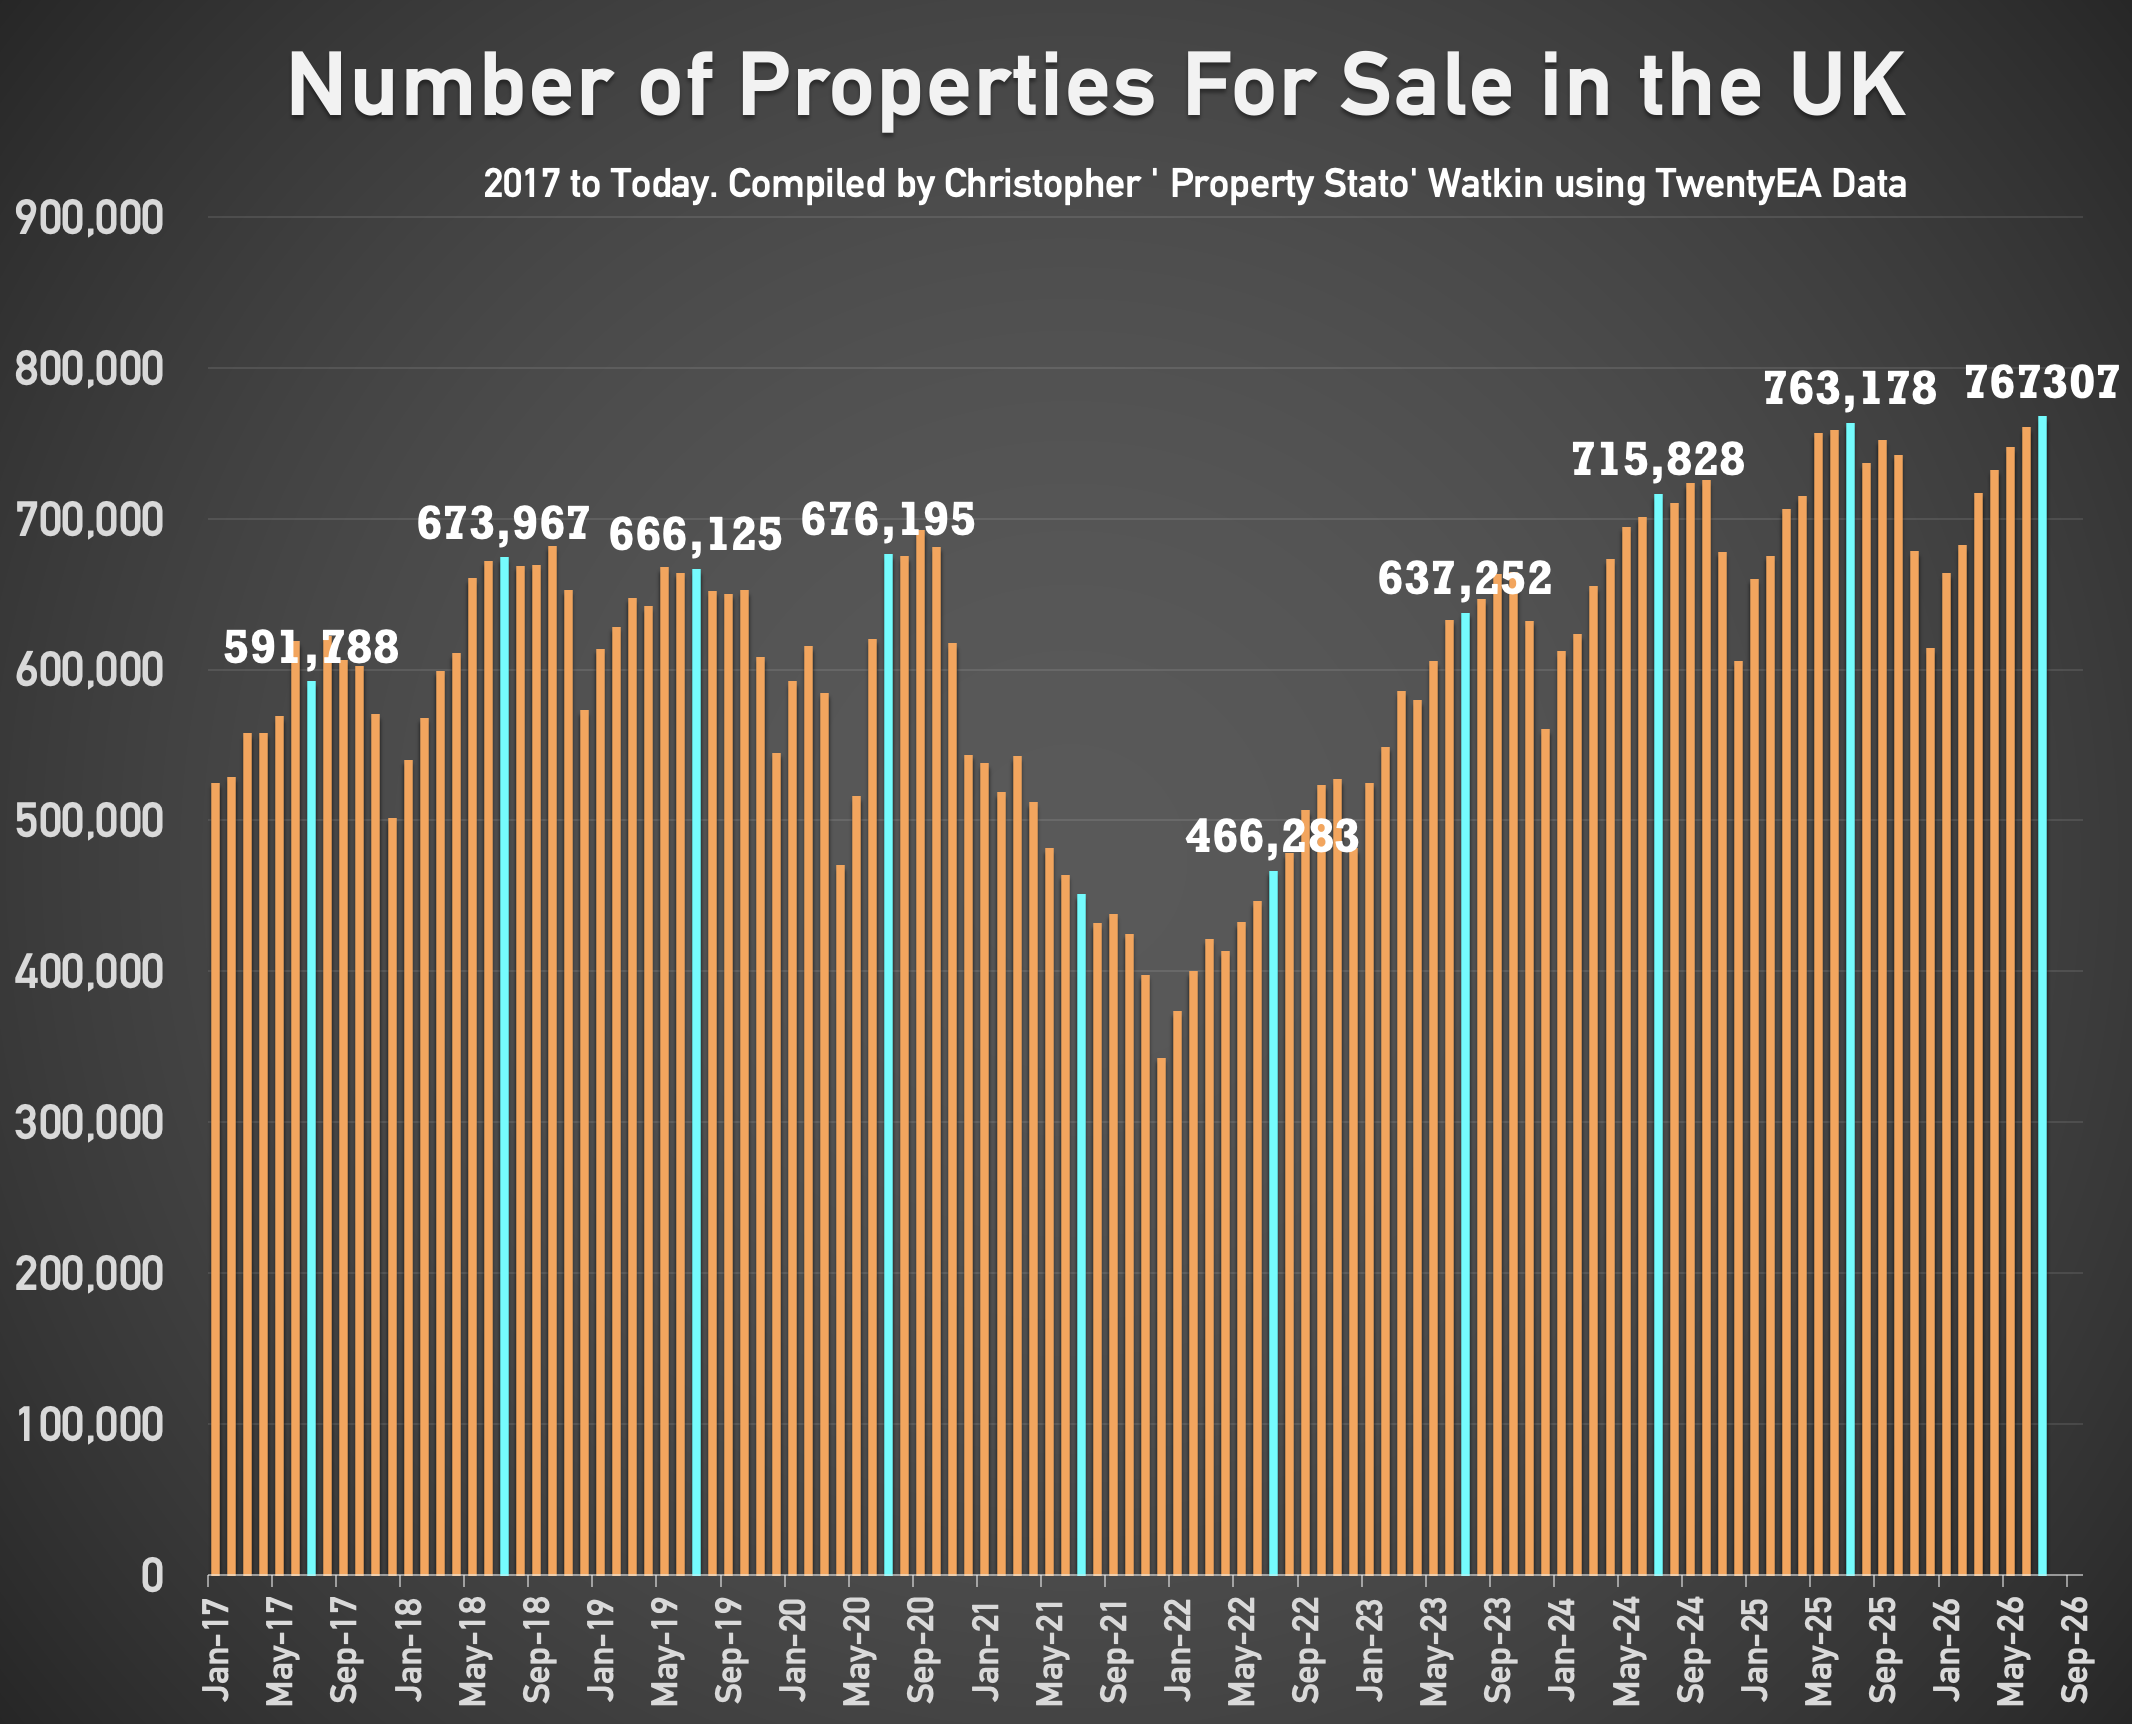
- 767k homes on the market on the 1st August 2026 (760k the month before and 763k 12 months ago)
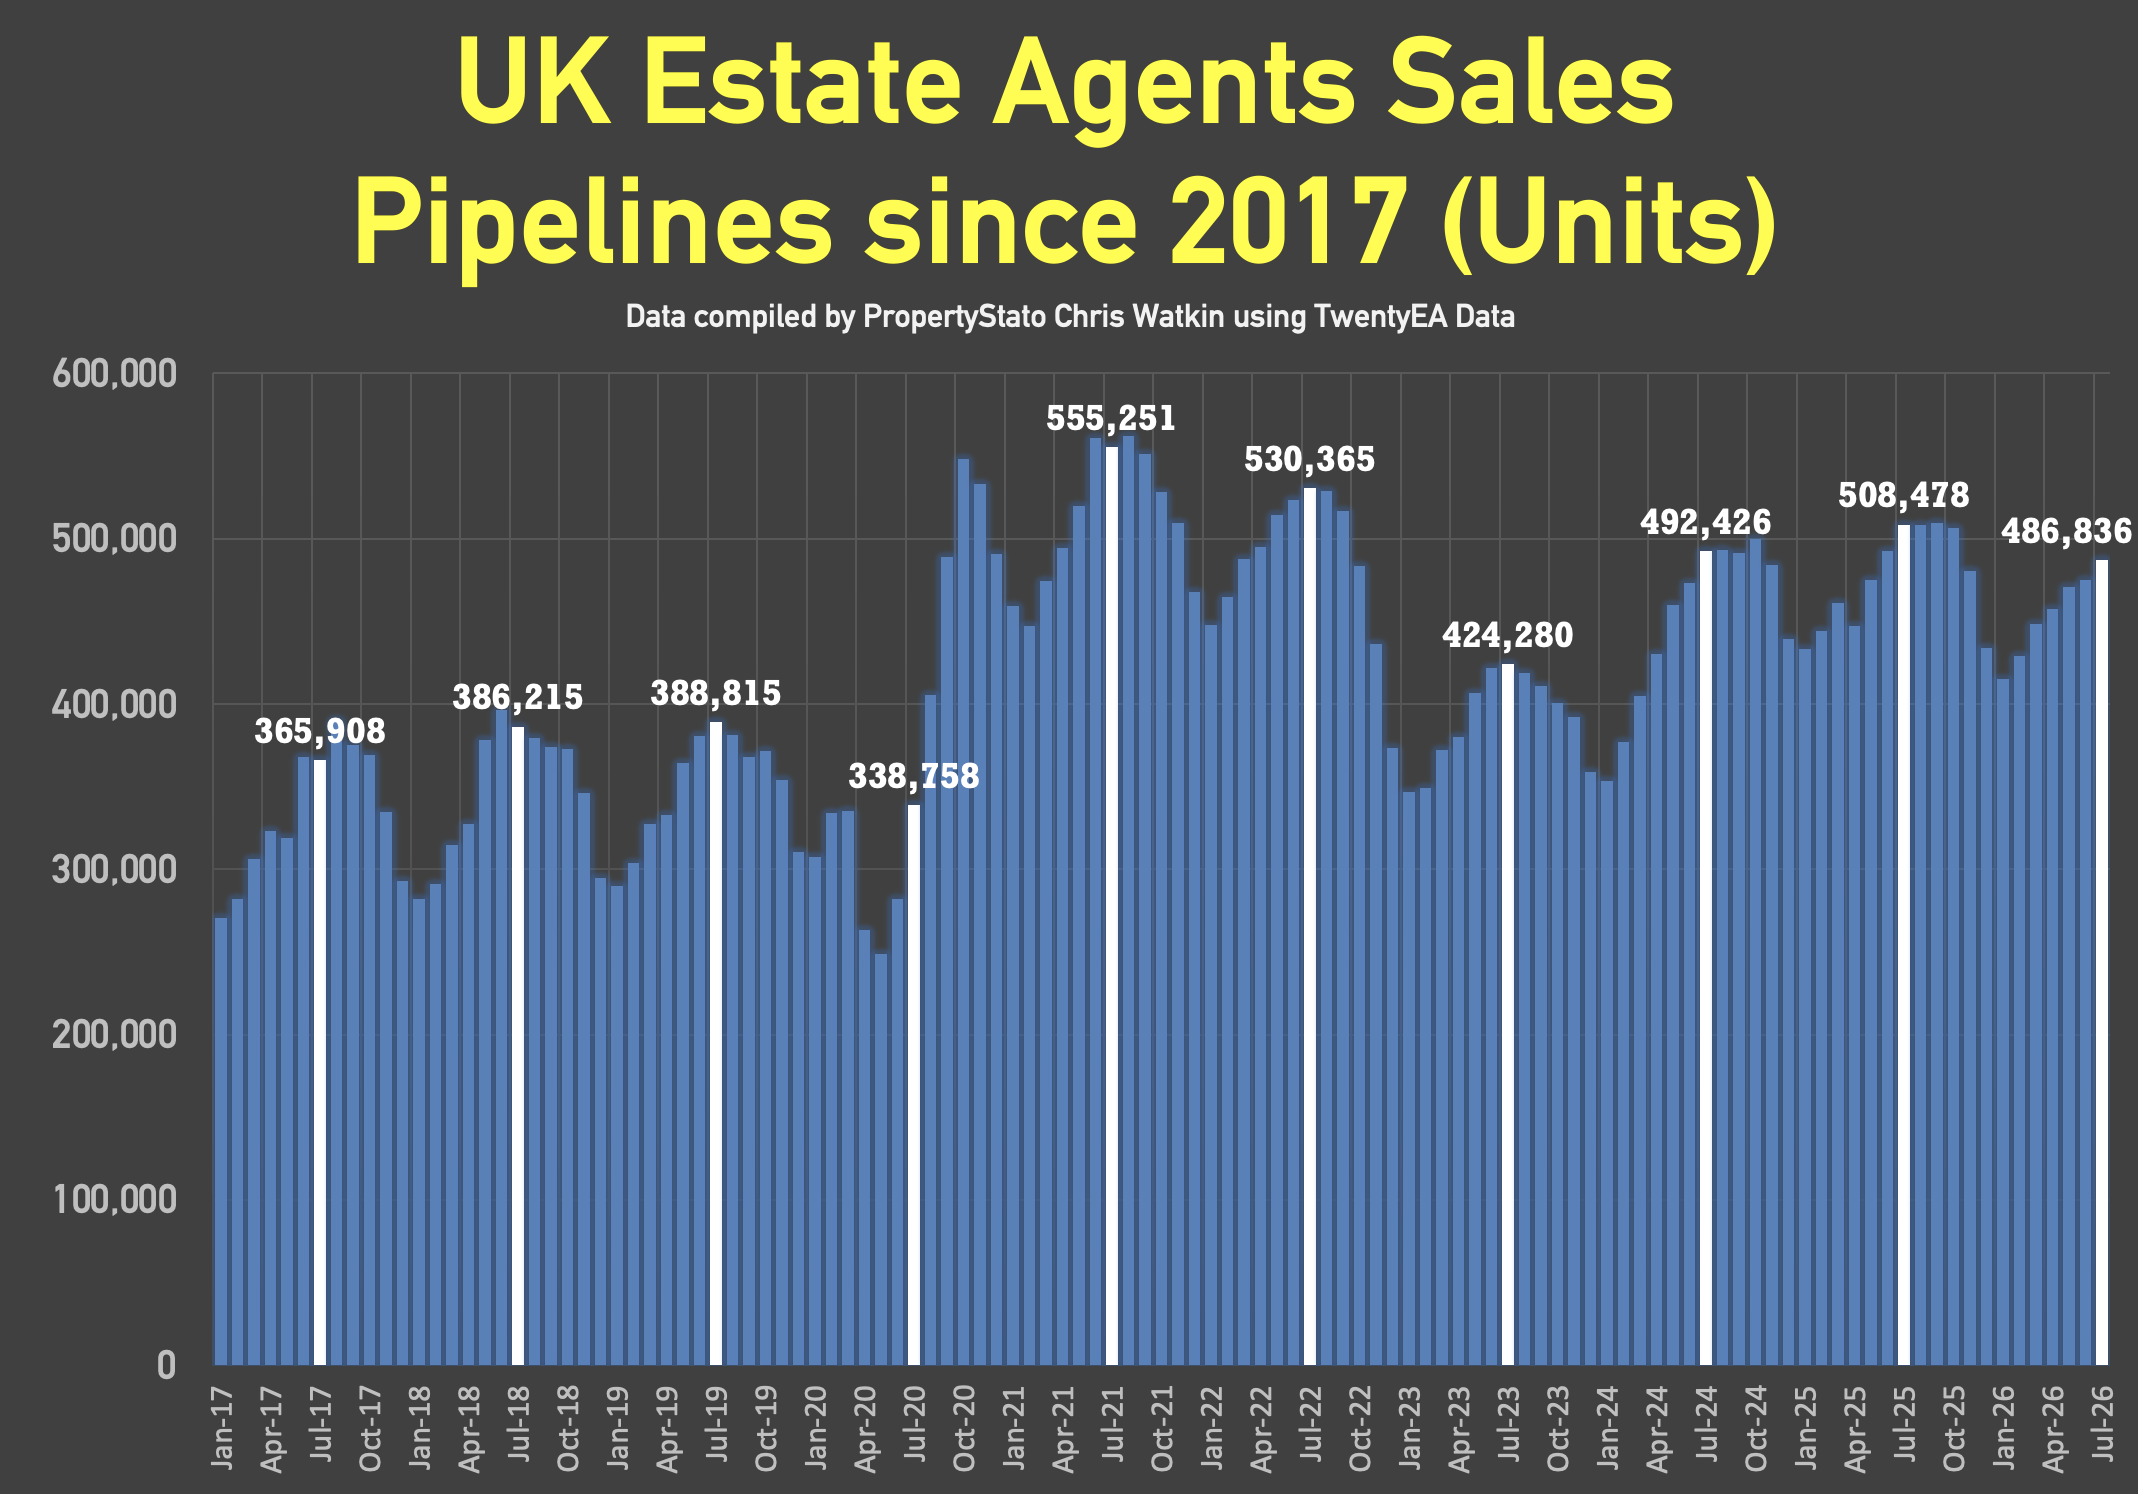
- 487k homes in agent’s sales pipeline on the 1st August 2026, lower than 12 months ago on 1st August 2025 (508k).
House prices (£/sq.ft)
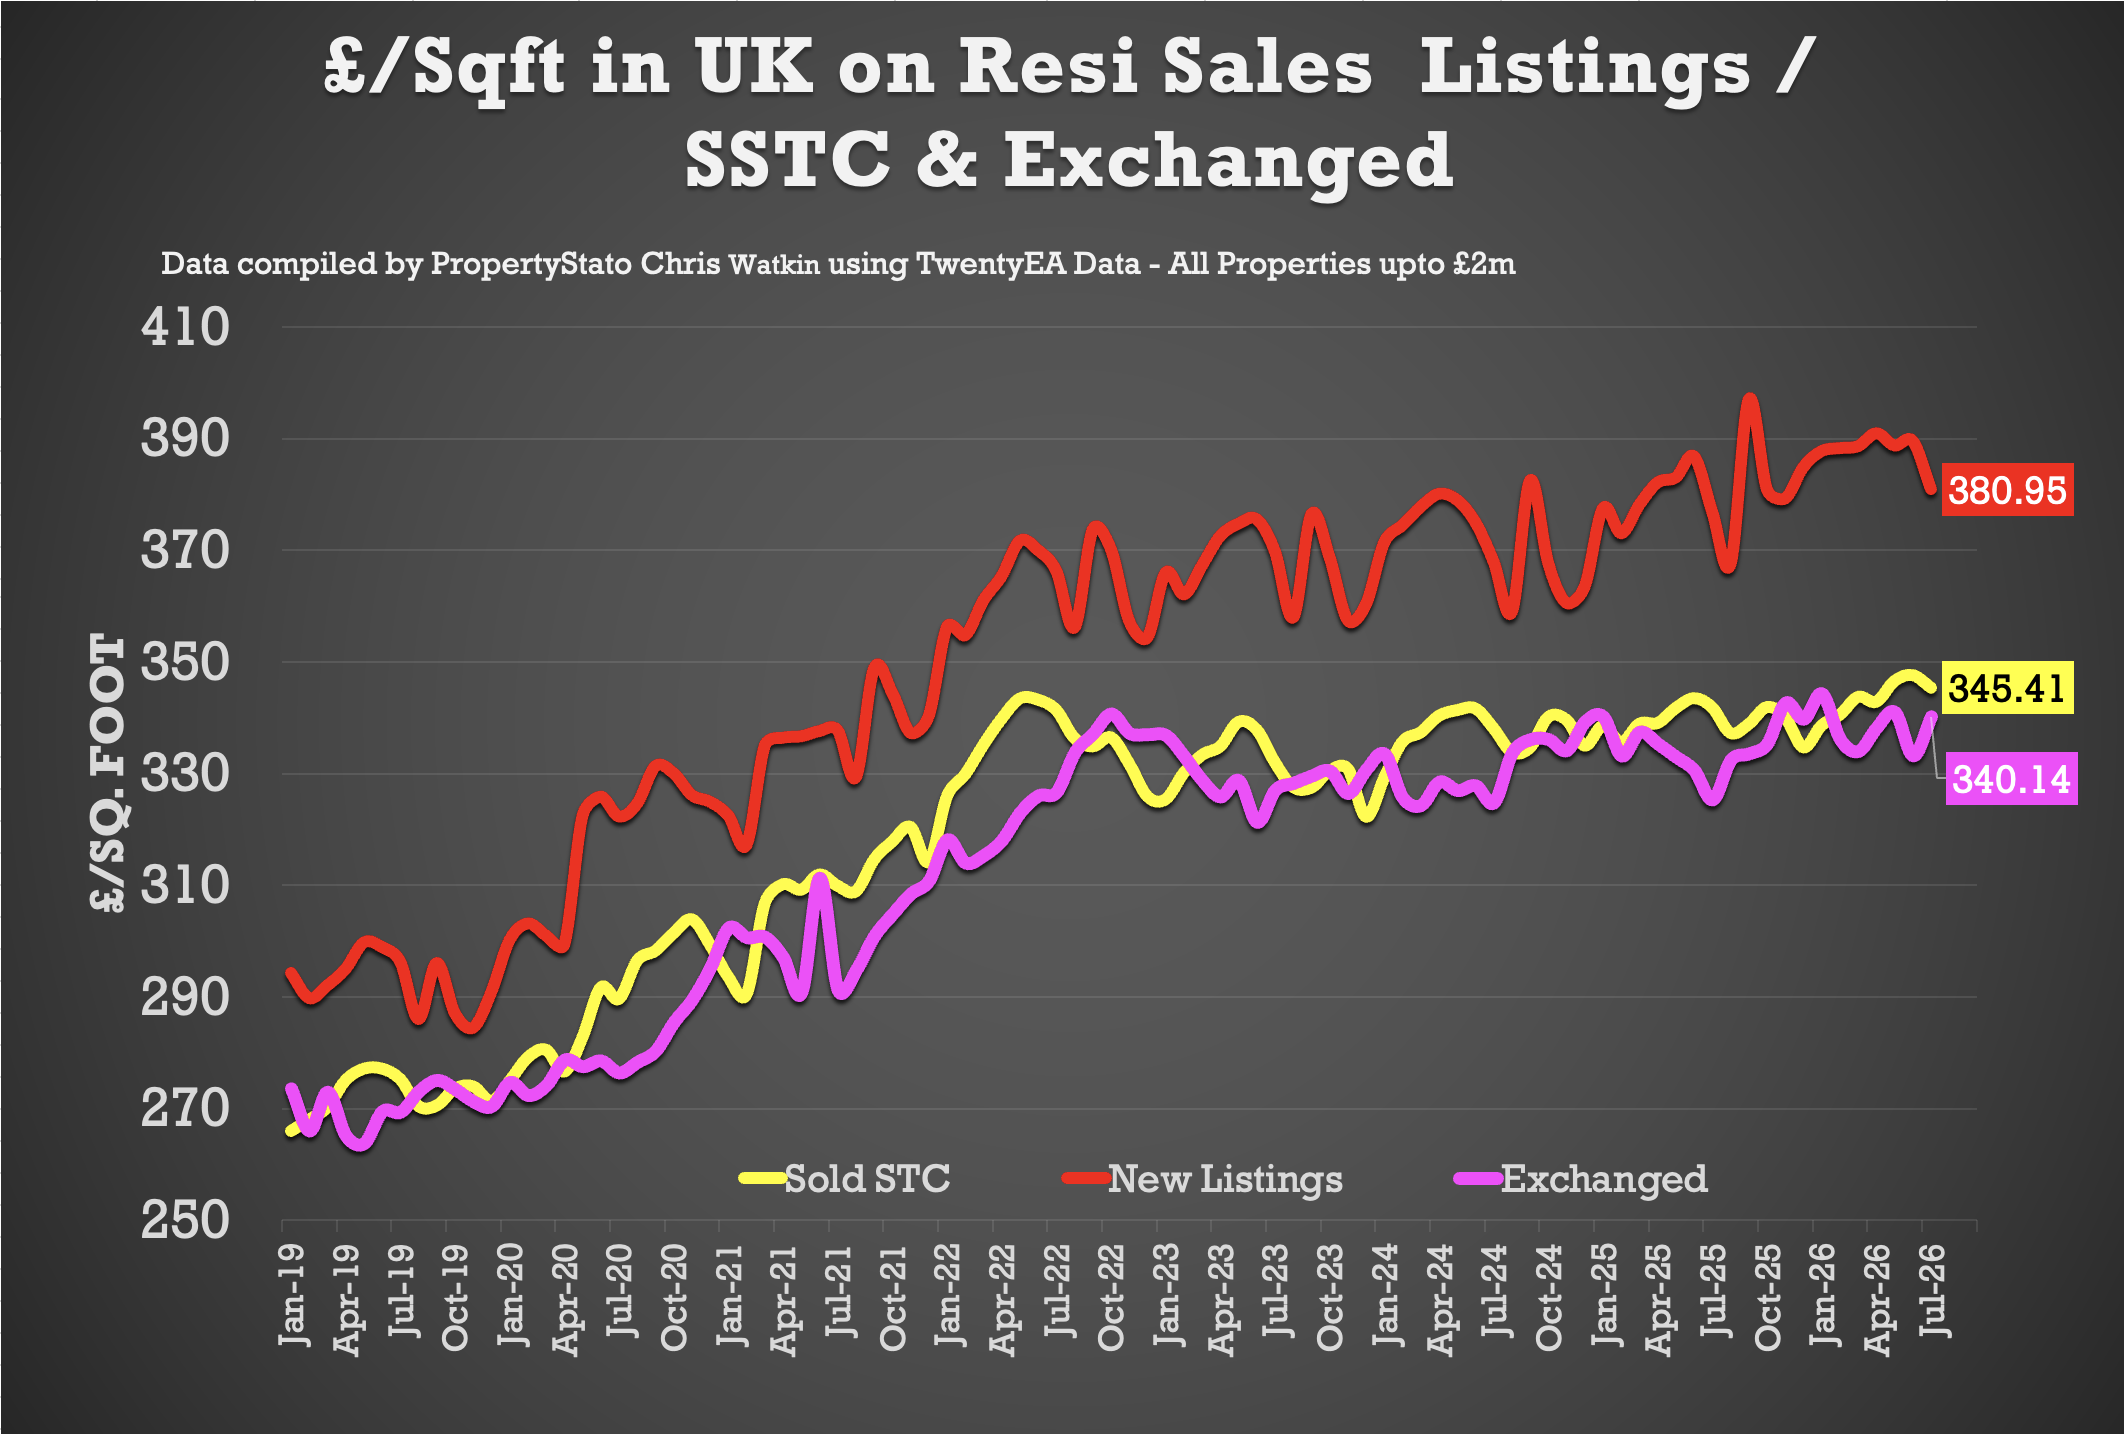
- July 2026 agreed sales averaged £345.41 per sq.ft. 1.2% higher than 12 months ago (£341.43) and 11.9% than 5 years ago (£308.60). The £/sqft at sale agreed matches the HM Land Registry Index with a 98% accuracy, five months in advance. That is why it is so important
UK rental data
- Average rent in week 32 – £1,780 pcm
- Average rent in August 2026 – £1,805 pcm
- Average rent in August 2025 – £1,800 pcm
- Average rent in August 2021 – £1,394 pcm
- Average rent in YTD 2026 – £1,765 pcm
- 323k UK rental stock available to rent in July 2026 (319k in July 2025)
- New rental properties coming onto the market in July 2026 – 135,928. (128,821 in July 2025 and 111,080 in July 2022)
Local Focus this week in the show
Oxford