


The UK property market report for the week ending Sunday, 10th December 2023, paints a robust picture of the UK housing market.
In a notable development, the sales agreed price per square foot (sqft) in November 2023 has witnessed an increase to £331.19, marking a slight rise from October’s £329.63 sqft. This uptick is a positive indicator of market resilience and buyer confidence. It also has a strong coloration to what will happen to the Land Registry stats in the Spring of 2024.
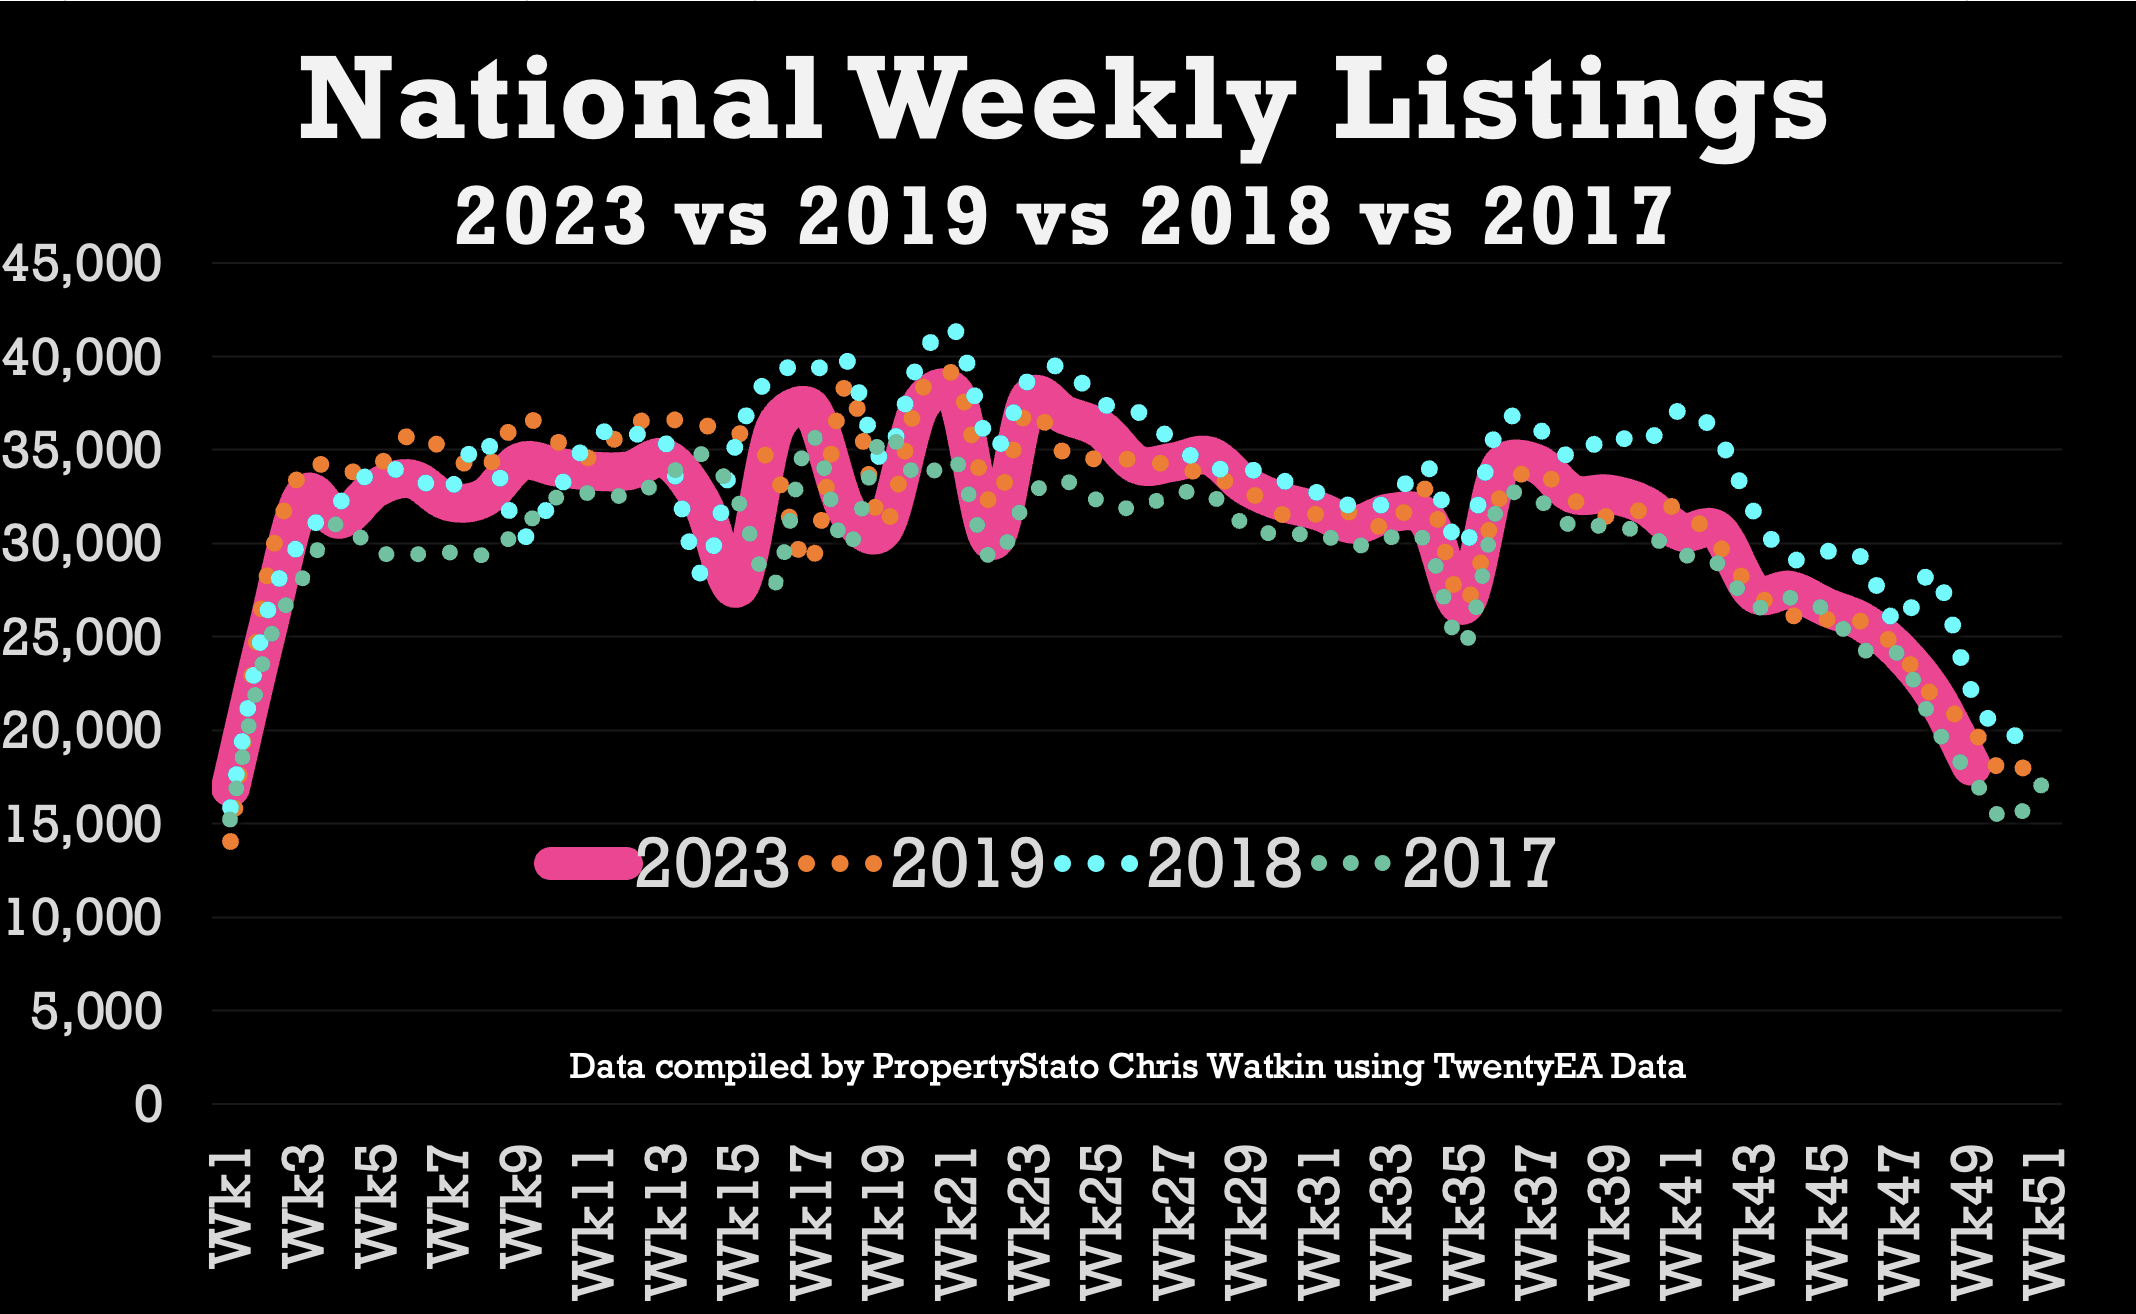
Additionally, the year-to-date (YTD) listings for 2023 are holding steady at 99.2% of the average seen in the years 2017, 2018, and 2019. This consistency underscores a stable market supply, maintaining near-average levels despite varying economic conditions. The level of listings is really important, because if they’re too high that will drag prices down and if they’re too low that will push prices up. What we almost have is a Goldilocks level of listings.
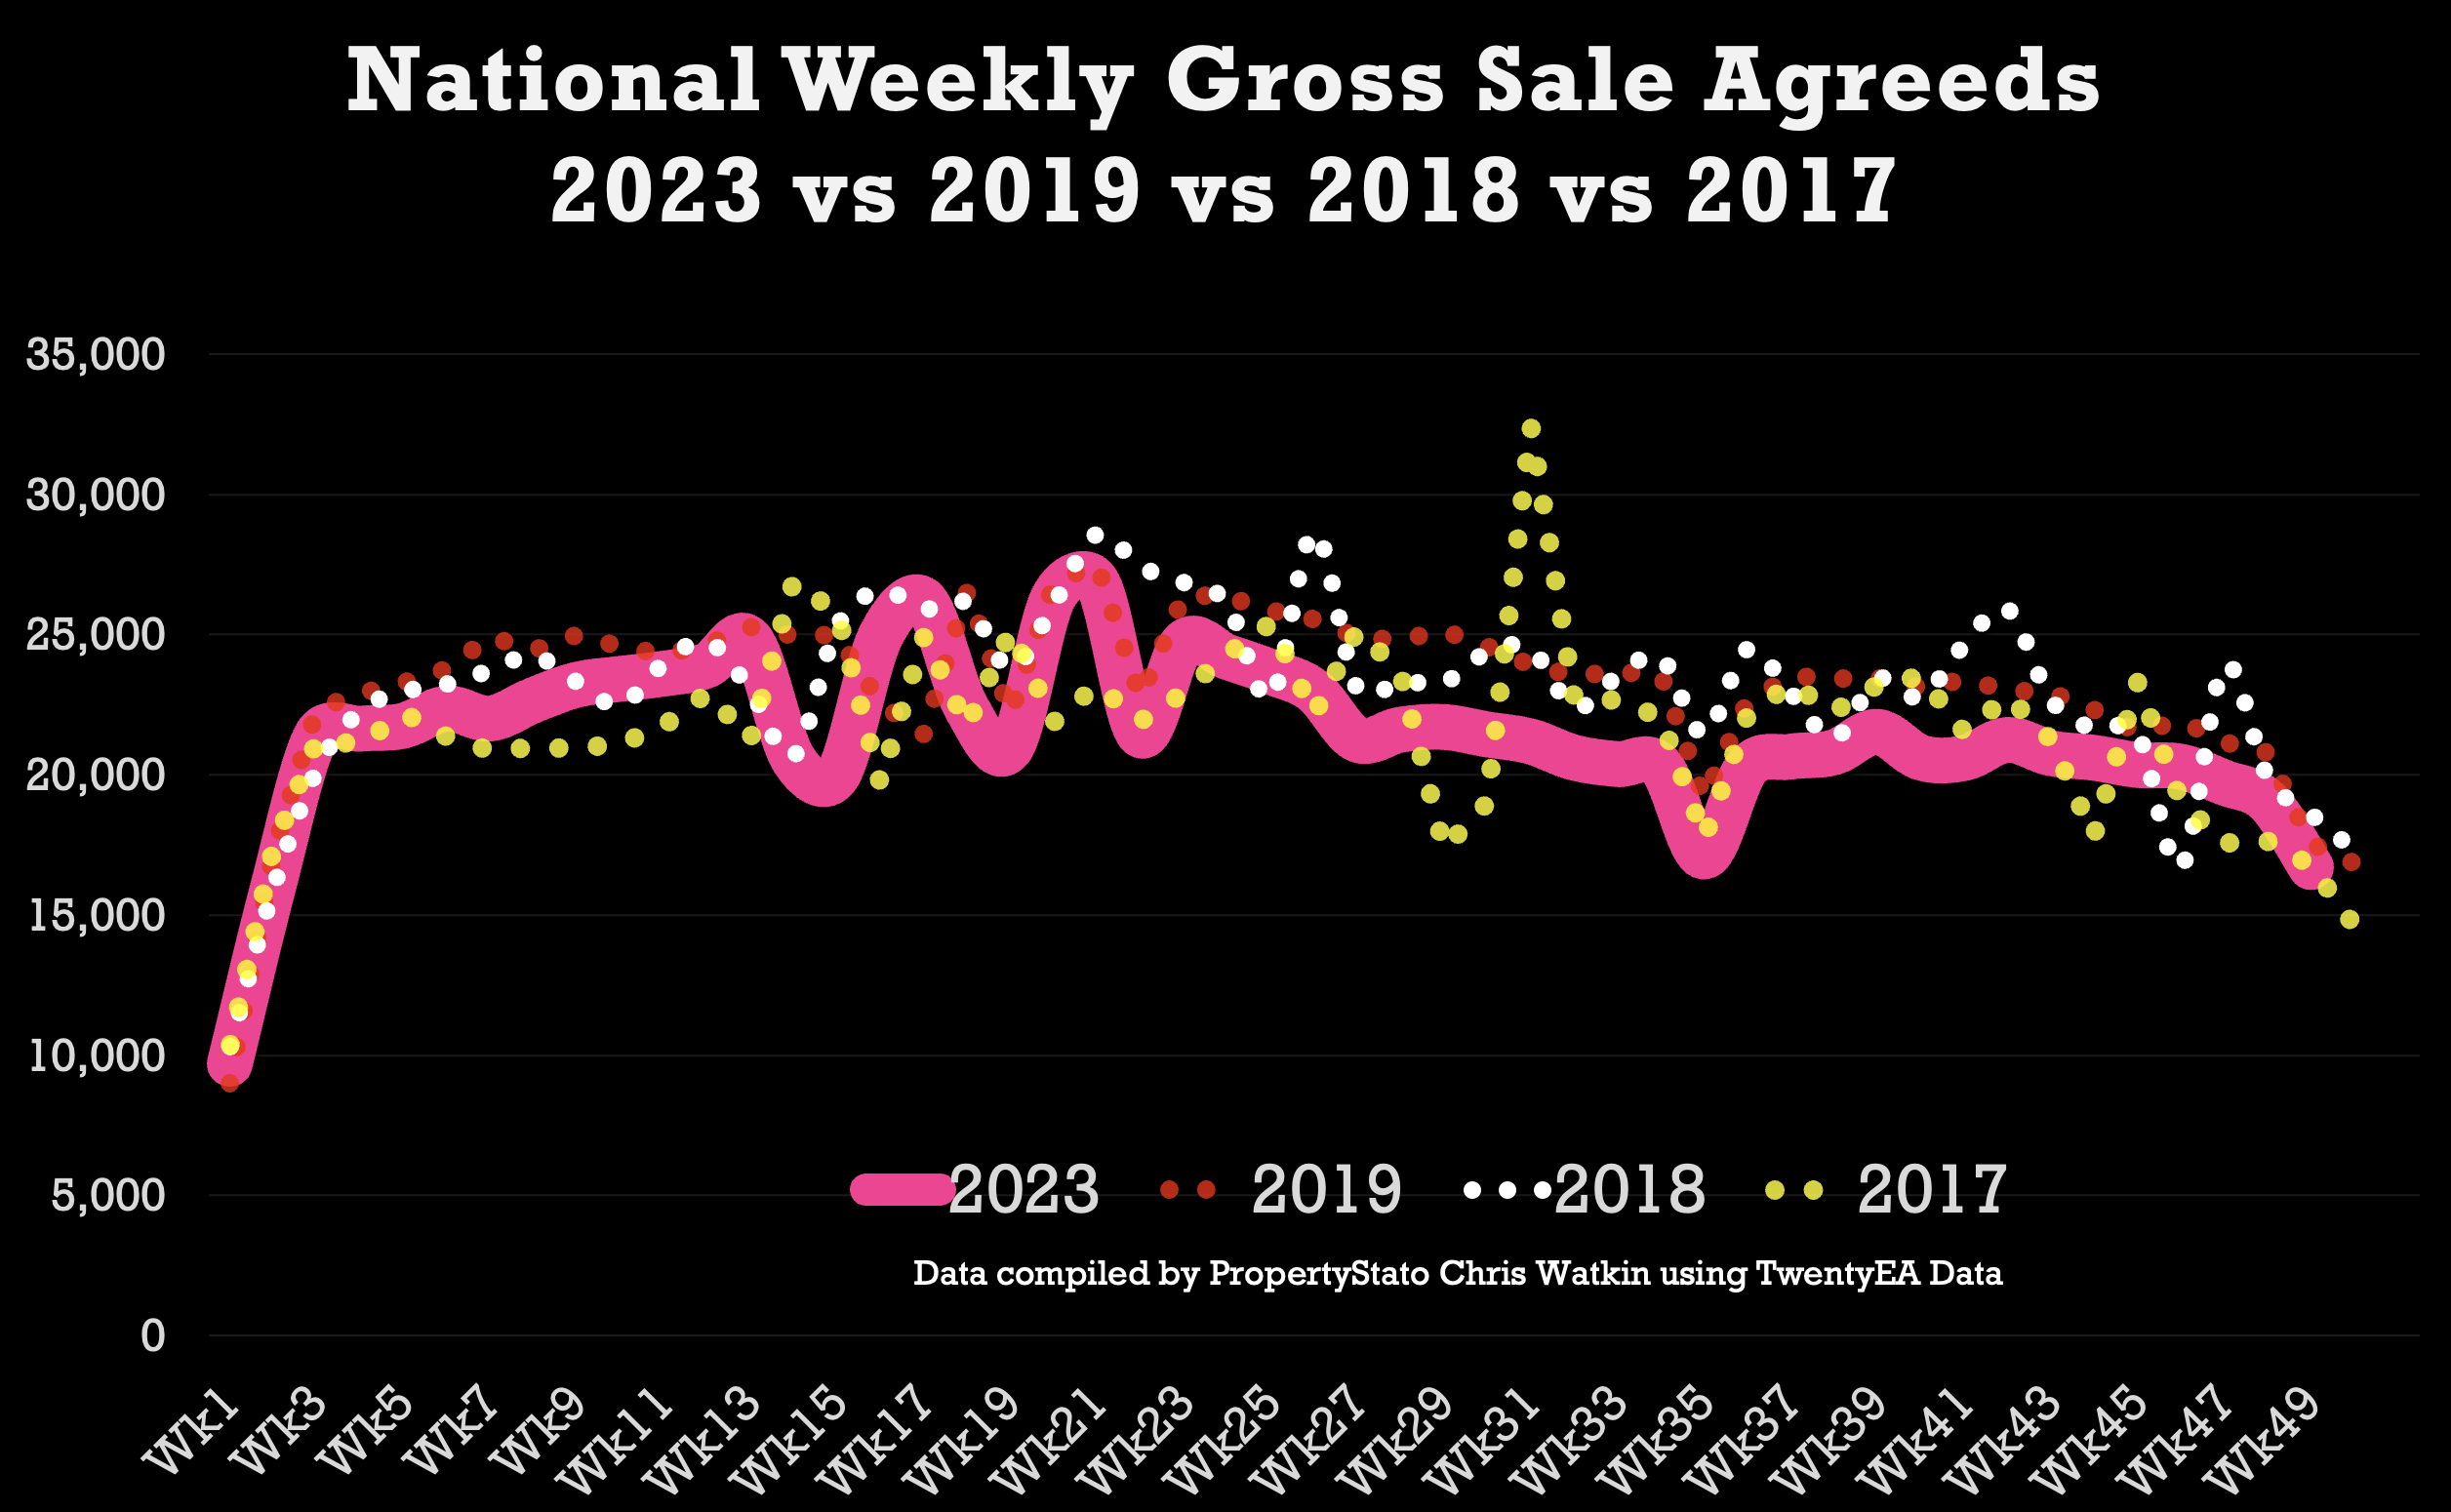
Gross house sales for YTD 2023 are at 94.4% of the average of the 2017,2018 and 2019 levels, which indicates healthy transaction volumes.
More importantly, Net sales (Gross sales less sale fall throughs), which will eventually represent actual exchanged transactions, stand at 90.4% of the YTD average of 2017, 2018, and 2019. While slightly lower, this figure still represents a decent market performance considering all the bad news and doom monger in the press.
There are two flies in the ointment.
The first fly is the number of properties for sale. UK properties for sale on the 1st of December 2023 stood at 634,000 compared to 524,000 on the 1st December 2022, and 397,000 on the 1st of December 2021.
This near doubling of the properties on the market in two years should be a reminder to all British homeowners (and estate agents who overvalue) that they have a lot more competition and therefore realistic pricing is vital if they wish to sell their property in 2024. (The average number properties for sale on the 1st of December of 2017/18/19 was 613k and 1.36 million in 2008 (the year of the property crash when we had an massive excess of supply of properties for sale)).
The second fly is the drop in saleability. In 2022, estate agents were paid 65.53% of properties they listed (i.e. they exchanged and completed). However, in 2023, estate agents have only been paid on 52.39% of properties they listed. This proportional drop of 20.1% means estate agents have to work a lot harder to get paid on the same they did last year.
Interestingly, there are some big regional differences with largest drop being seen in East Anglia, dropping 26.1% with Northern Ireland at the other end of the scale at 5.7%. The average drop in Inner London is 17%, yet in Outer London 23.6%.
Overall, the data suggests that even as we enter the third week of December, the UK property market is faring quite well, especially when compared to the same period in 2022. The market is only marginally trailing behind the averages of the years 2017, 2018, and 2019, indicating a resilient and thriving property environment. This resilience is a promising sign for investors and homeowners alike, signalling continued stability and potential growth in the UK property
market.
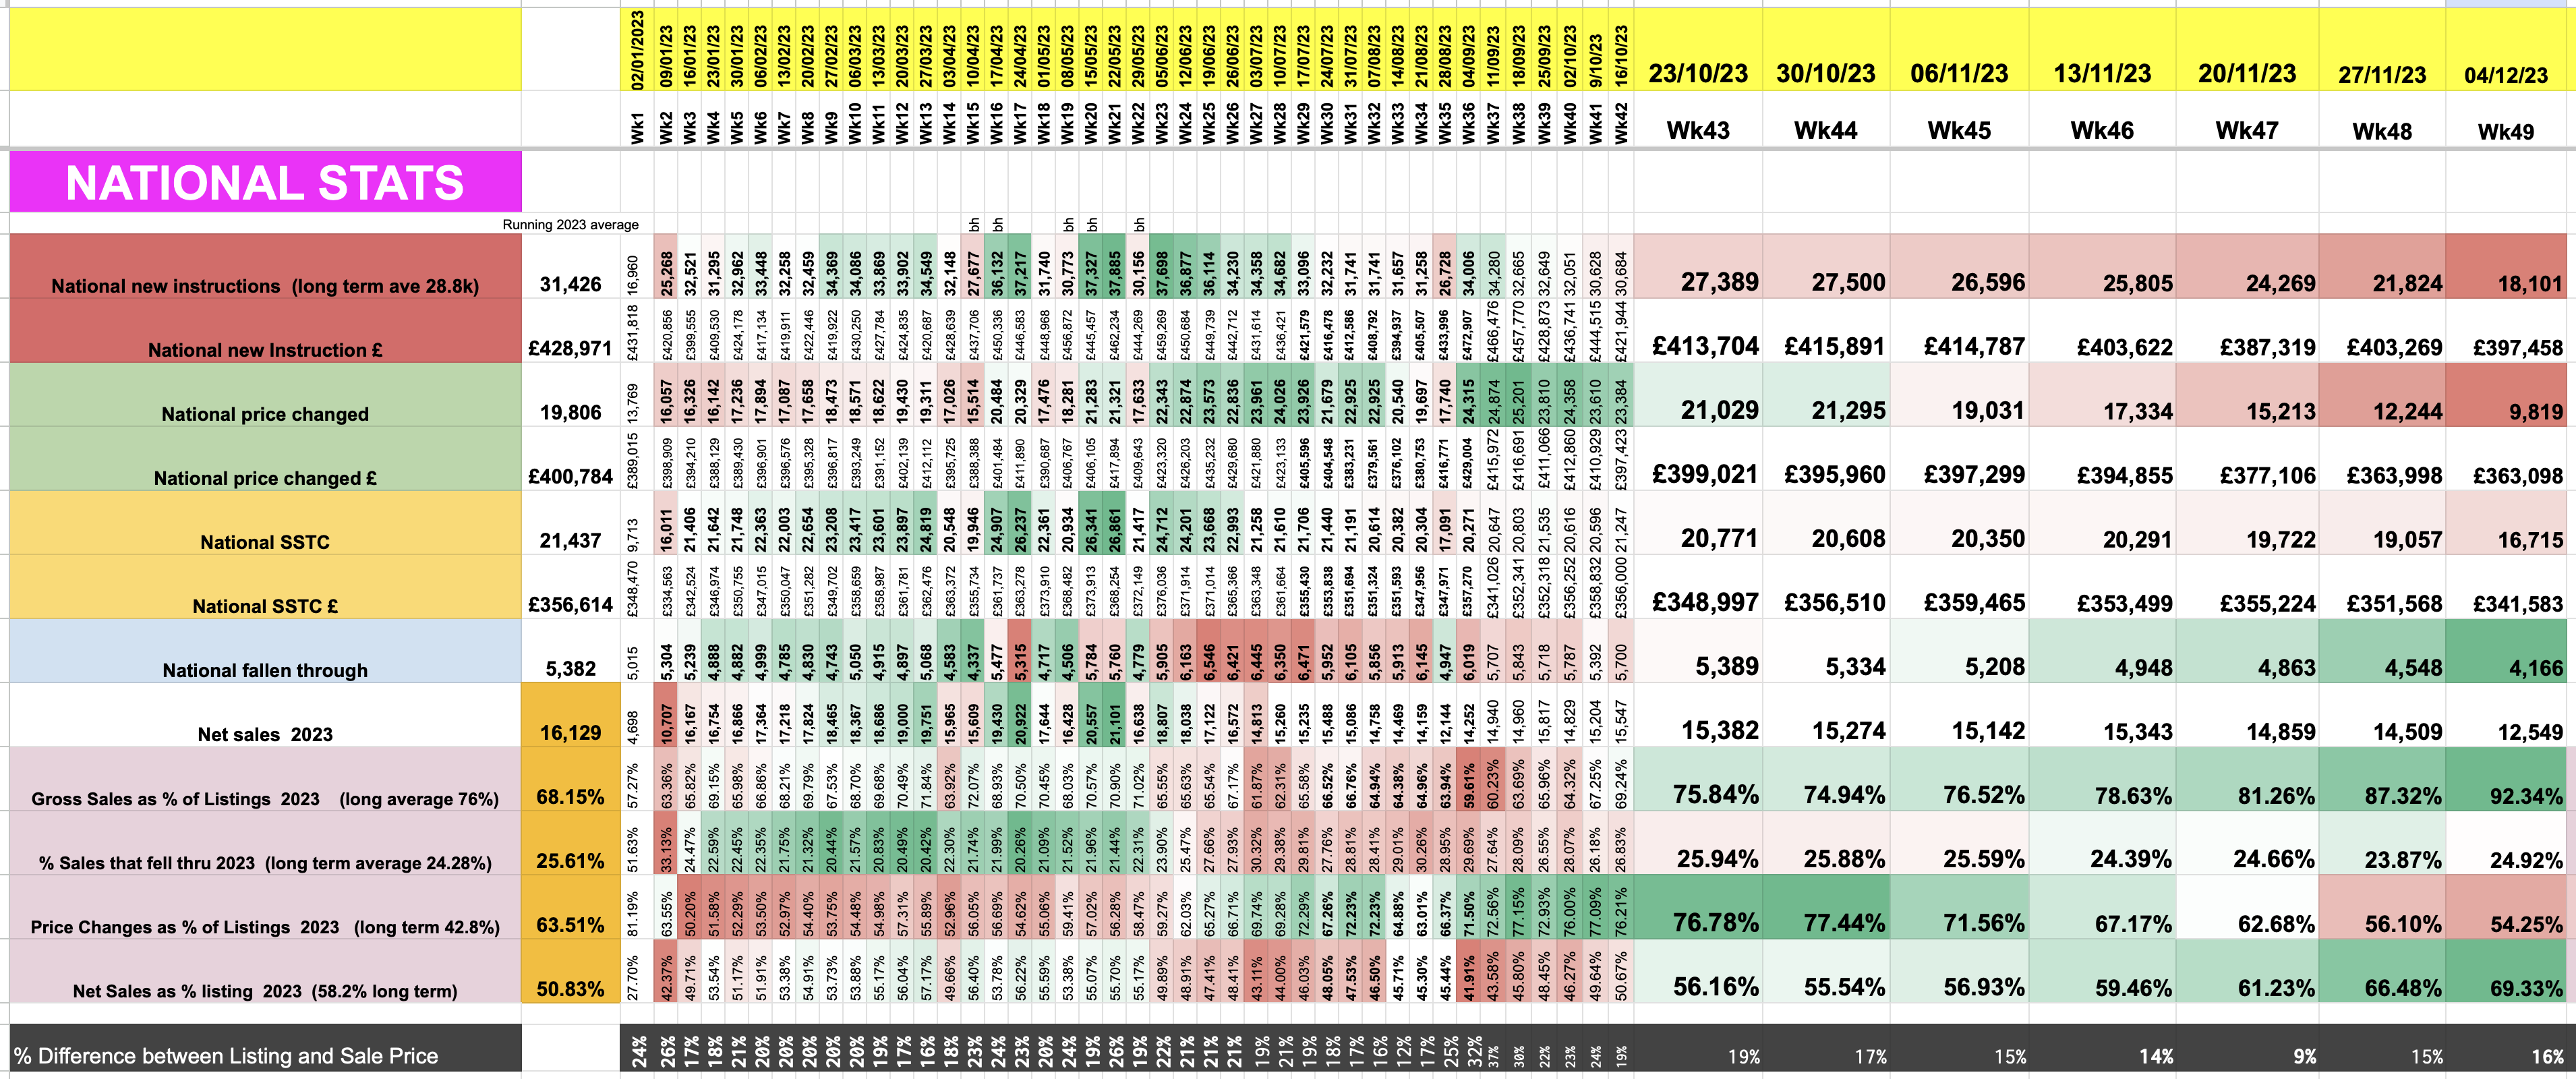
Key statistics in more detail.
+ New Properties to the Market (Listings): New listings last week was 18,101 (Average for the last 4 weeks 22,500). The 2023 YTD running weekly average stands at 31,246.
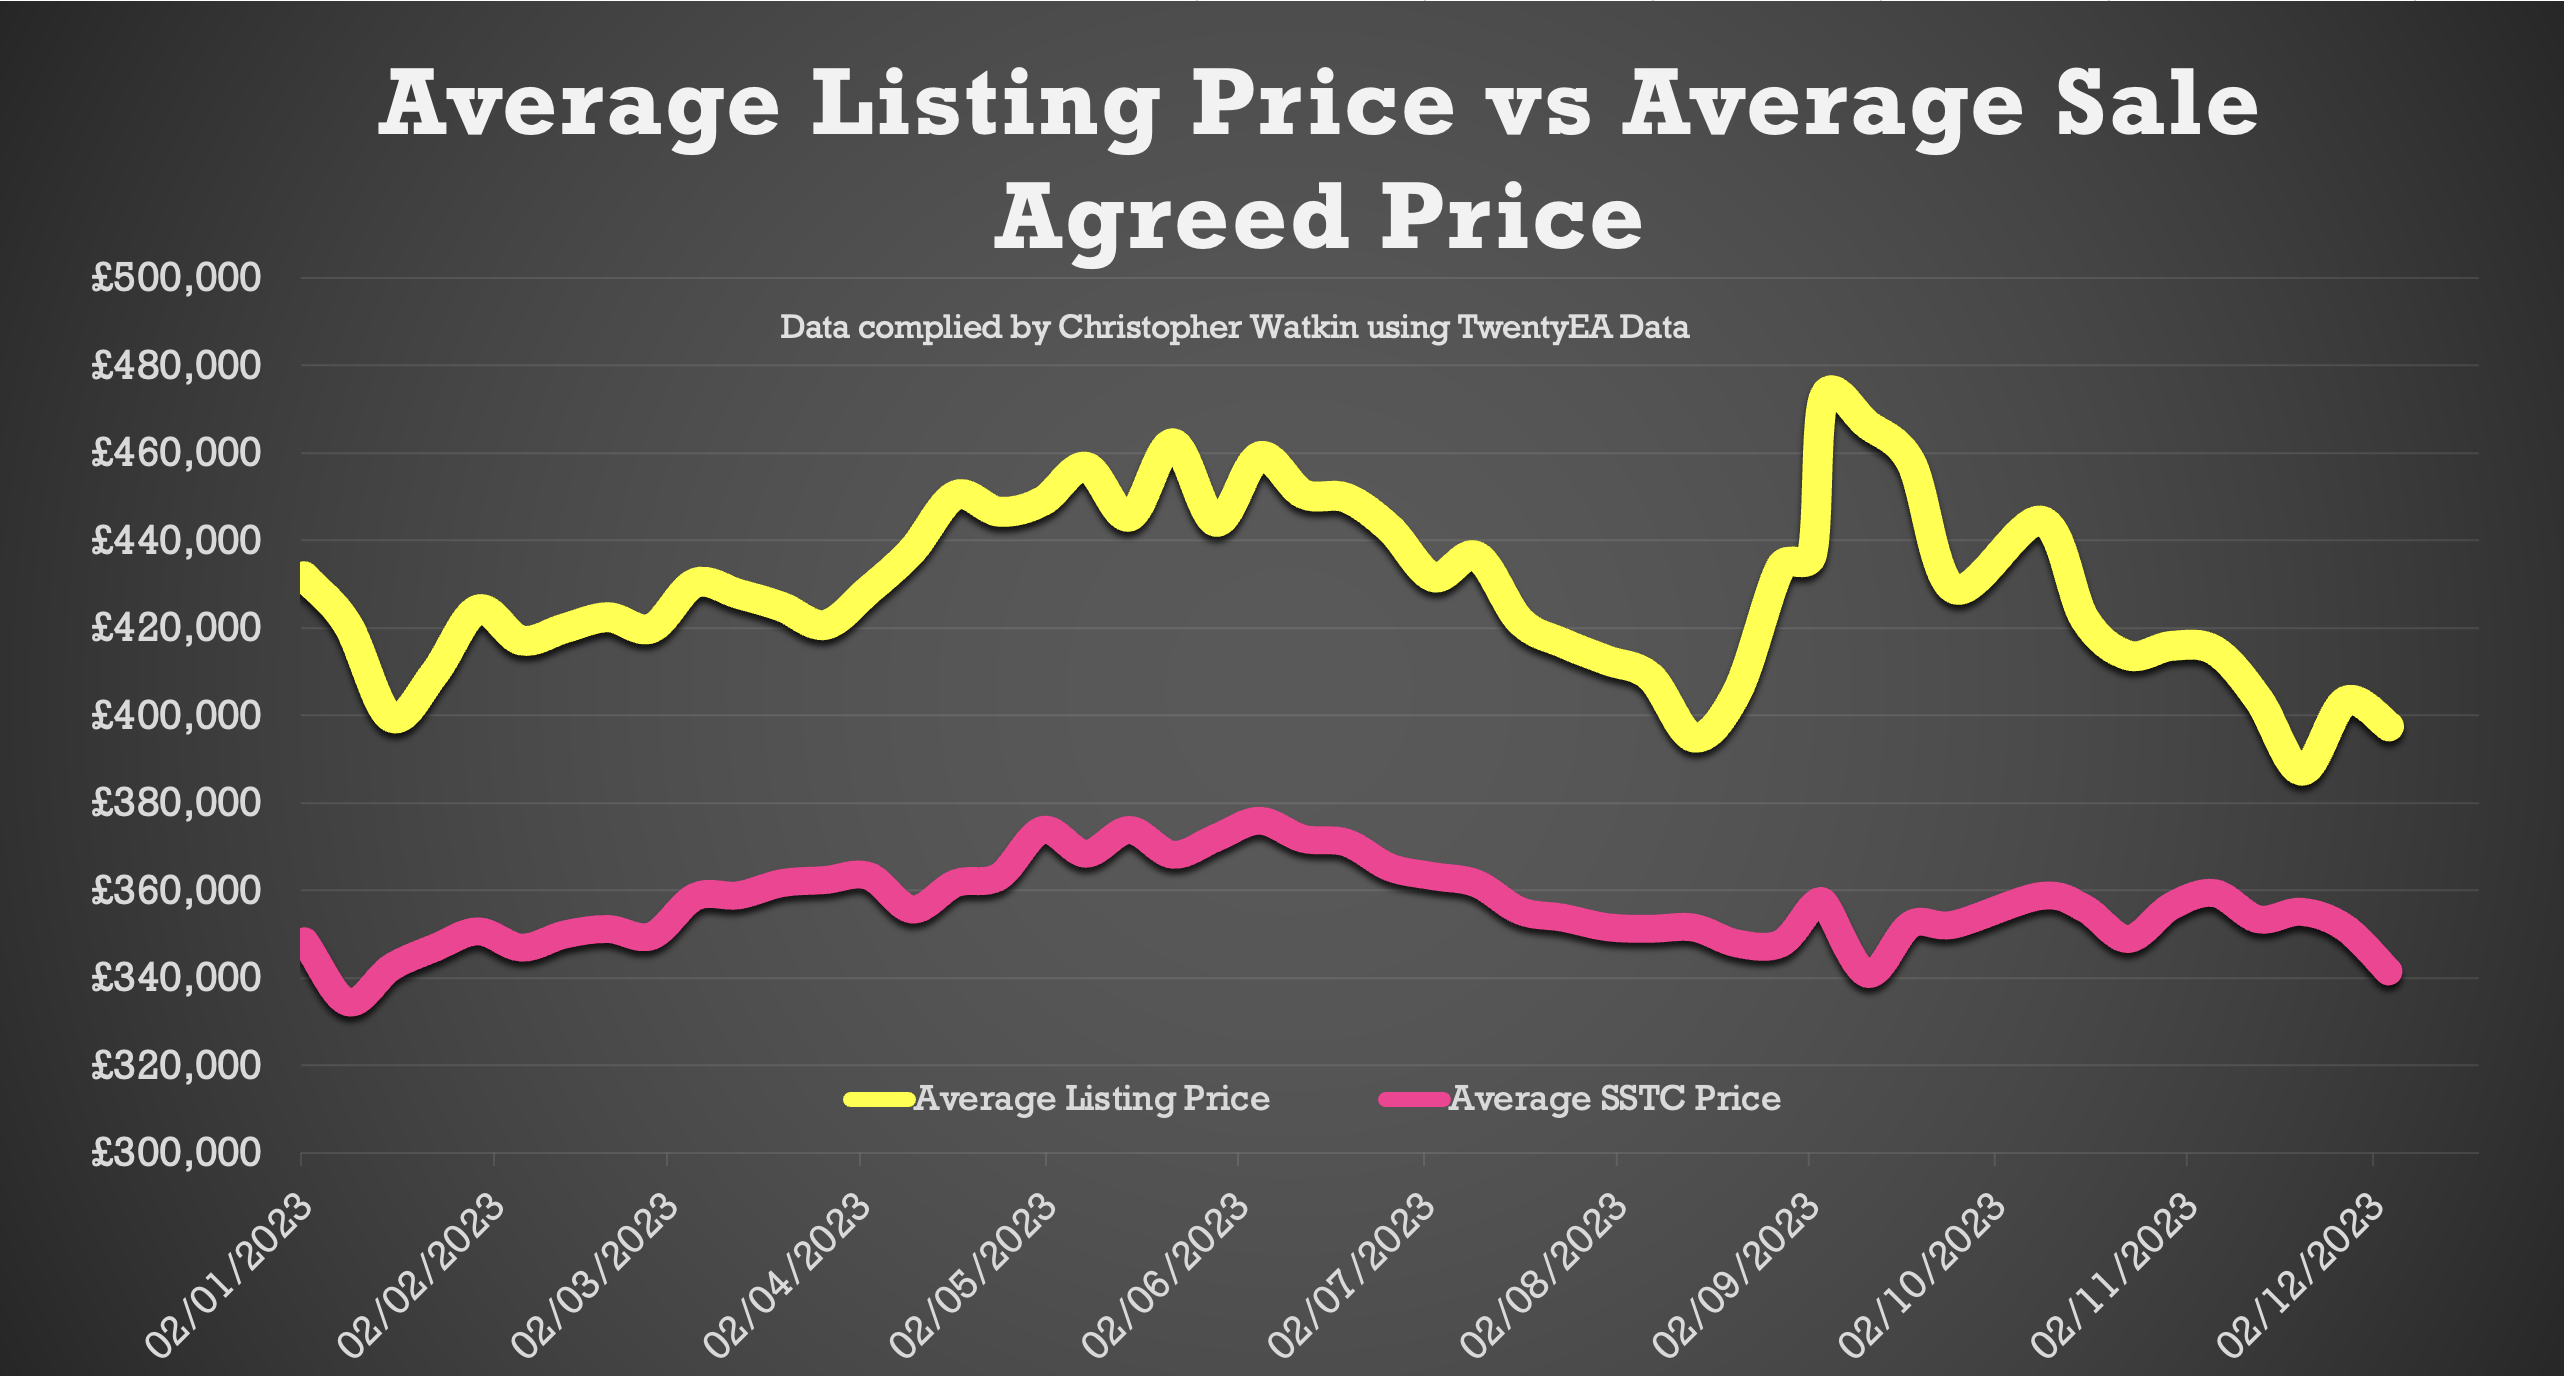
+ Average Listing Price: The average listing price has remained stable in the last few weeks. Average Listing price this week £397,948. The 2023 running weekly average of £428,971.
+ Percentage difference between Listing and Sale Agreed Prices: This week has increased again slightly to 16%. Yet, nothing to worry about as it’s still below the long term 7 year average 17%. 2023 YTD average 20.3%
+ Price reductions: 9,819 price reductions were seen last week which continues the significant drop over the last few weeks. All expected as vendors wait until the New Year to reduce their asking prices. The 2023 running weekly average is 19,806 per week
+ Average asking price of properties being reduced: This week’s average asking price of reduced properties £363,098. The 2023 running weekly average of £401,784.
+ Number of properties sold (gross sales): Gross sales are holding up well. Total number of gross sales in the UK last week was 16,715 (not bad for the first week in Dec). For comparison, Week 49 in 2022 and 14,895 properties sold stc. The 2023 running weekly average is 21,437 weekly sales (stc)
+ Average Asking Price of Properties Sold STC this week: The average asking price of the properties selling last week was £341,583 (a drop of £10k from last week).
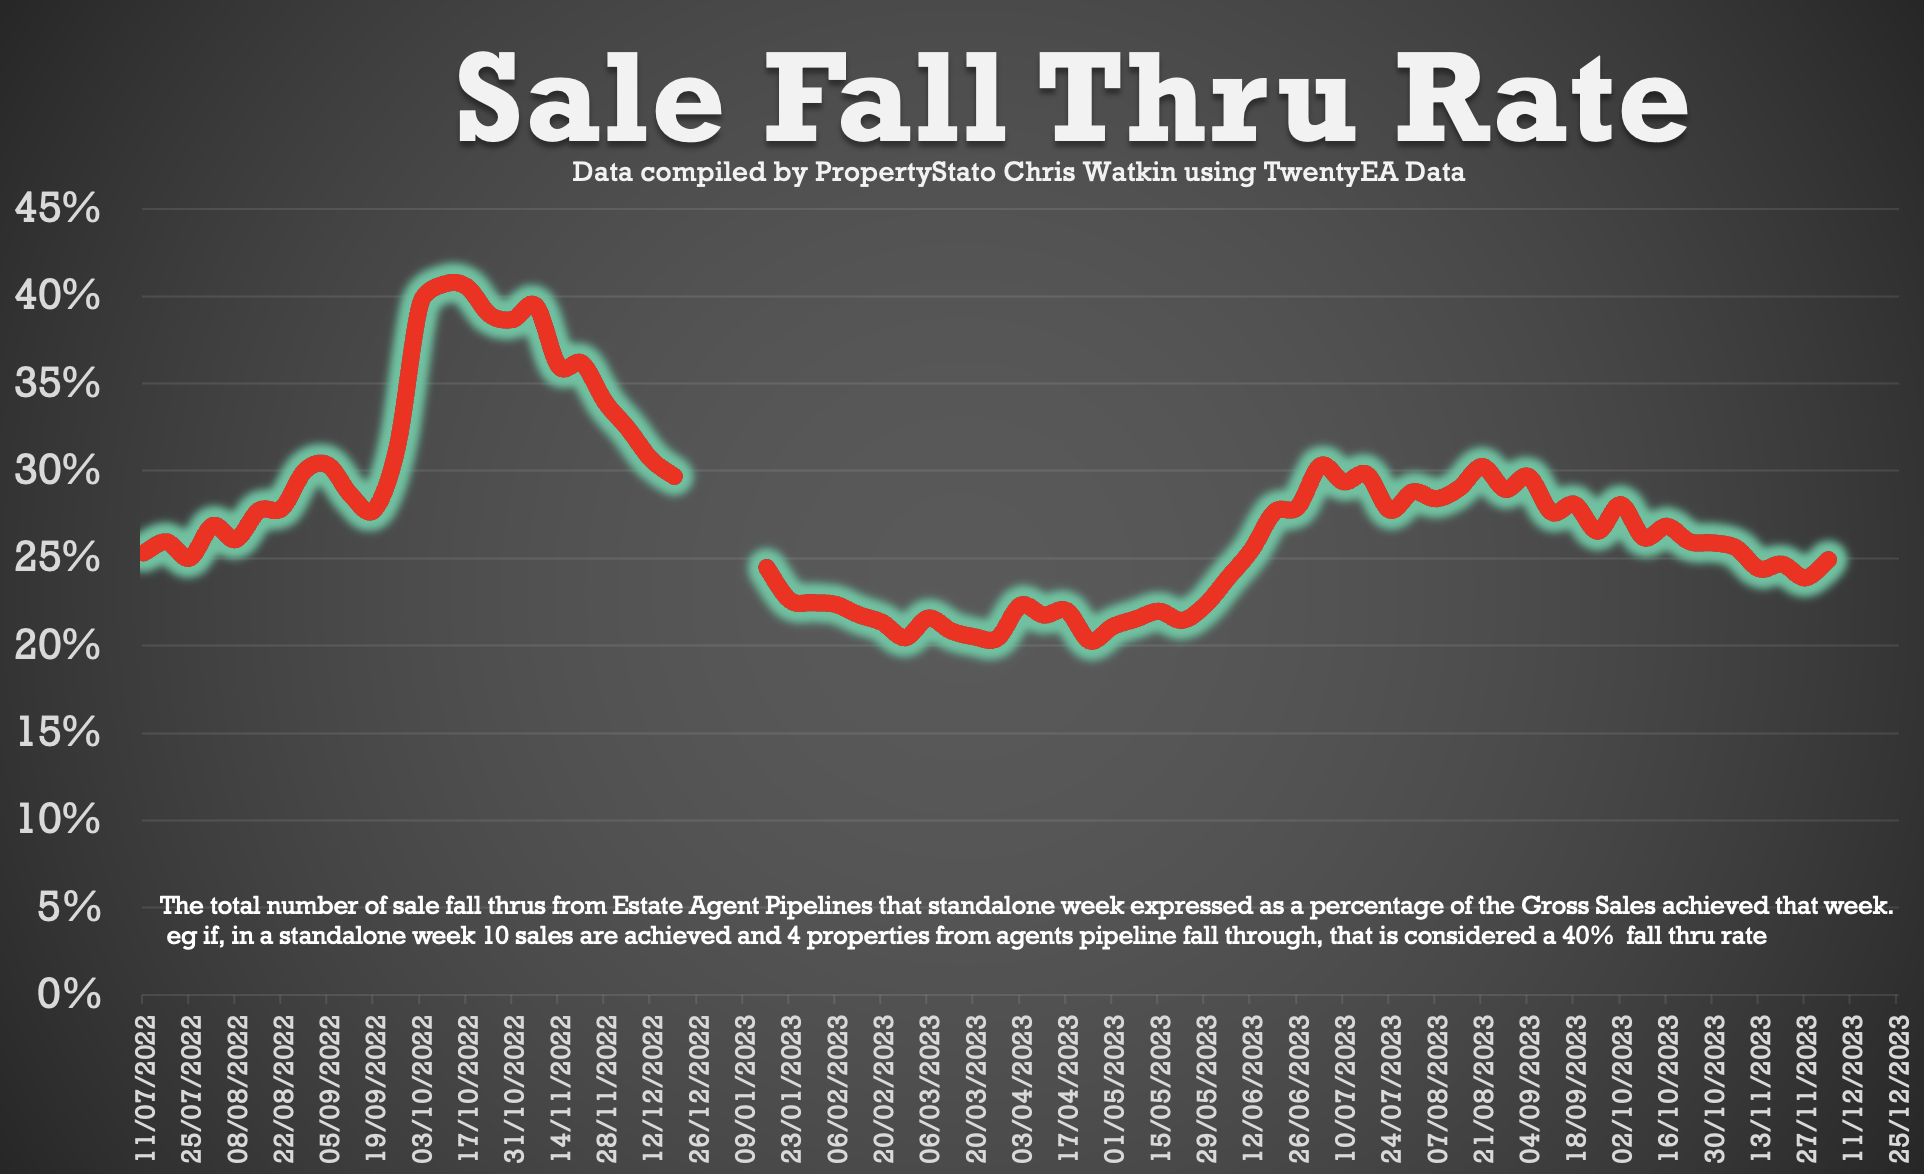
+ Sale Fall Throughs (Units): there were 4,166 Sale Fall Throughs, which is lower to last week’s at 4,548. The running 4-week average for Sale Fall Throughs is 4,526 and the YTD figure average of 5,382.
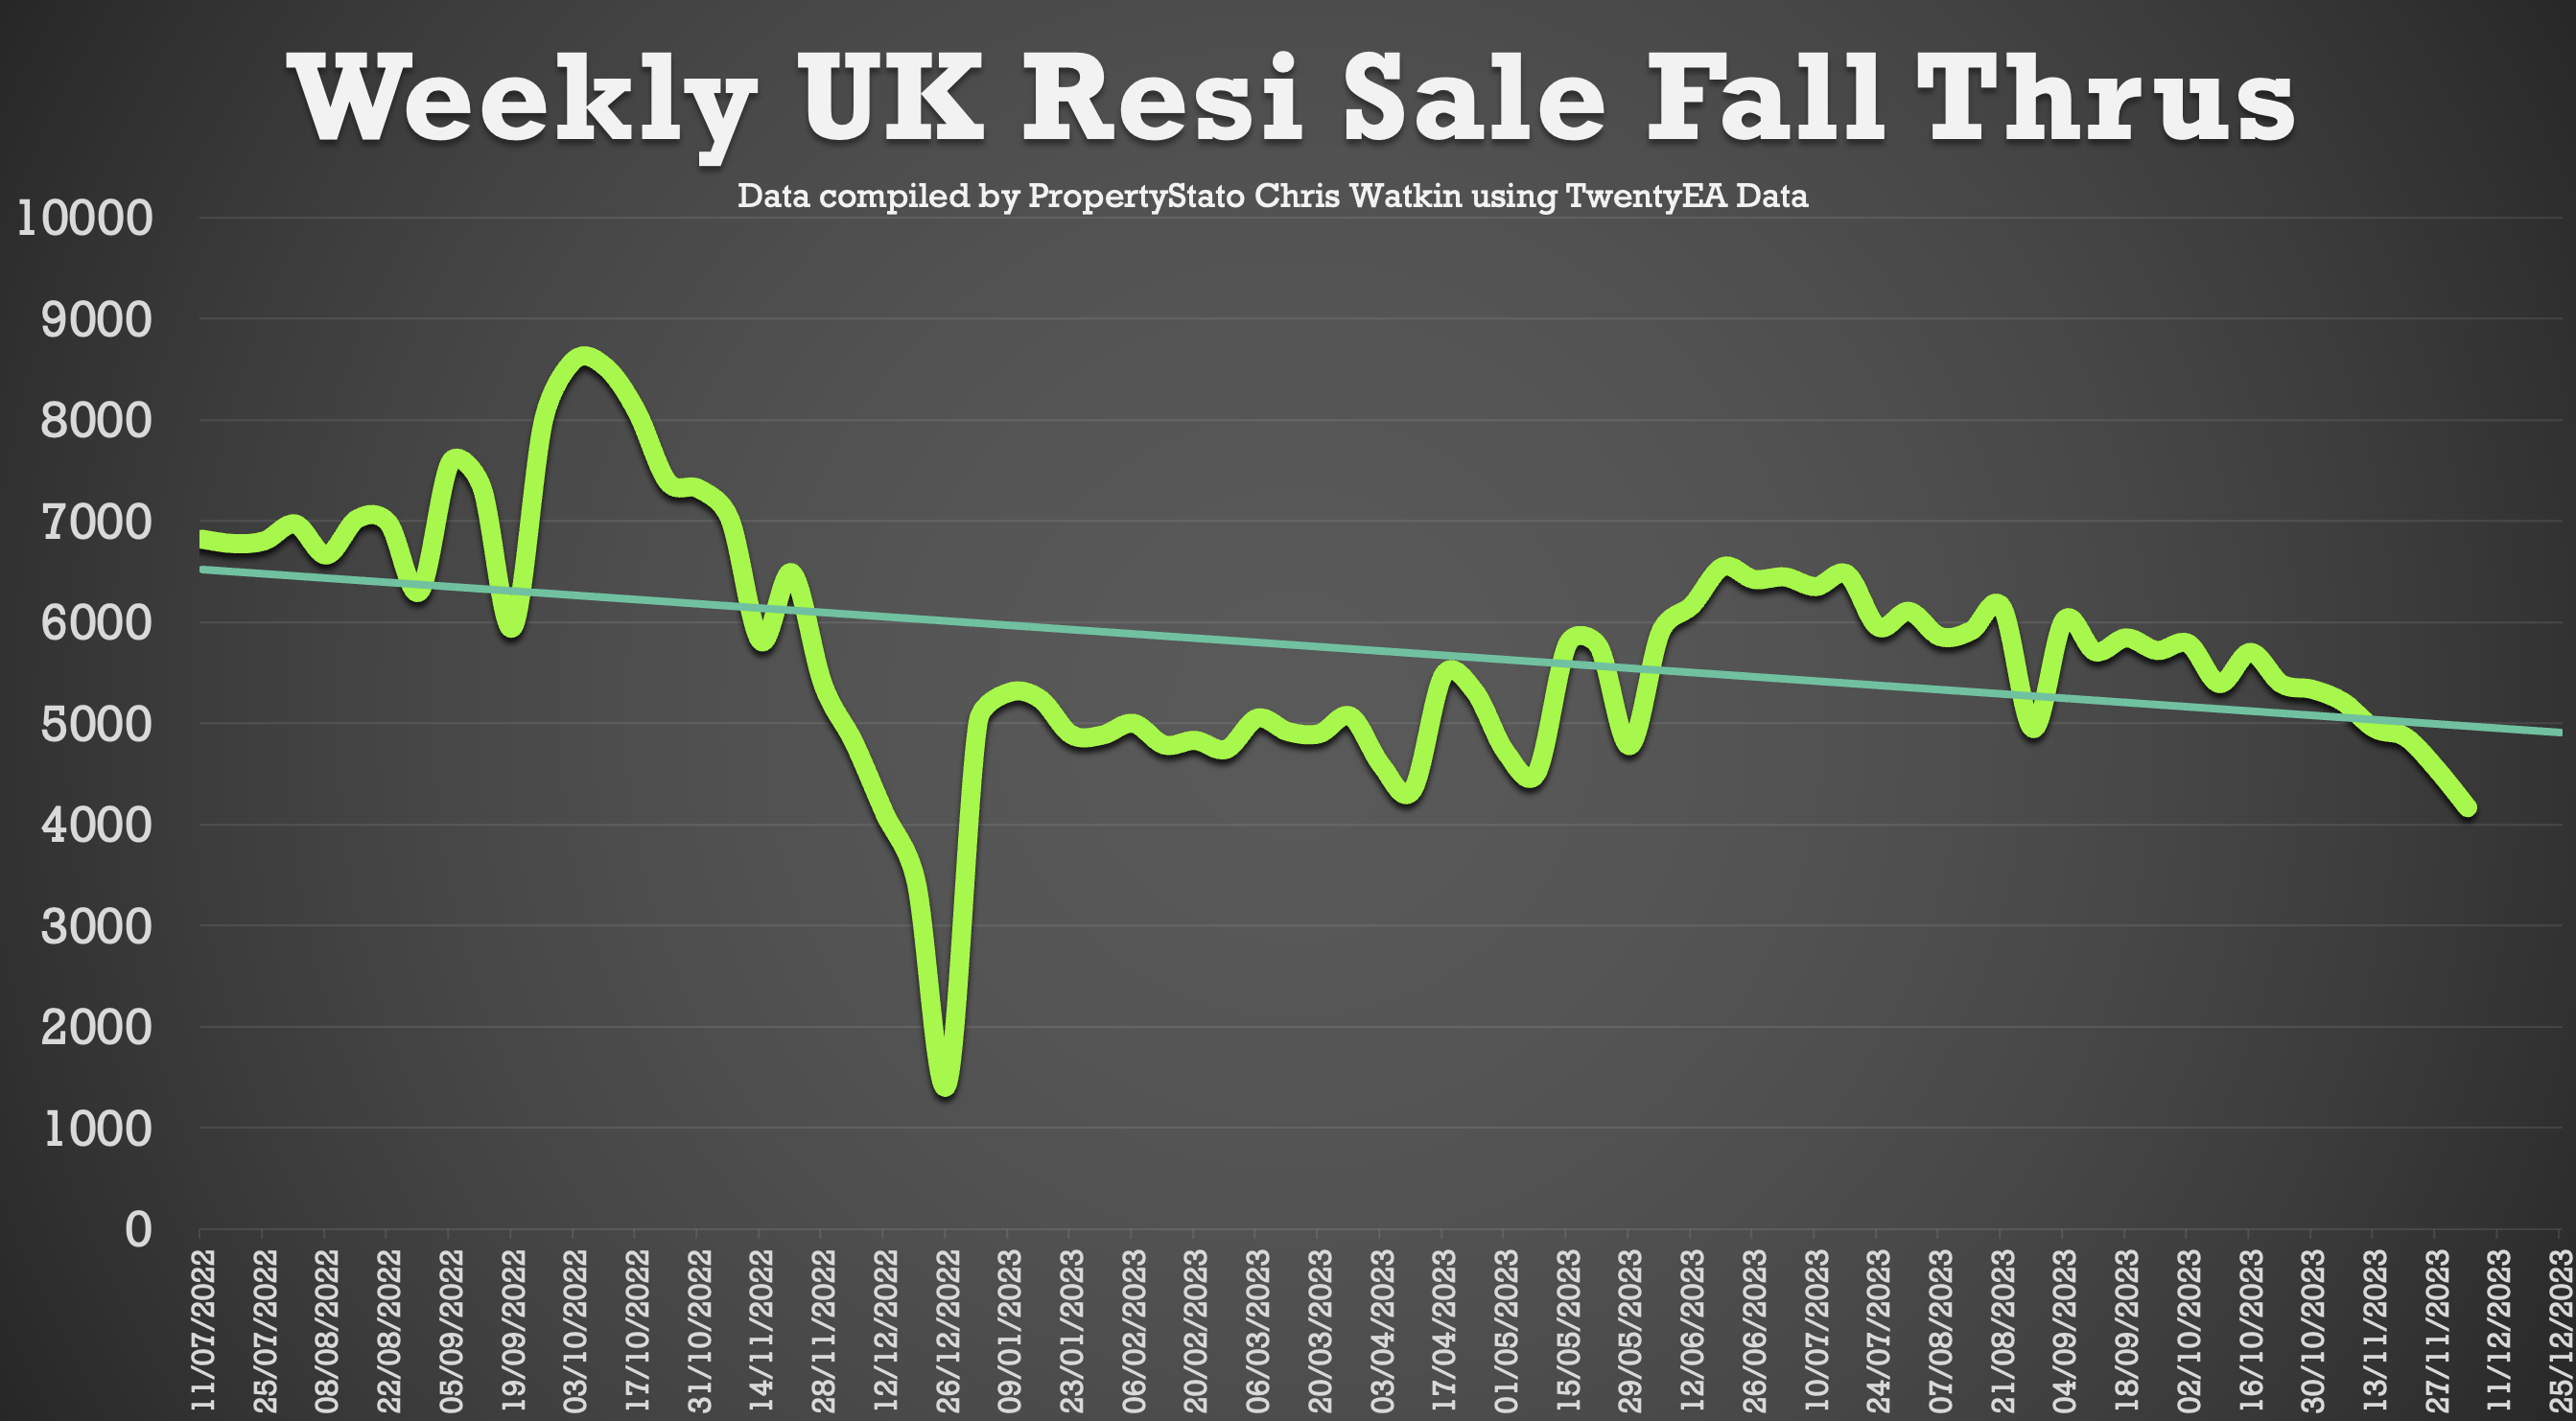
+ Sale Fall Throughs (%): The Sale fall Through Rate (%) is the number of ‘sales fall throughs’ for the week expressed as a percentage of Gross Sales for the week). This week it was at 24.92%. This is a continuation of drop that started in early August 2023 when it was in the early 30%’s. The 2023 running weekly average is 25.59%. Let us not forget, in the same week of 2022, it was 32.42%). The seven-year long-term average is 24.3%.
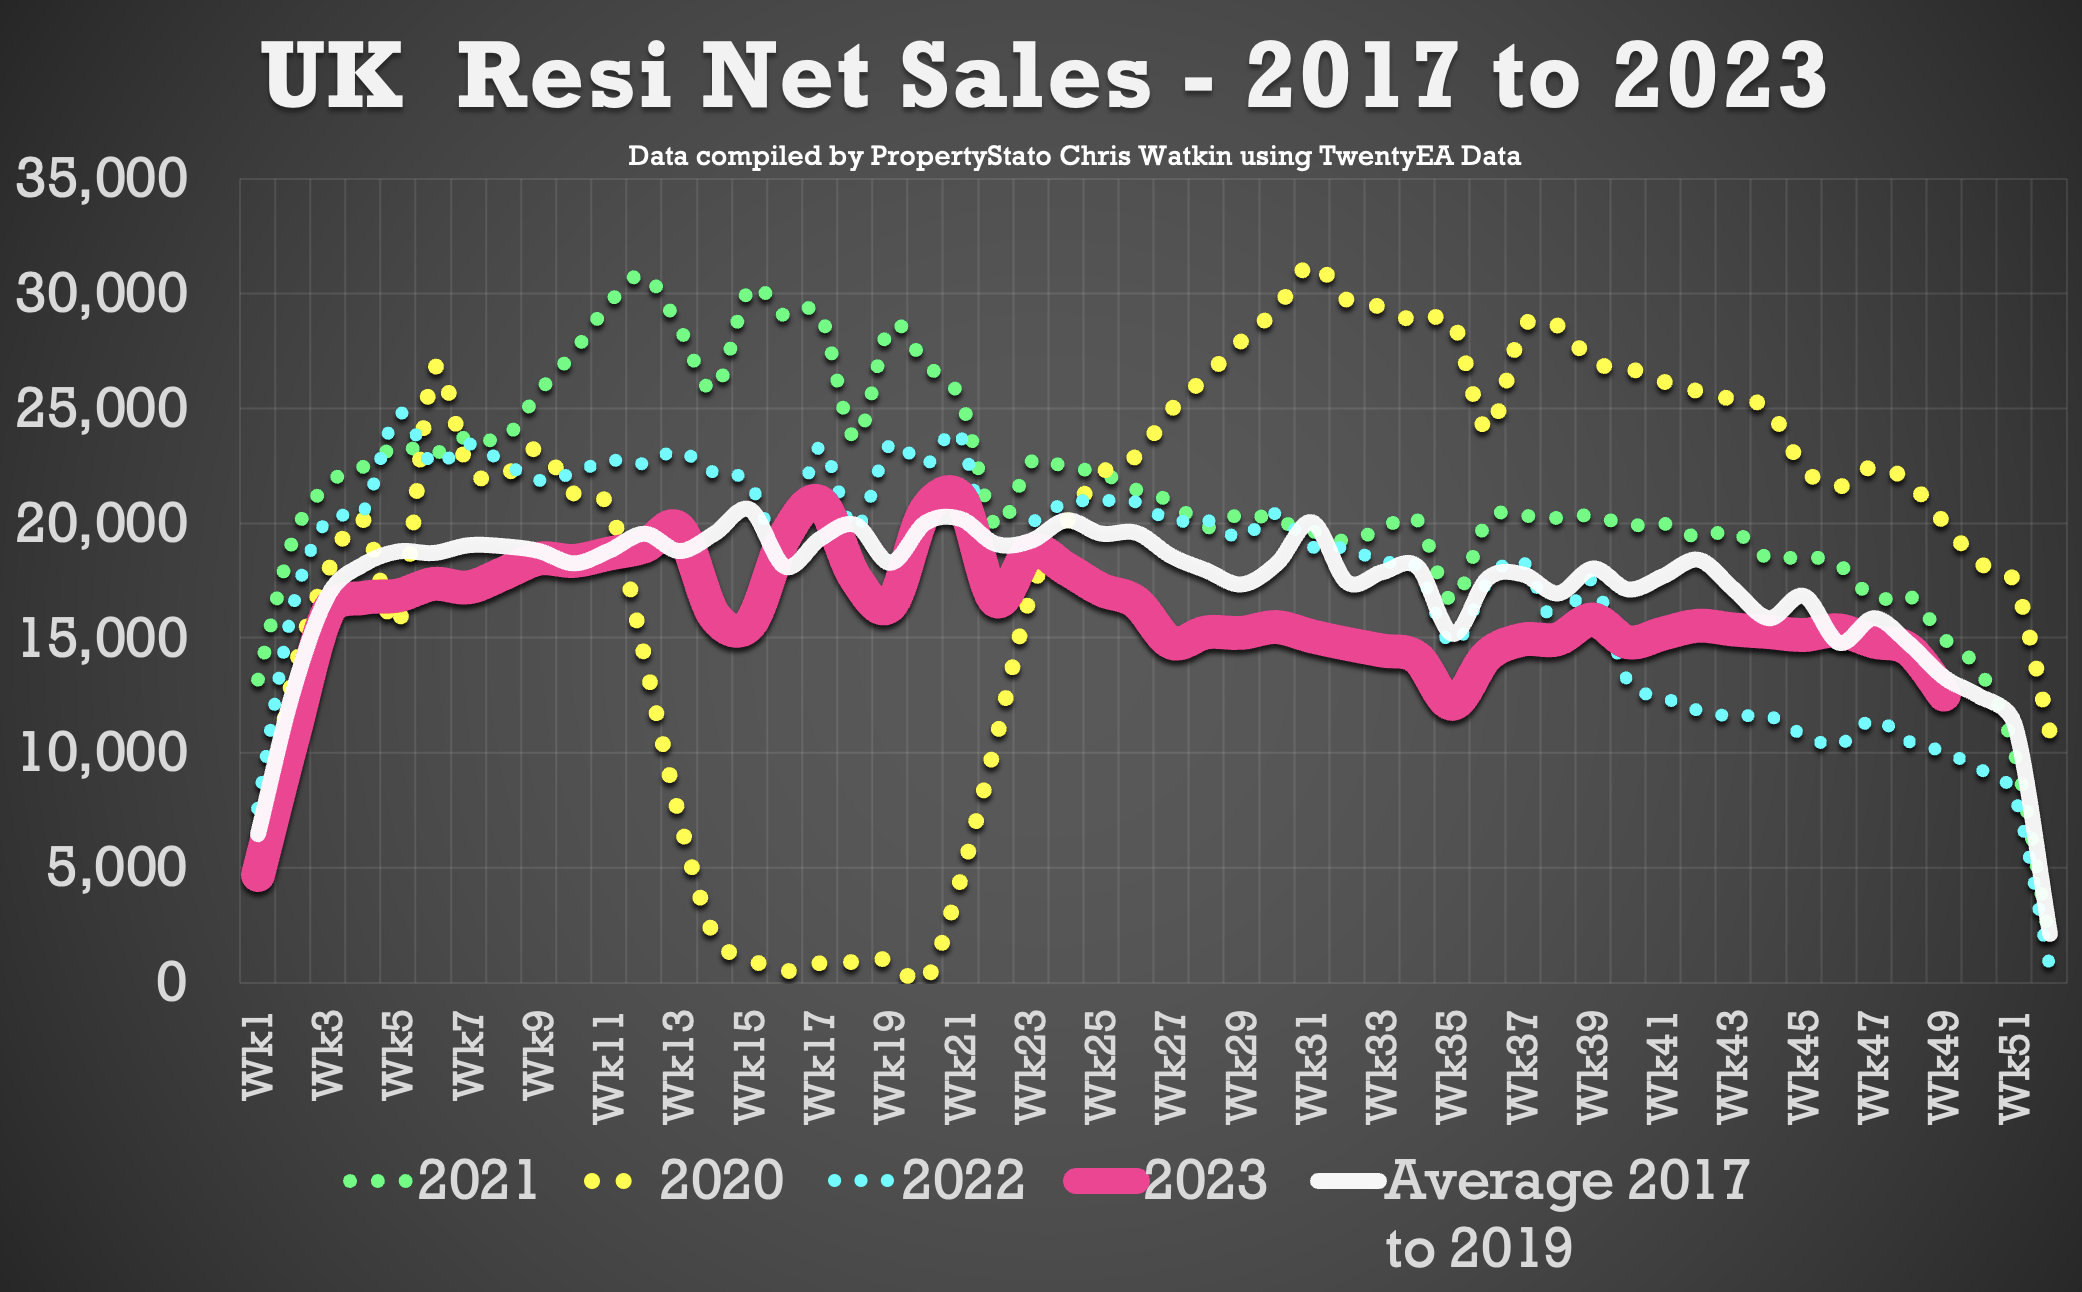
+ Net Sales This Week: Net Sales dropped slightly to 12,529 as can be expected so close to Christmas. excellent when compared to the running two month average to 15,158. YTD running weekly average is 16,129. For comparison, there were 10,026 in net sales for the same week (Week 49) in 2022.
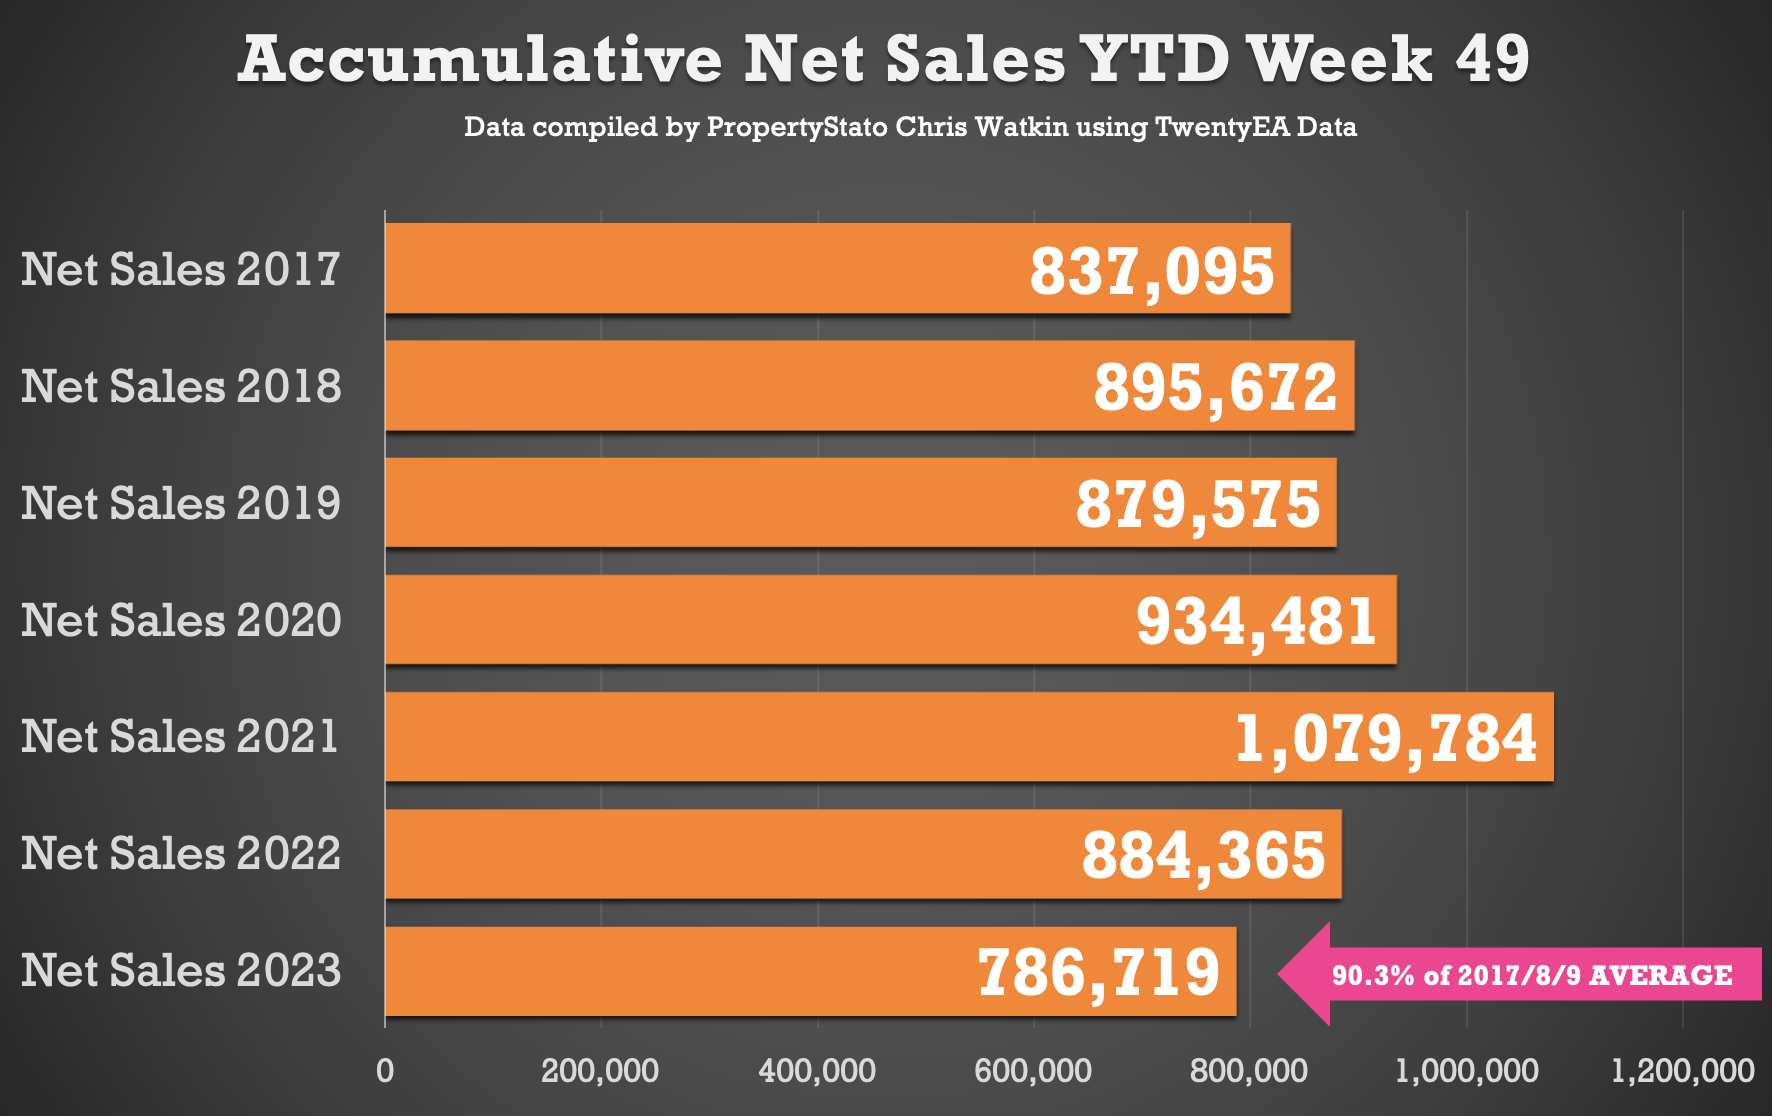
+ Net Sales YTD: Net Sales YTD are 786,719, which represents 90.4% of the average year figures of 2017/18/19. In the summer, I predicted that we would end on 885,000 UK transactions for 2023. (We won’t know that until late spring early summer). Nothing of the last few months has persuaded me otherwise that will be the figure that we will finish on.
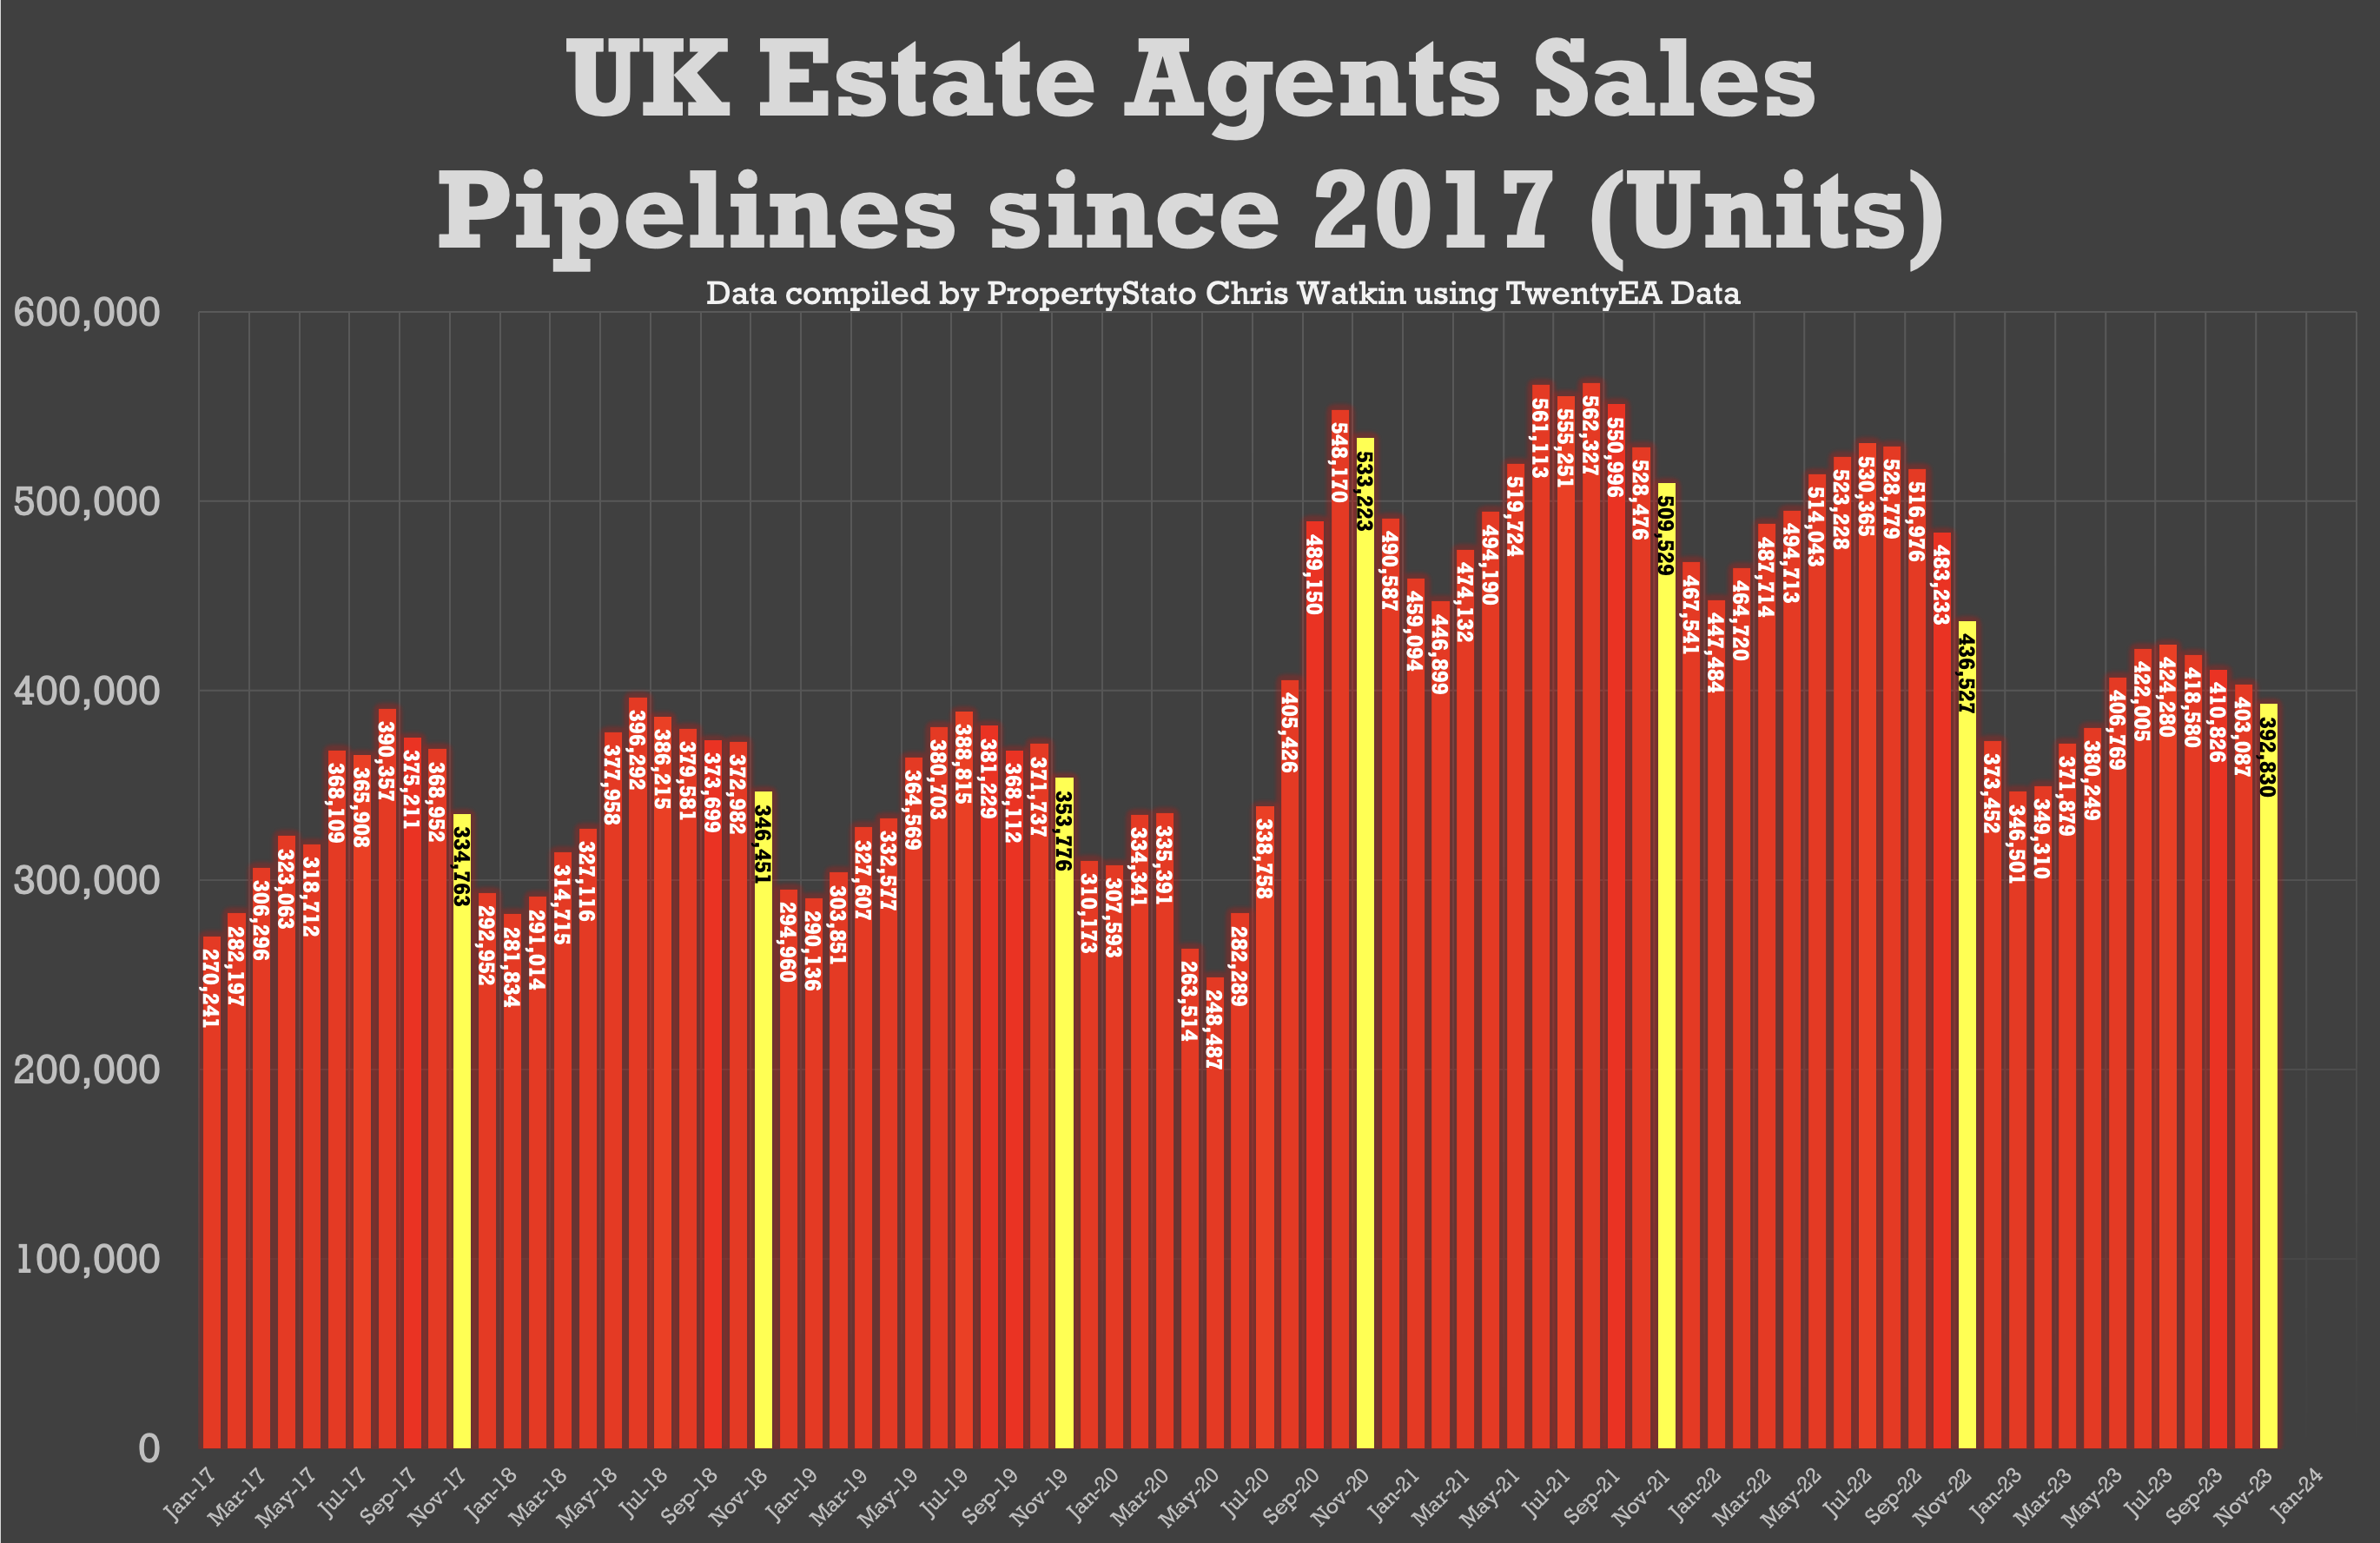
+ Estate agents sales pipelines: as we entered December, there were 392,830 properties in estate agents part line which is 11% higher than the same time in 2019 (when were 353,776 properties in Agents sales pipeline.
+ Overall Stats for the Year: The graph below shows all the main steps for the UK for 2023.
All the data is sourced from the TwentyEA Insights platform and analysed and interpreted by Chris ‘Property Stato’ Watkin.
Chris Watkin will return with his weekly ‘The UK Property Markets Stats Show’ in the New Year.
Thanks Chris for this helpful analysis. May I ask how many estate agency outlets you include in the data and what constitutes an outlet in the first instance? If my understanding on the actual number of operators – from established high street offices to self employed individuals – is correct then based on your stats some must be in severe difficulties (or relying on rental income) to pay the bills and we all know that we’ve got that horrible Q1 of ‘24 to look forward to!
You must be logged in to like or dislike this comments.
Click to login
Don't have an account? Click here to register
Mike – with the number of UK exchanges in 2023, looking like being 22 to 23% less than those achieved in 2022, and costs like wages, rents, et cetera going up then there has to be many UK estate agents in financial difficulty. Many many estate agents in 2008/09/10 got onto the Letting bandwagon and that certainly is keeping them afloat now. However, many of sold their rental portfolio for a quick book in the teens and probably are now regretting that decision. As always running your own business is a challenge and it’s all about making sure that the cash flow is there and more money comes in than goes out. Simple to say – hard to do. Thank you for your comment Sir
You must be logged in to like or dislike this comments.
Click to login
Don't have an account? Click here to register