

Someone might want to tell the buyers, because they are still buying. And in serious numbers.
Doom. Gloom. The Budget. The Gulf. Apparently, every estate agent having a bad month is now a victim of the economy.
But what if the market is not nearly as bad as some agents need you to believe?
This week, Nick Neill joins me on the UK Property Market Stats Show to separate the facts from the excuses. Overvaluing to win instructions. Cutting fees to win business. Waiting three months before having the pricing conversation that should have happened on day one.
And then blaming the market when nothing sells. The numbers tell a rather uncomfortable story.
Because sometimes it is not the property market that is broken. It is the estate agency strategy. & mindset. Winning the instruction is easy when you promise the homeowner what they want to hear. Selling the bl**dy house is the bit that proves whether you are any good.
If you are an estate agent who wants to know what is REALLY happening in the UK property market, rather than hiding behind headlines, watch this week’s show on YouTube
Nick & I will show you the UK property market numbers, challenge the excuses and ask some questions that a few estate agents would probably rather we kept to ourselves. There is also a section in the last 30mins of the video on all the estate & letting agents in Ipswich and who is the best (and who needs to pull their socks up)
Watch it. You might discover the market is not your biggest problem…
🟩 Listings
Week 44 ..
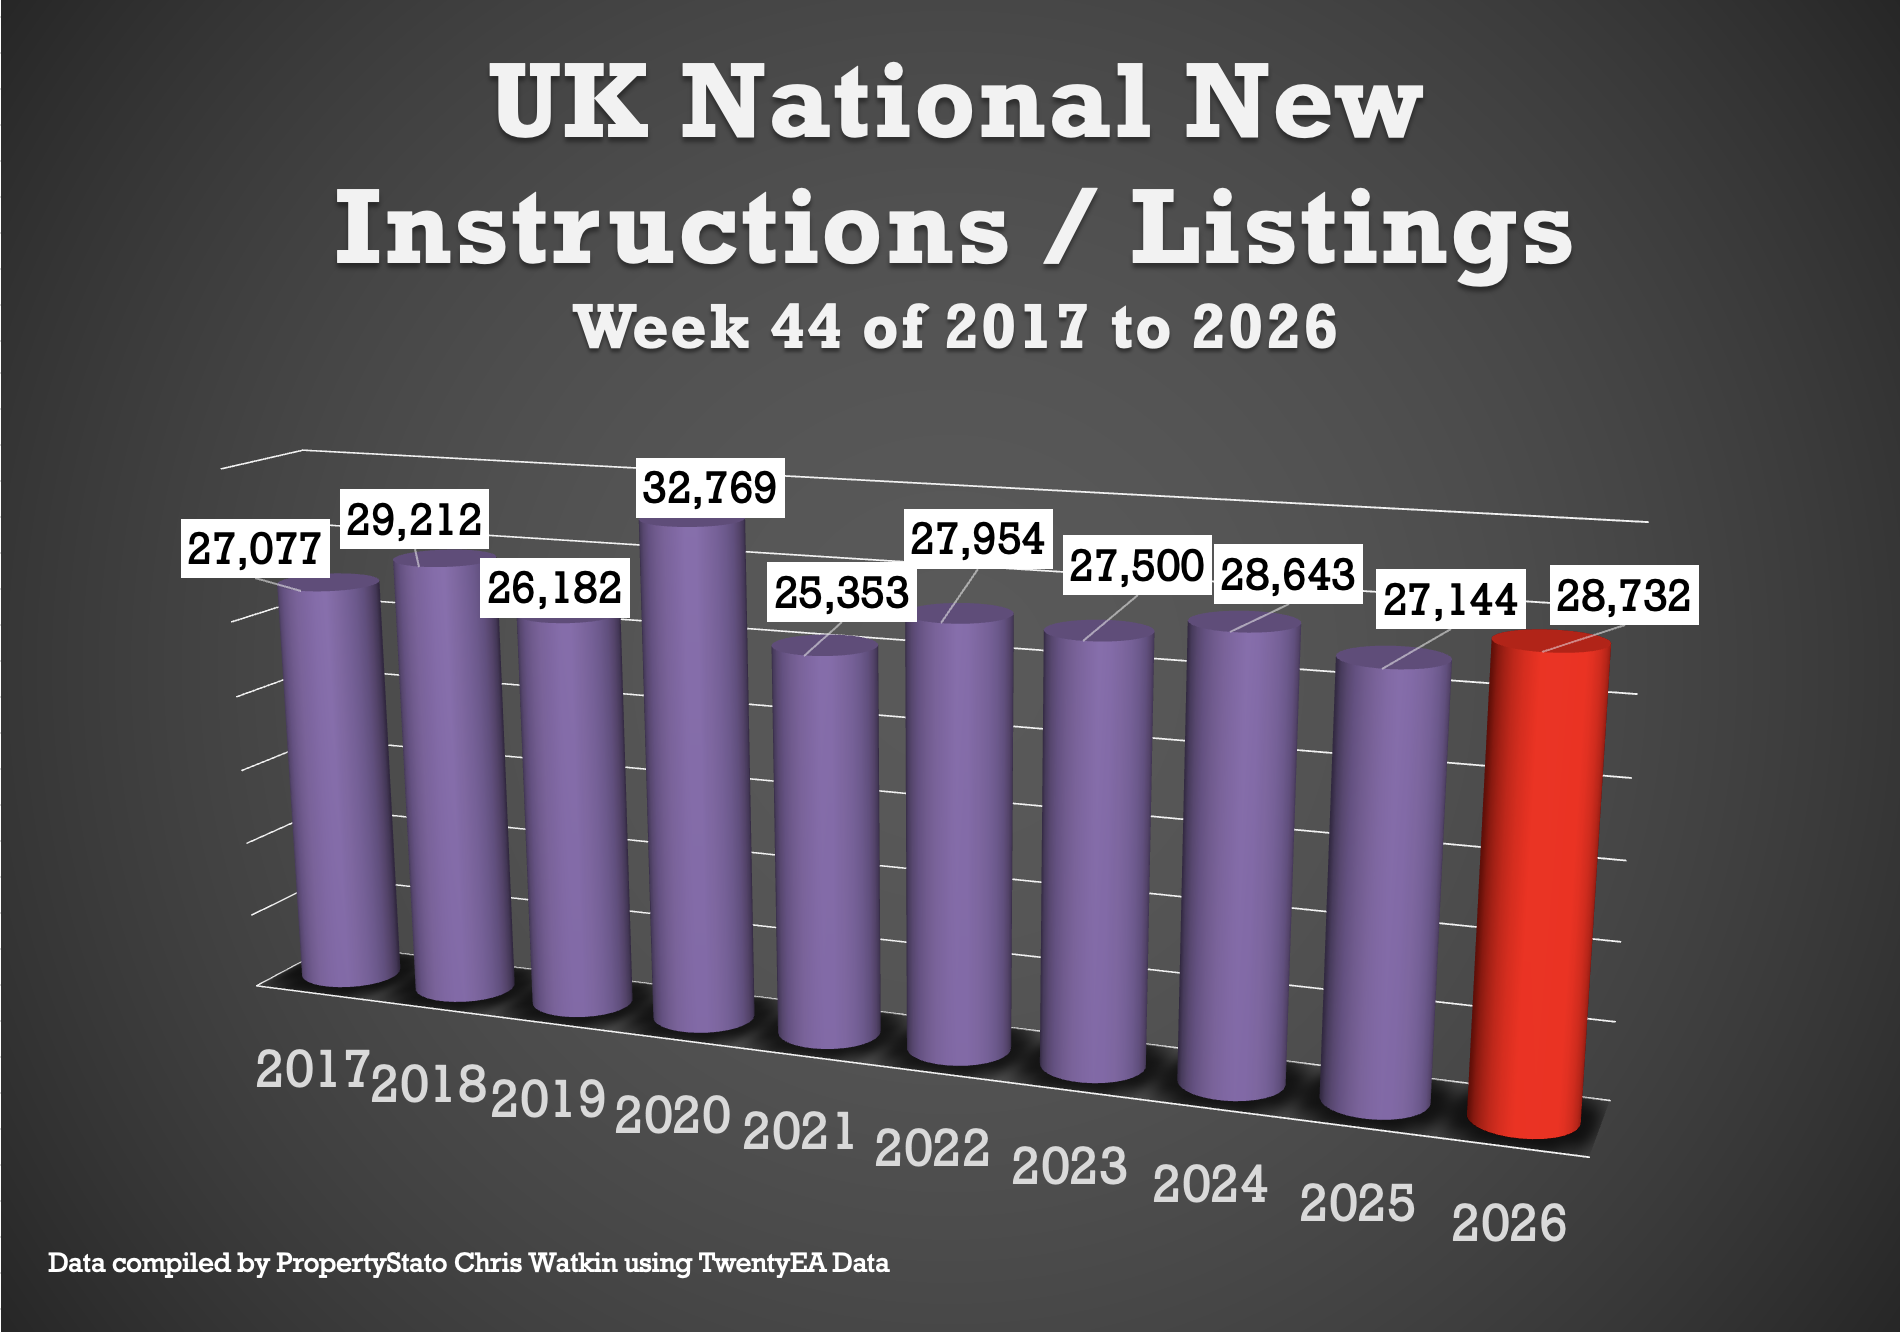
28.7k new listings this week, (27.5k last week).
Weekly 2026 average : 35.4k.
10 year week 43 average : 28k
Year to Date
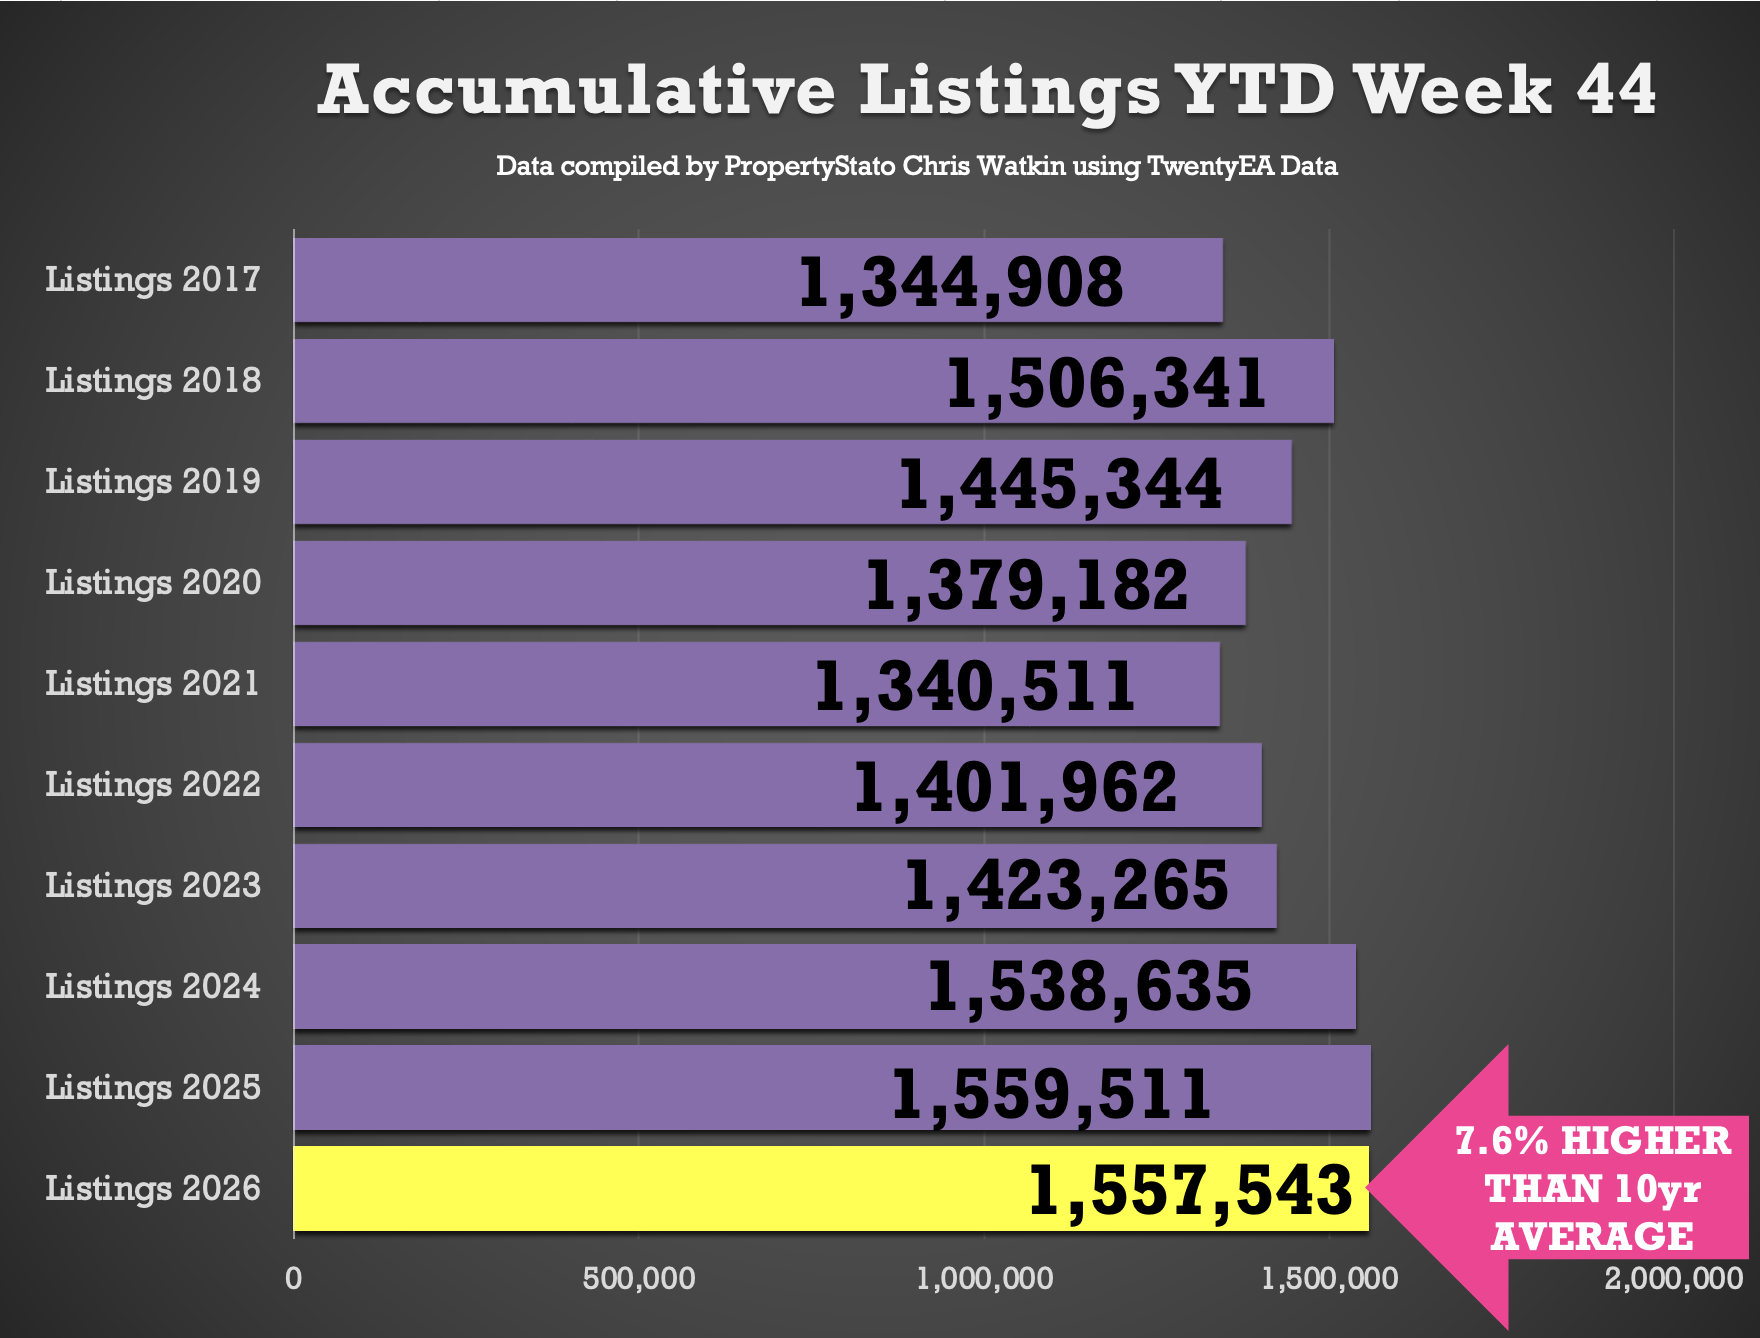
1.557m new listings YTD, which is …
0.1% below 2025 YTD (1.532m)
1.2% higher of 2024 YTD (1.560m)
8.8% higher of 2023 YTD (1.423m)
8.8% higher than the 2017–19 average YTD (1.423m).
7.8% higher than last decade YTD average – (1.445m).
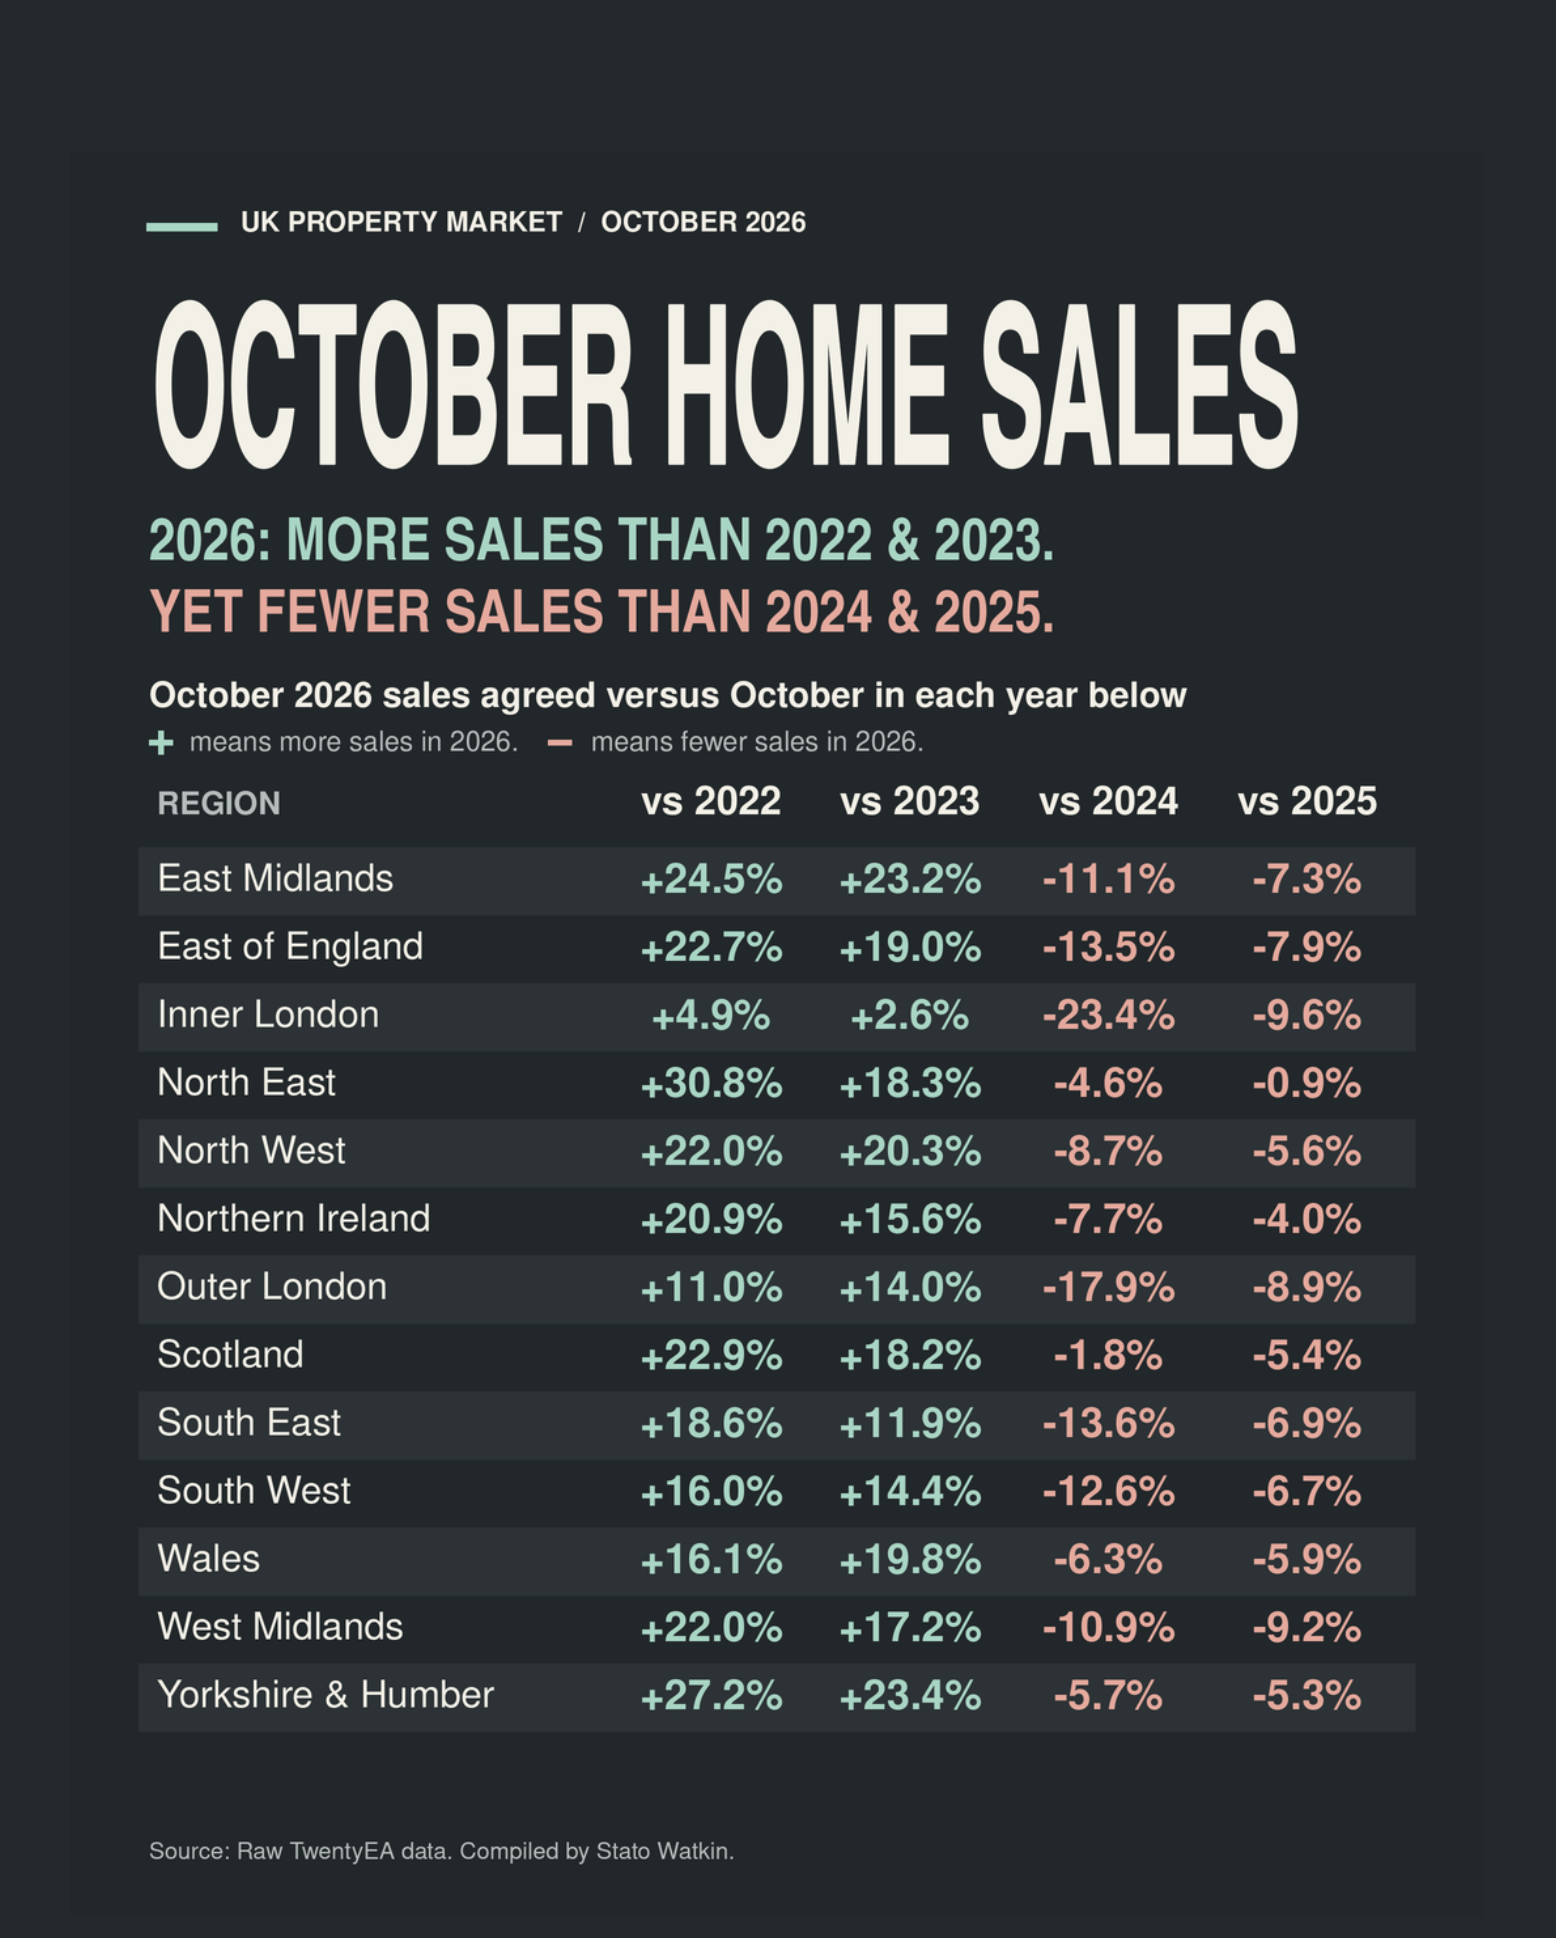
🟩 UK Gross Resi Sales
Week 44 ..
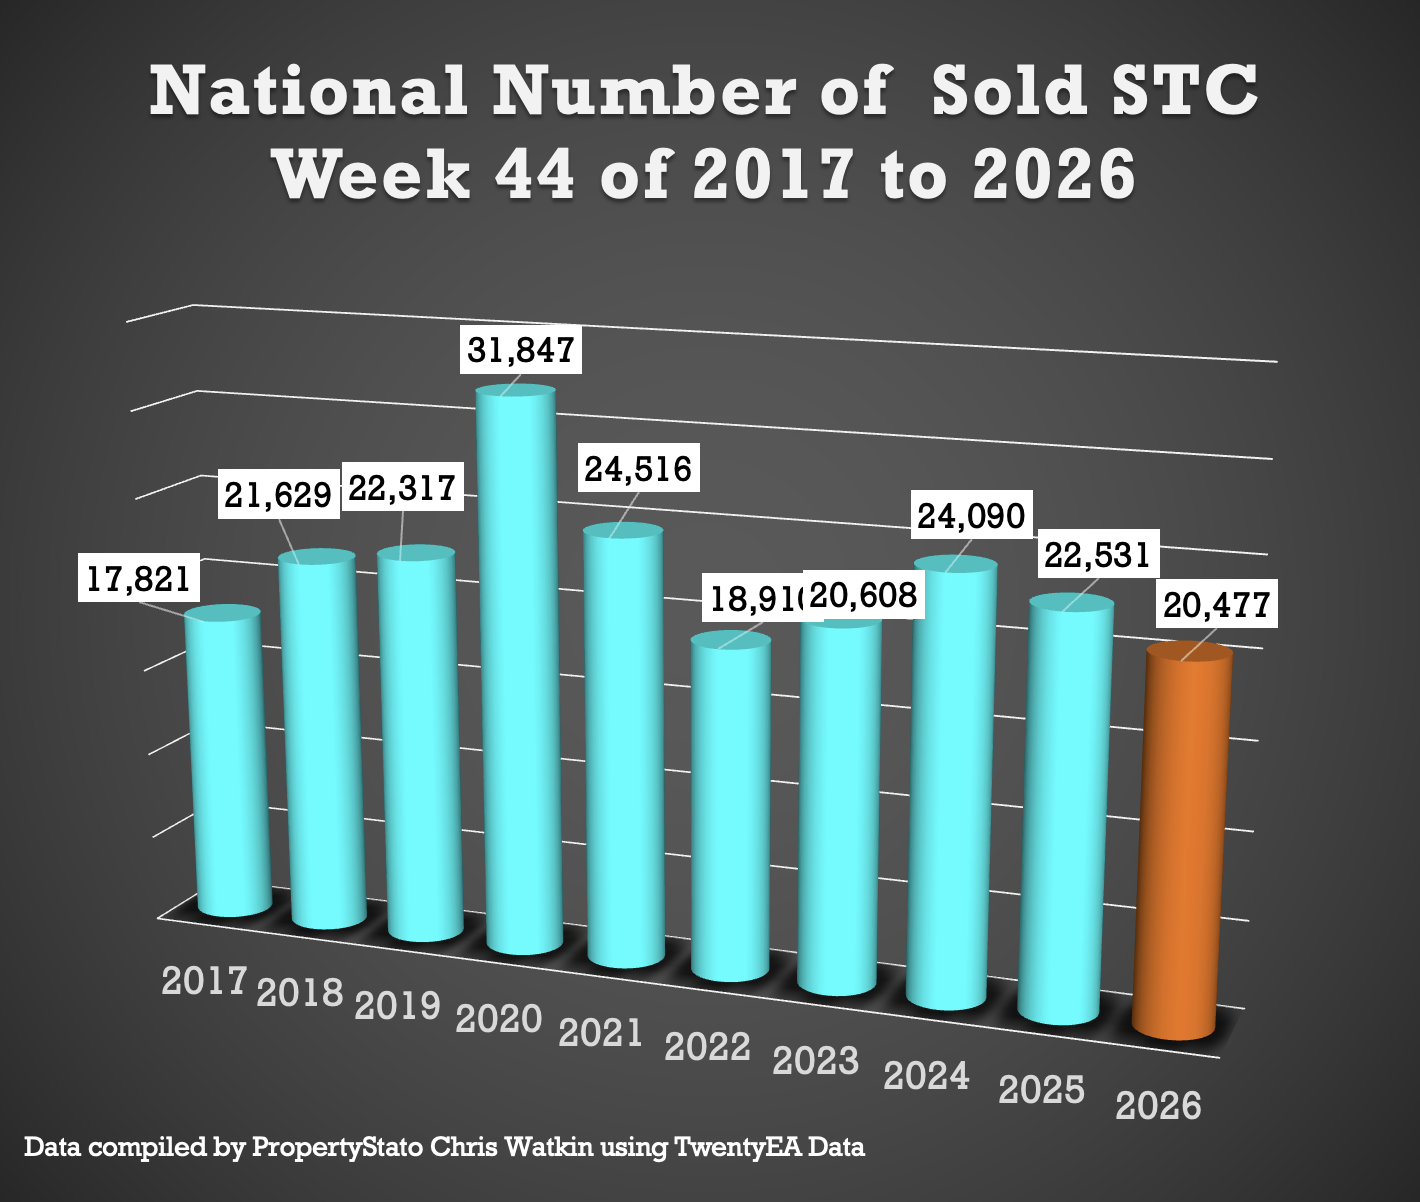
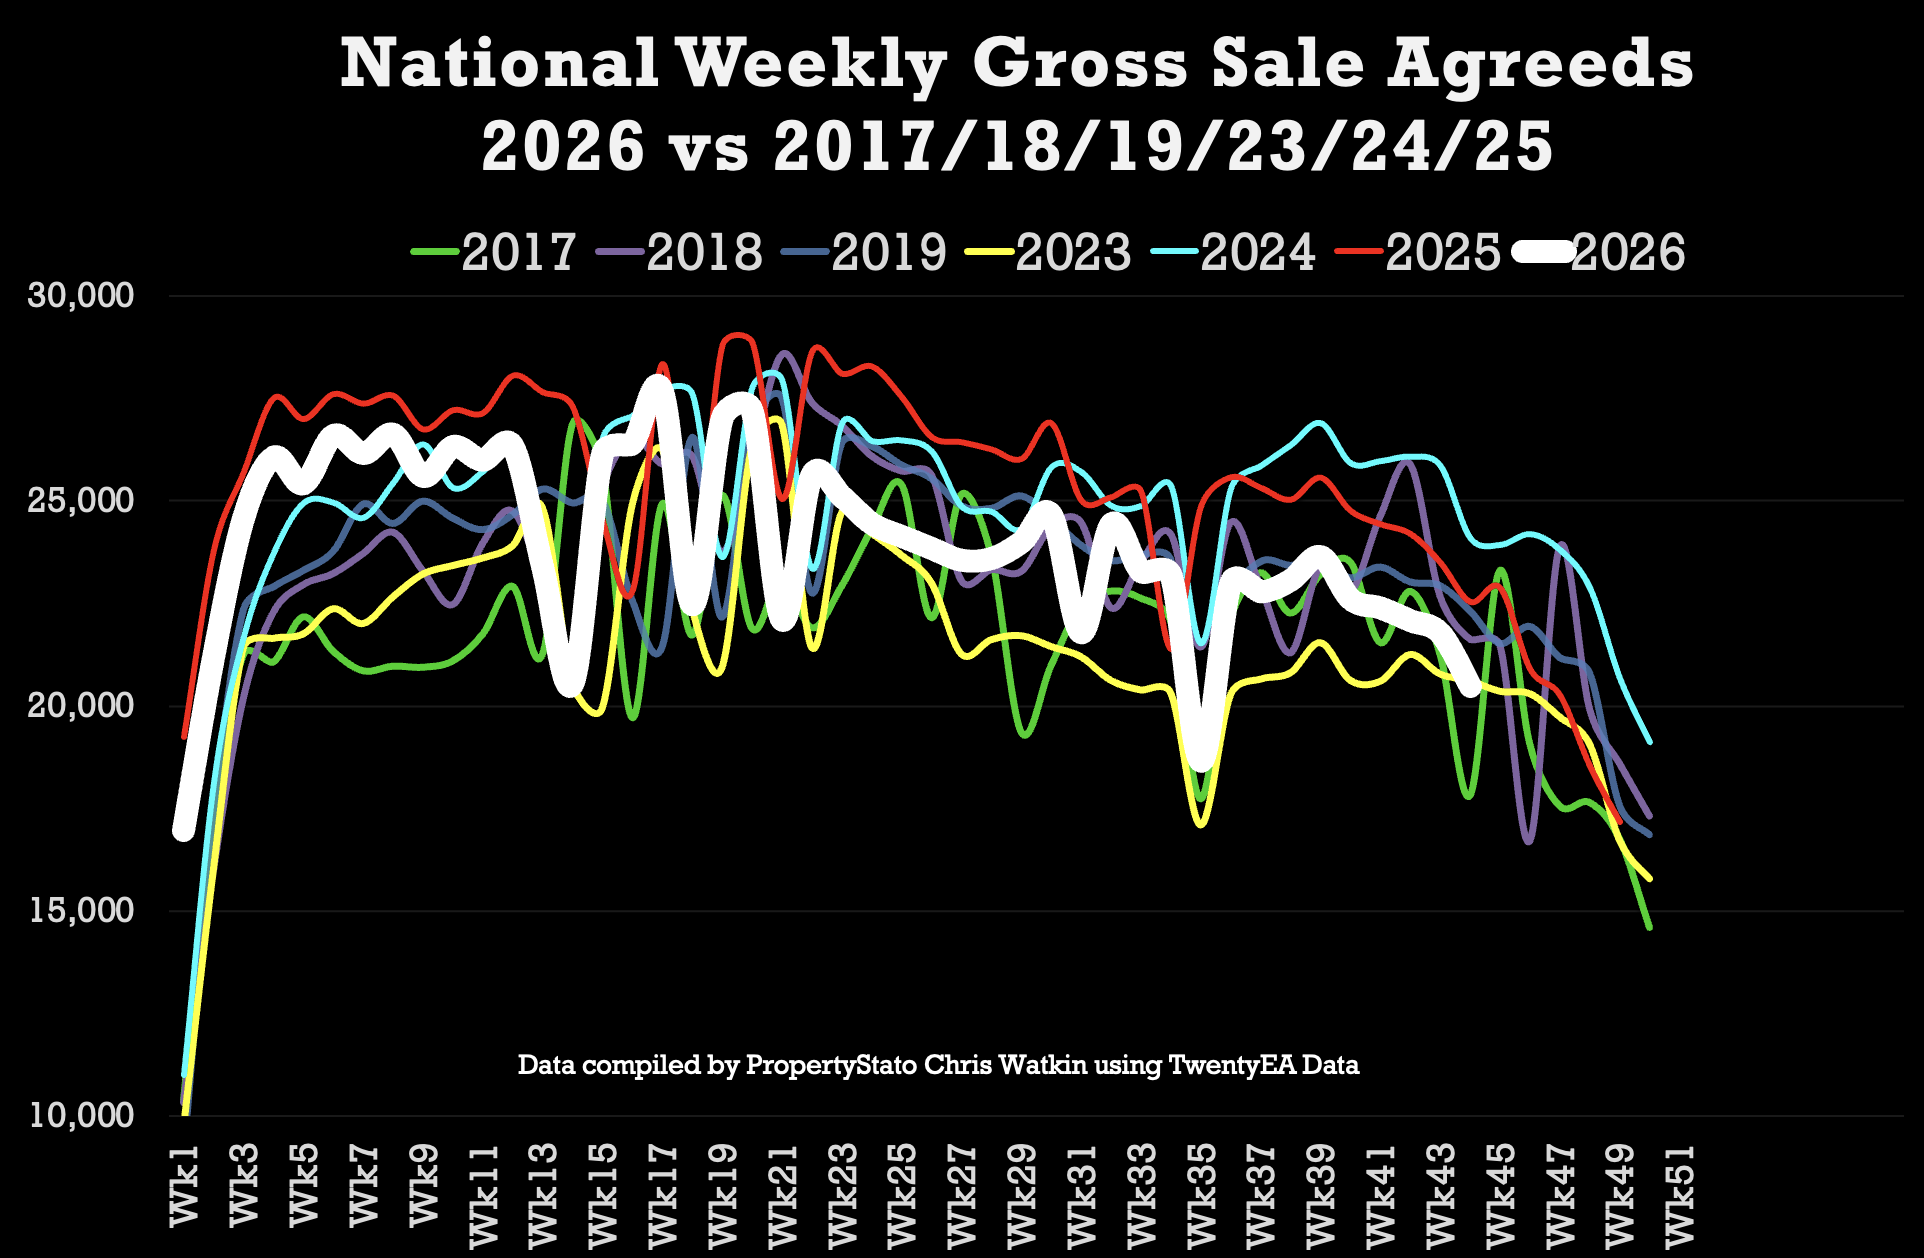
20.5k homes sold stc this week 43 (21.8k last week) – a drop of 5.9% from last week
Decade Average Drop from week 43 to 44 is 5.9%
10 year week 44 average : 22.5k
2026 weekly average : 23.9k.
Year to Date for house sales
1.053m UK homes sold stc YTD, which is …
7.5% lower than 2025 YTD (1.139m)
3.9% lower to 2024 YTD (1.096m)
10.3% higher than 2023 YTD (954k)
4% higher above pre Covid 2017-19 years (1.012m).
2% lower than the decade YTD average (1.075m).
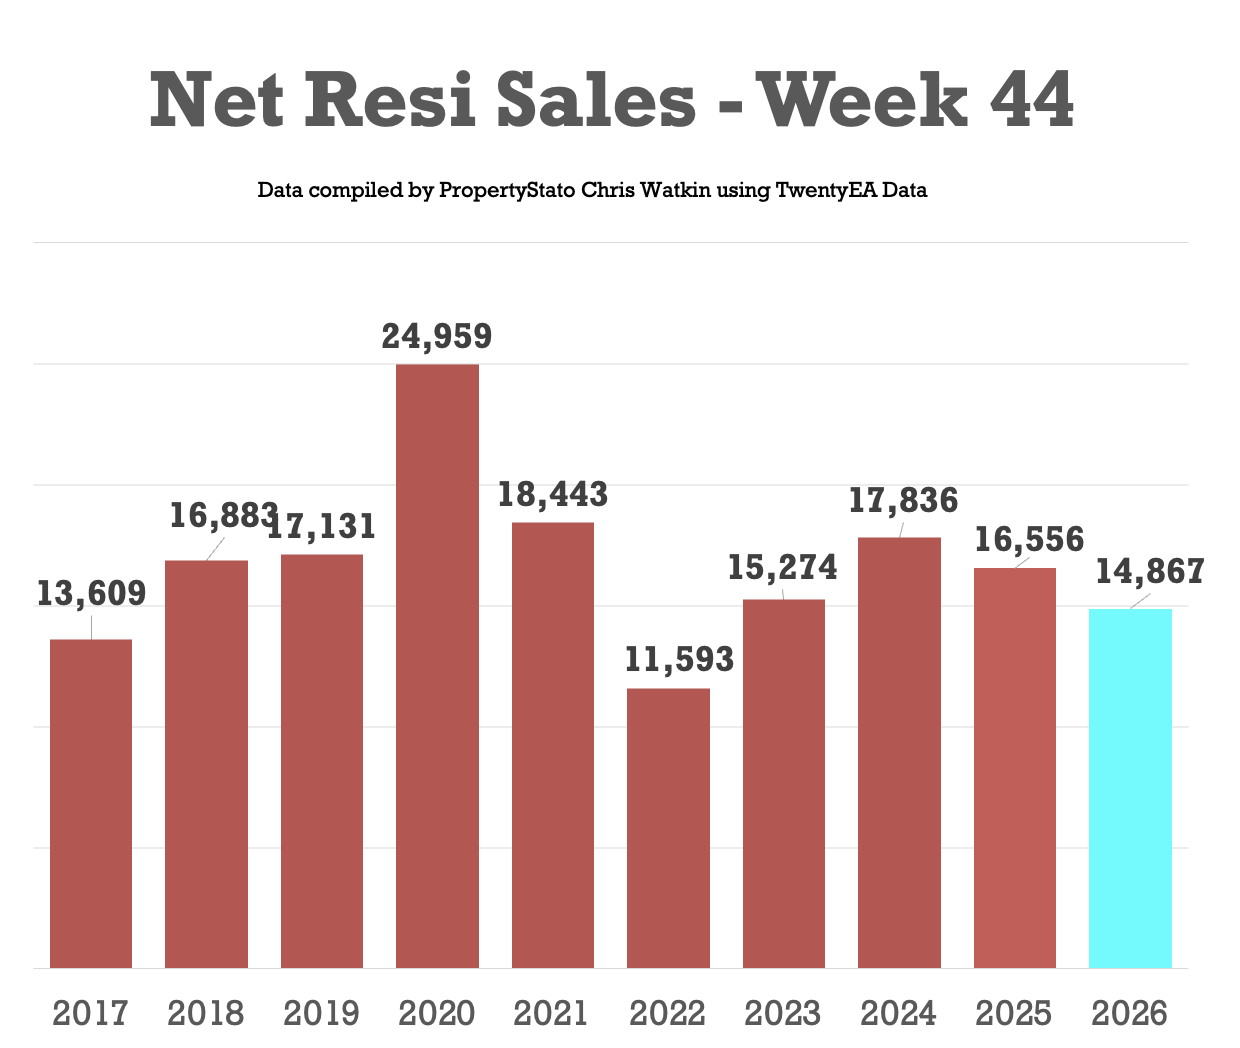
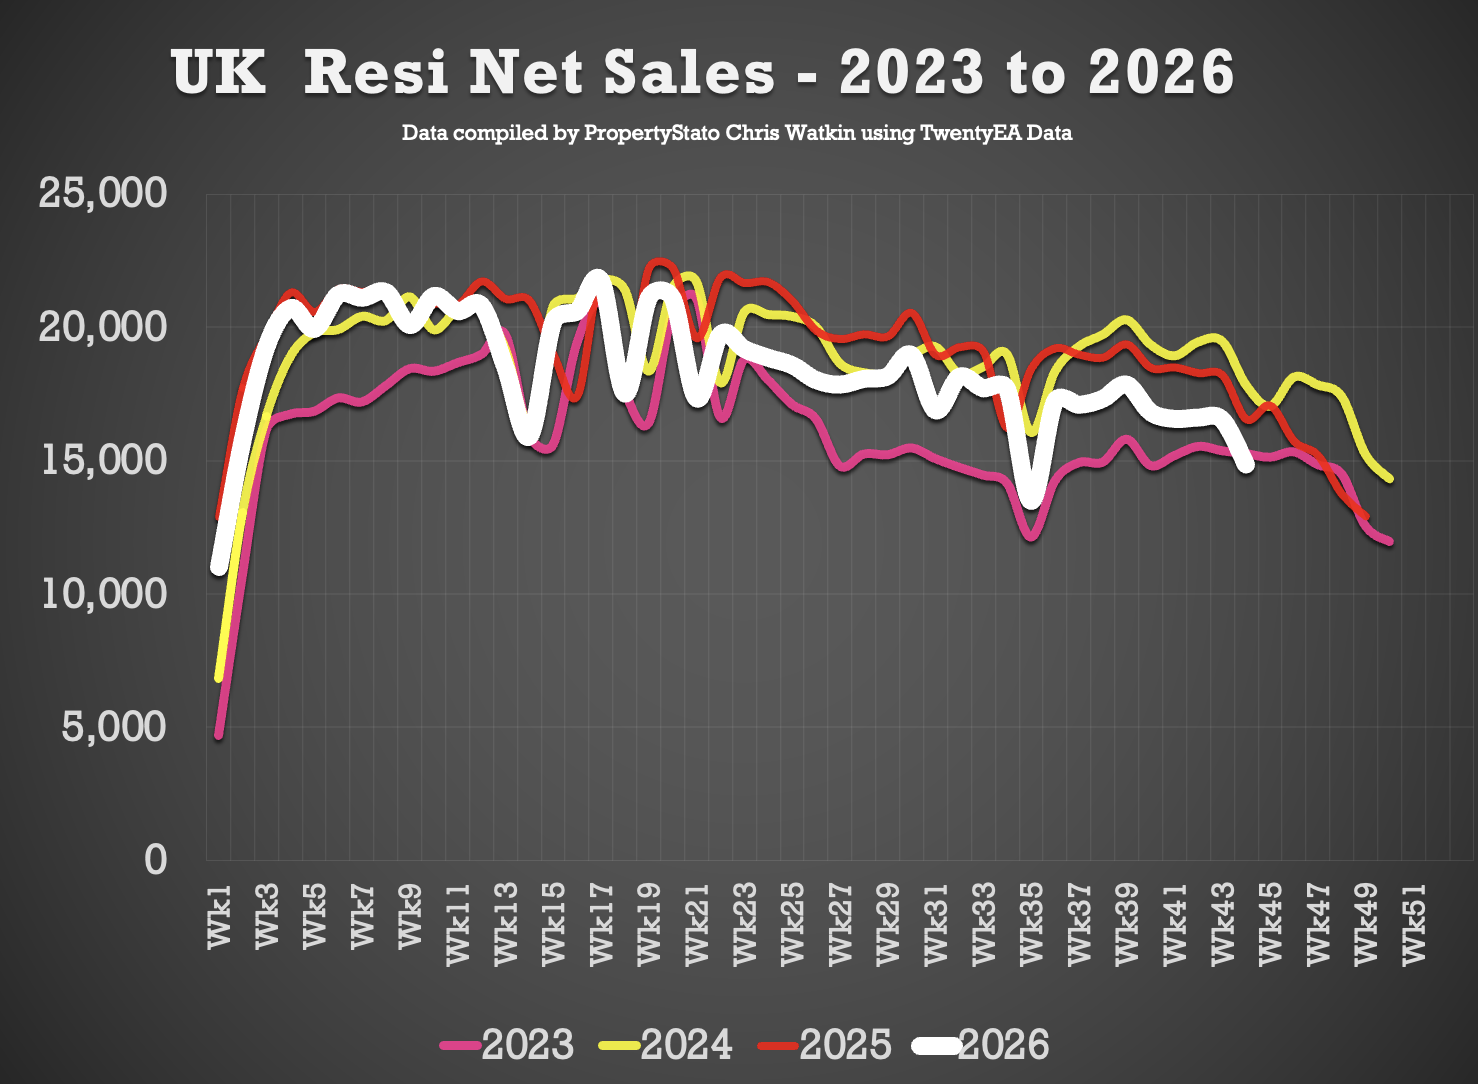
🟩 UK Net Resi Sales YTD
(Net Sales being Gross Sales less Sale Fall Thrus).
Week 44
14.9k Net Sales (16.5k last week)
10 year Week 43 average: 16.7k.
Weekly average for 2026: 18.4k.
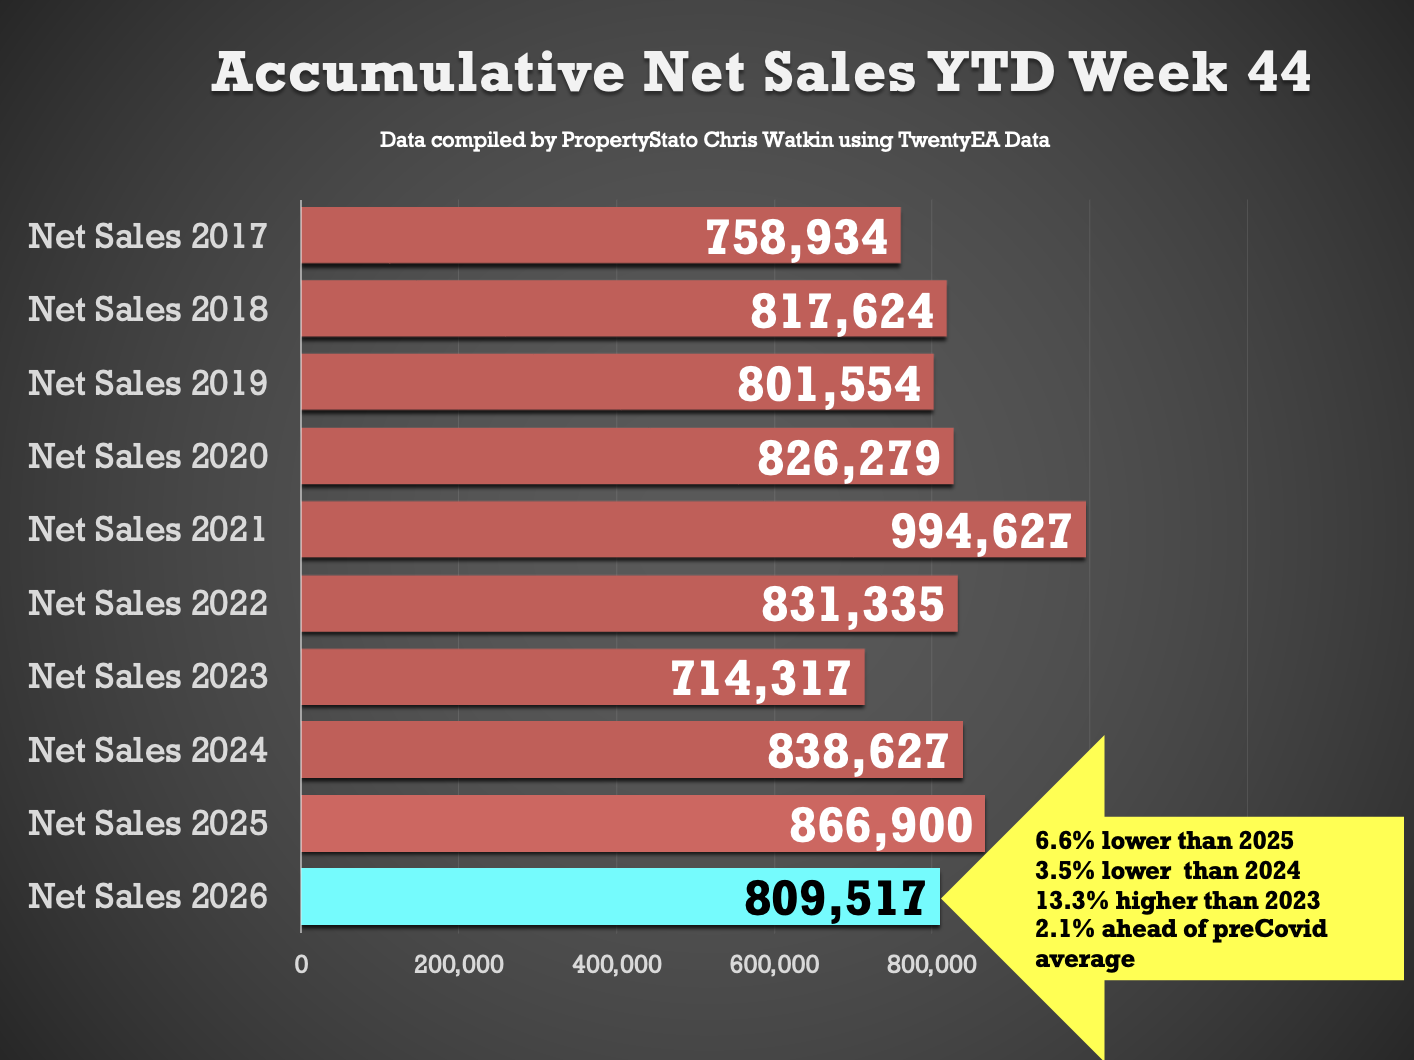
Year to Date
810k UK net home sales YTD, which is …
6.6% lower than 2025 (867k),
3.5% lower than 2024 (839k),
13.3% ahead of 2023 (714k)
2.1% above the 2017/18/19 average 793k).
🟩 Exchanges & Withdrawals
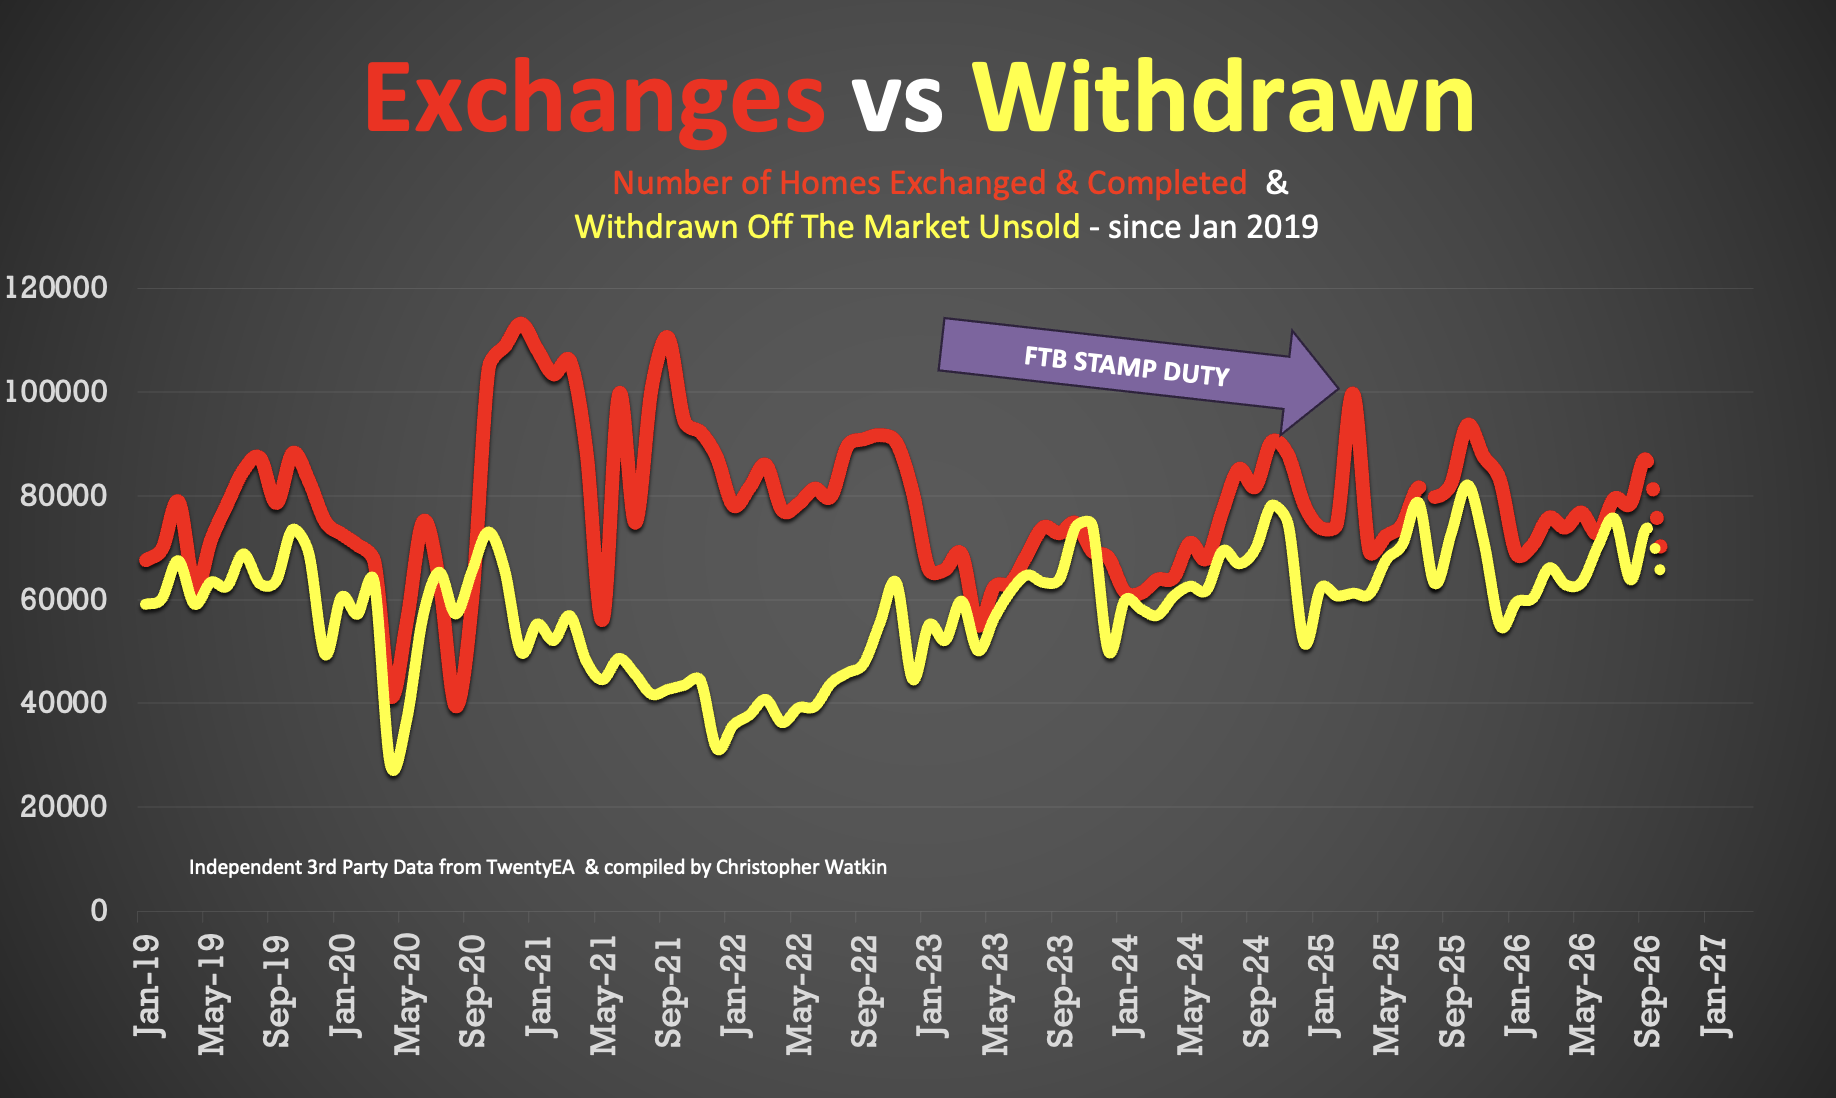
• 66.8k Exchanges in Oct 2026
• 62.9k Withdrawals in Oct 2026
(Note these numbers will change as more exchanges/ withdrawals from October come in during the first few weeks of November)
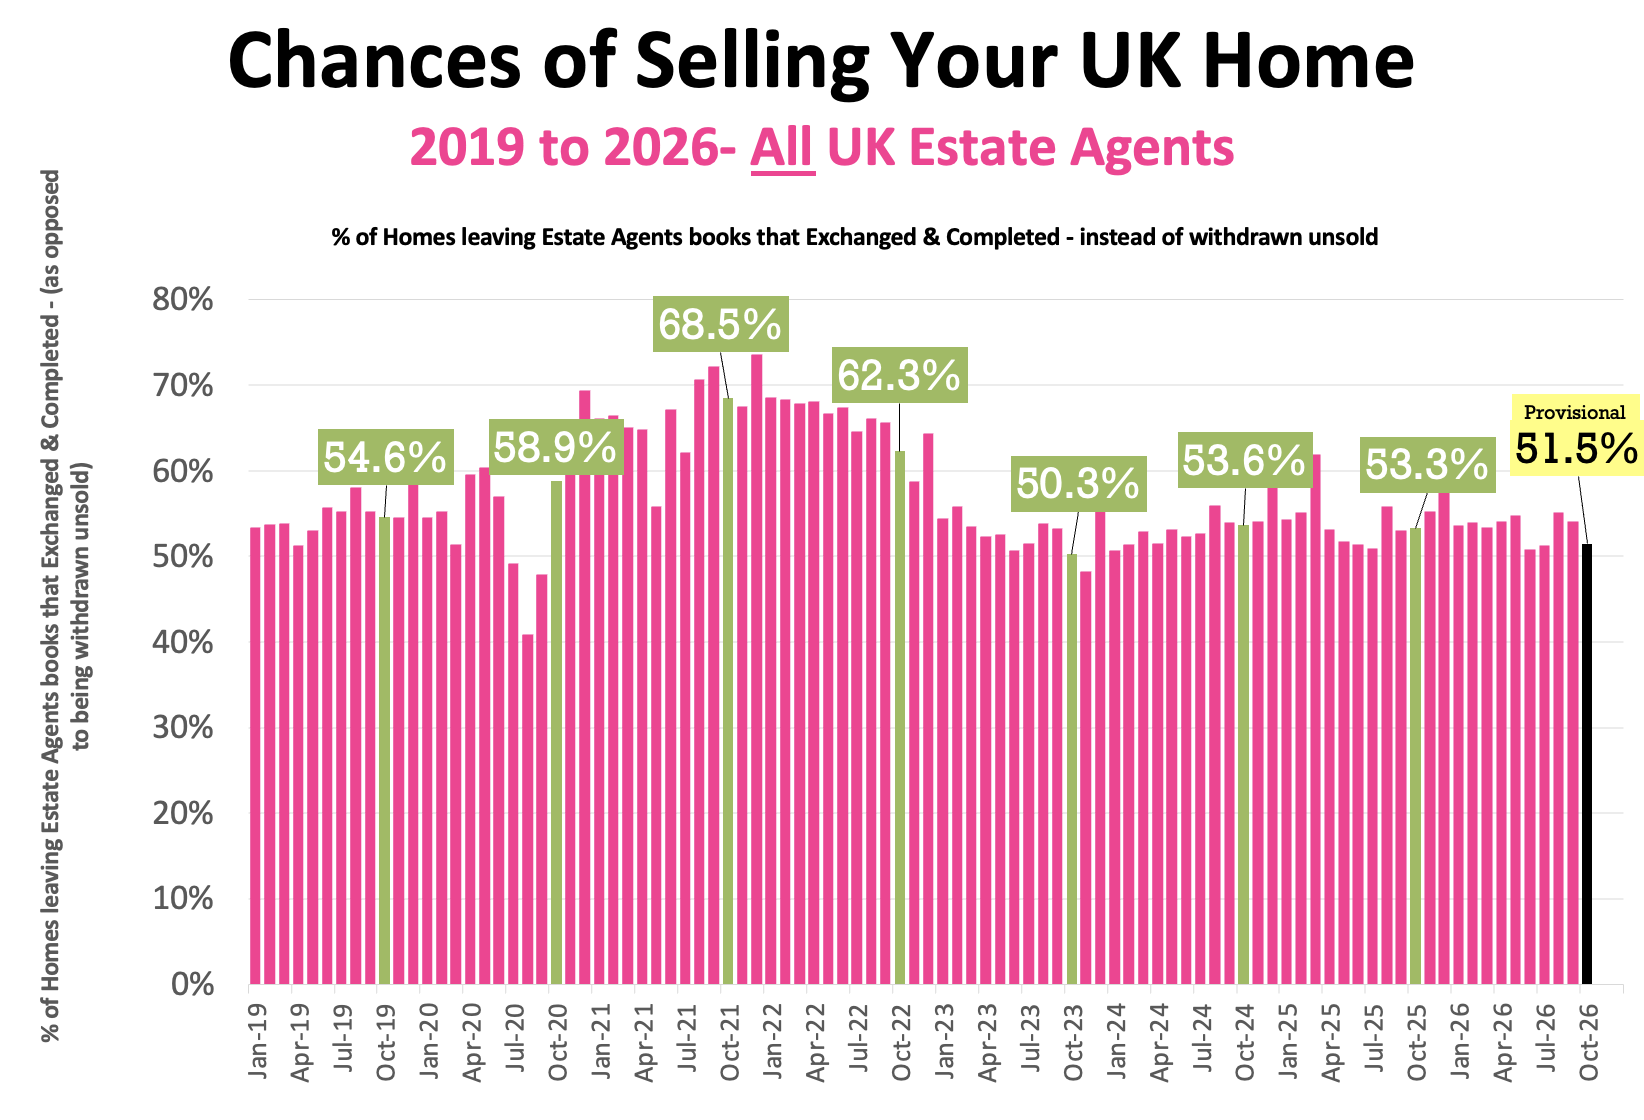
• Therefore, in October 2026, just 51.5% of homes that left agents’ books exchanged & completed in October (the rest – 49.5% withdrew, unsold)
• 57.6% is the 7 year average exchange to listings ratio (which includes the crazy years post lockdown 18 months).
Additional info …
🟥 Price Reductions
• 24k reductions this week on 758k UK homes for sale
• 13.7% of UK homes for sale were reduced in October (down from 14.7% in September)
• 2026 YTD average 13.1%, versus the 7 year long term average of 11%.
🟥 Price Difference between Asking Price of Listings & Asking Price of those Homes that go Sold stc
• Week 44 – 16.9% difference (long term 10 year average is 16% to 17%). (£416k ave Listing Ave Asking price vs £356k Sale Agreed ave Asking price)
🟥 Sell-Through Rate
• 13.4% of homes on agents’ books went SSTC in October ’26 (compared to 14.7% in Sept, 14.7% in August ’26 & 13.8% in June ’26).
• Pre-Covid average: 15.5%.
🟥 Sale Fall-Thrus
• Week 44 Fall-thru rate 27.4%
• Decade average: 24.5%
• 5.42% of homes sold STC fell thru in October 2026. Interesting when compared with the 2026 YTD average of 5.1% and 2025 average of 5.3% and the 10 year average of 5.7%.
🟥 Stock Levels
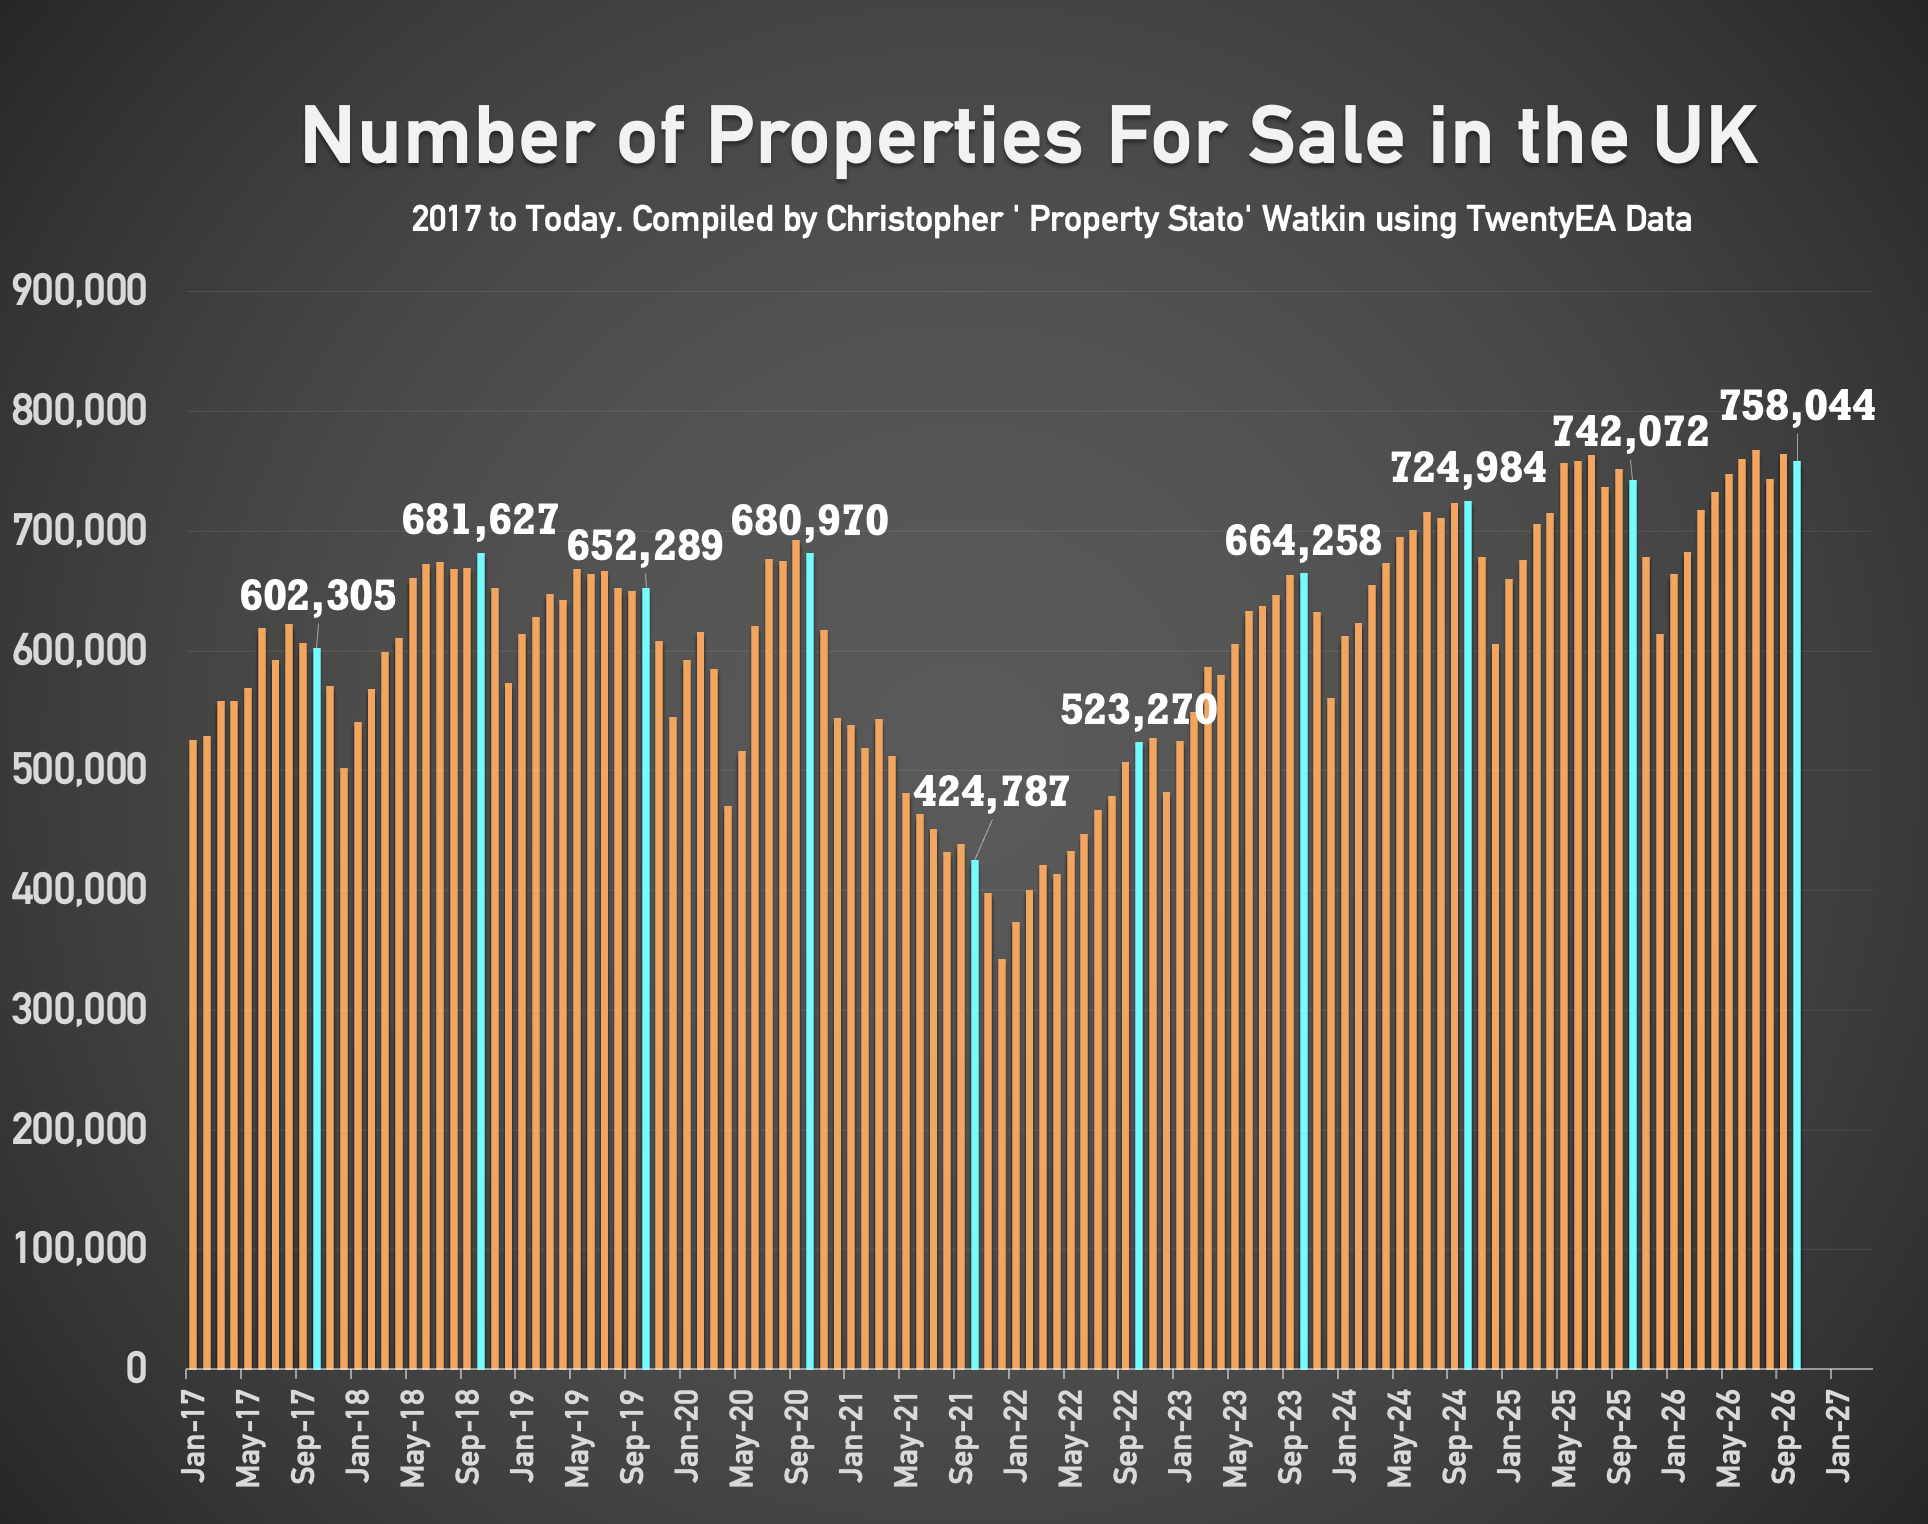
• 758k homes on the market on the 1st of November ’26 (742k in Nov 25, 724k in Nov 24, 664k in Nov 23).
🟥 Transaction Times
• 76 days from Listing to Sale Agreed
• 122 days from Sale Agreed to Completion
(Rolling 12 month stat)
🟥 UK Rental Data
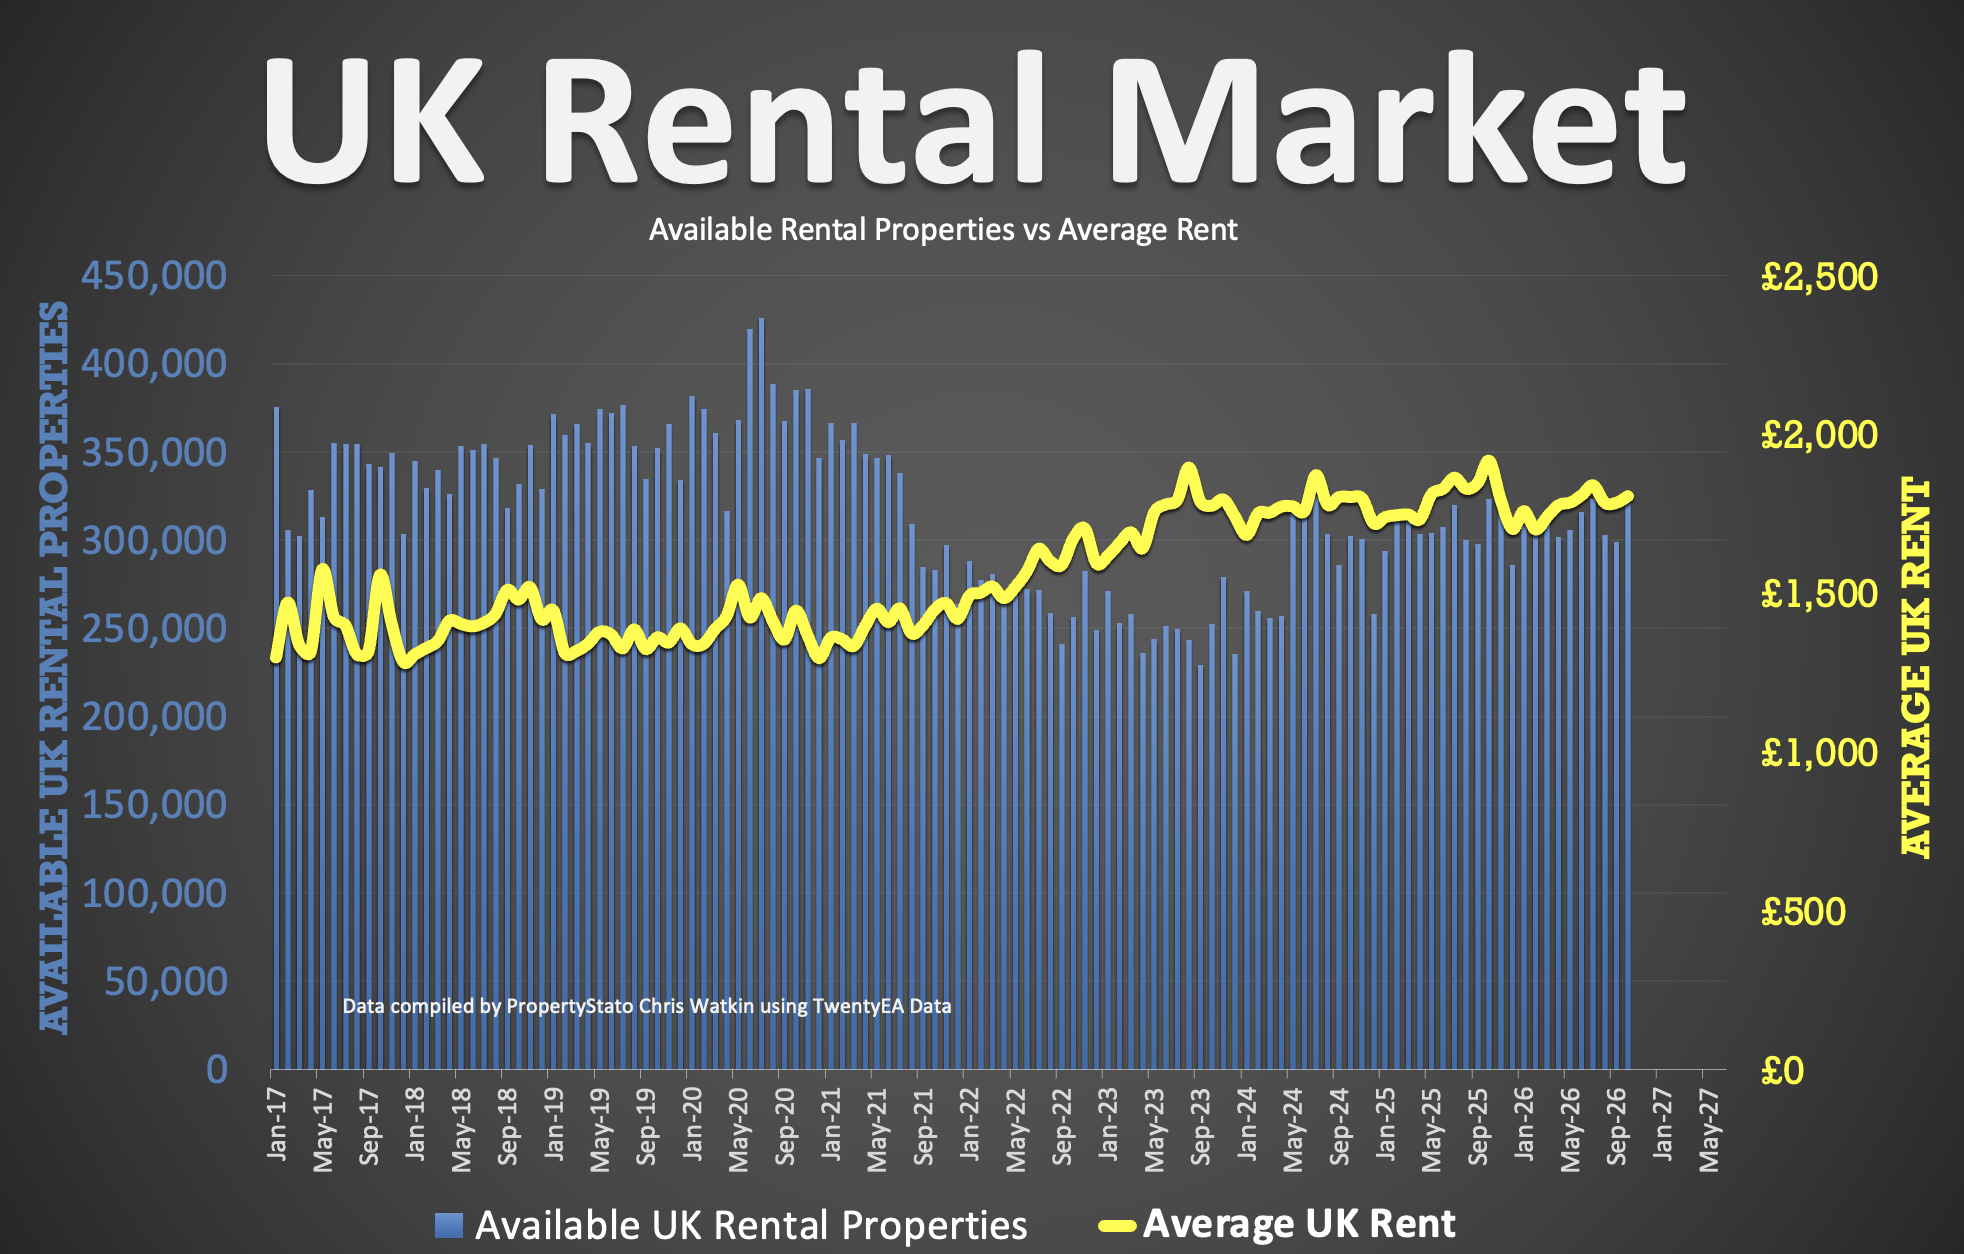
• Average Rent in Wk 44 – £1,858 pcm
• Average Rent in MTD November 2026 – £1,834 pcm
• Average Rent in November 2025– £1,769 pcm
• Average Rent in November 2021 – £1,449 pcm
• Average Rent in YTD 2026 – £1,767 pcm
• 320k UK Rental Stock available to rent on 1st Nov 26 (323k on 1st Nov 2025)
• New Rental Properties coming onto the market in Oct 2026 – 149.7k (153k in Oct 2025 & 116k in Oct 2022).
🟥 House Prices (£/sq.ft)
• Sept ’26 agreed sales averaged £339.07 per sq.ft. 0.8% lower than 12 months ago (£341.95) and 12.5% higher than 6 years ago (£301.40).
The £/sqft at sale agreed matches the HM Land Registry Index with a 98% accuracy, 5 months in advance. That is why it is so important.
🟥 Local Focus this week in the Show
Ipswich






Comments (11)
Harold Evans, the doyen of modern day Editors, famously said the best newspaper was a community talking to itself. I think Robert should be invited as a guest star on Chris’s show! Let’s make it happen. Viewing figures would soar – one statistic we can all agree on!
Lies, damn lies & statistics – the lived experience is very different from these figures – and we have the largest market share in our area, god knows how other agents are paying the bills.
They’re not paying their bills, or they are getting bigger overdrafts, loans or mortgages.
Westmids1 … I do not doubt that trading is tough in your patch, even with the largest market share. National figures cannot describe every local market, and sales activity alone does not tell us how profitable an agency is.
But your experience and these figures can both be accurate. Calling them “lies” because they differ from your local experience does not make them wrong. I would be more than happy to offer my time free of charge to you (becuase you have been bothered to comment) and deep dive an analysis of your market. I wont sell you anything and will not mention my services .. just give you insight and offer my opinions on your agency’s strength’s, weaknesses, threats and the opportunities you might be missing. If your local market tells a different story, let us look at it together. You bring the experience. I will bring the analysis. My offer is there. Question is ………… Will you take it?
Read the room, Chris.
On EYE’s front page right now, your piece sits directly beneath a five-branch agency collapsing after its £665,000 HMRC deal failed. One headline reports an agency gone. The next tells agents the market is not really that bad. You are standing on the beach like Canute, ordering the tide not to come in.
The market is falling away. It always does going into Christmas, and this year it started from a weak position. Six weeks later it is easy to be smart and say the pricing conversation should have happened on day one. Hindsight is easy, agency in this market is hard
This week EYE has also reported an agency collapse owing almost £60,000 with creditors facing losses, agents bracing for a further sales slump with the housing outlook at a three-year low, and agents’ earnings failing to keep pace with inflation.
Hat and Home’s insolvency papers do not say the agency overvalued or cut its fees. They say revenue fell well below forecast from the first months of the rescue deal. The supervisors wrote that down. It is not an excuse.
Yes, some agents overvalue to win instructions. Nobody disputes that. But telling every agent having a bad month that they are in denial, on the day the trade press reports another collapse, is not tough love. The denial is yours.
Buyers are still buying, and agencies are still closing. Both are true. Read the room, and read the article published directly above yours.
“Buyers are still buying, and agencies are still closing. Both are true.”
Agreed. Which is why one agency insolvency cannot, by itself, settle an argument about the wider property market of 14,000 estate agency firms.
I have not claimed Hat and Home overvalued or cut its fees. Neither would I diagnose its failure from a neighbouring headline. You are 1 million percent right to challenge my wording about “every estate agent having a bad month”. That was too sweeping. I will hold my hands up on that.. Good, bad and indifferent performing agents face difficult trading conditions too.
But calling out overvaluing, fee cutting and delayed pricing conversations does not deny those conditions. A difficult market makes those decisions more consequential & advising an honest pricing conversation on day 1 is not hindsight. It is advice given on day 1.
Read the room? Certainly. But the position of two articles on a website is not a market indicator. Challenge the numbers in the show Robert. That would move this debate forward.
It is not one insolvency, Chris. It is a week of them.
In the last few days EYE has reported two agency collapses, a housing outlook at a three-year low and agents’ earnings falling behind inflation. You have taken one sentence of mine and built a defence on it. The evidence is wider than that, and so is the problem.
Here is the number that matters. The average UK transaction price has barely moved since late 2021. Costs have not stood still. At the average price and the average fee, an agent with fewer than 16 listings cannot cover Rightmove’s ARPA. That is not a pricing failure. That is arithmetic.
That agent is your reader. They are not in denial. They are trapped by a cost base they cannot control and a market that will not lift. Telling them (again and again and again) their real problem is overvaluing and fee cutting is not tough love. It is missing the point.
You asked me to challenge the numbers. I will not be scrolling through a show to find them. I will challenge the one you wrote here instead. There are not 14,000 estate agency firms in the UK. The ONS records 22,000. My own count found 35,000, of which 28,000 are identifiable. When the starting figure is out by half, every conclusion built on it is suspect.
Honest pricing on day one is good advice. But EYE’s readers are not a classroom. They are the people keeping this industry running in a brutal market. Pl;ease show some respect to the audience you are being allowed to lecture each week.
I spent 20 years in estate agency and now 15 years helping agents. I totally respect the people keeping chains together, managing frightened sellers & working bl**dy hard without any guarantee of being paid. Difficult trading conditions are real. But you keep presenting my challenges to their business decisions these agents are making as a lack of respect for the people making them. Those are different things.
I am reporting what the U.K. and regional property mkt numbers show and discussing what agents can influence.
I also talk about their marketing to generate valuations. Their skills in winning instructions against inflated promises and cheap fees. Their ability to price properly and get homes sold.
And, crucially, their decision to decide what to charge for their work.
None of that makes agency easy. But joining a chorus of “everything is terrible” gives agents nothing they can use.
You call that preaching. I call it giving agents something more useful than sympathy.
Thank you for your comments
I am not posting this to be confrontational, Chris. I am simply tired of you berating agents who are facing serious financial challenges. Most of them are not doing the things you and your social media bestie accuse them of.
Look at your own numbers, printed in your own article, no video required.
Net sales are 6.6% below last year. Sell-through is 13.4% against a pre-Covid 15.5%. Fall-throughs are at 27.4% against a decade average of 24.5%. Only 51.5% of homes leaving agents’ books exchanged in October, against a seven-year average of 57.6%. Stock is 758k, the highest November figure you quote. Price reductions are running at 13.1% against a long-term 11%. Every one of those is worse than normal. That is not agents hiding behind headlines. That is the market your data describes.
Your own figures are not clean either. 51.5% exchanged and 49.5% withdrew. That is 101%. Your listings are “0.1% below 2025” while the number you give is higher than 2025’s. If you want agents to trust the numbers, the numbers need to add up.
By your own account, you have not been an agent for fifteen years. The agents you are lecturing are working this market right now.
Then there is the tone. Your article says agents make “excuses”, “hide behind headlines” and need to be told what is “REALLY happening”. You have admitted the “every agent having a bad month” line went too far. Respect is not something you claim in a comment. It is in how you write the piece.
Agents can see it. The only other agent who commented called your figures lies, damn lies and statistics, and they hold the largest market share in their area. The collapse story above yours has been read more than twice as often.
Every week it is the same. A lecture. A sermon. A telling. You ask busy agents to spend their time on a wall of stats that does not scan, and then spend more of it watching your YouTube show.
That is not challenge. It is promotion. Agents deserve better than being the audience for it.
Personally, I would like to see some of that editorial space given to the agents being troubled by parasitic third parties scraping their listings. There is genuine disquiet among agents about it. It is being overlooked, and it cannot be aired because no one is covering the story.
PS to EYE: logging in (again) to reply to a comment should not take this much effort, and the login does not even last two hours. If you want people to comment, make it easier to join.
Robert, you have quoted my own published figures back to me as though I was concealing them. I published them precisely because agents deserve the full picture. Good, bad and indifferent. Measuring market in the whole of thhe UK & activity in it gives us something beyond individual opinions of one agent and their experiences.
A market can be tougher than 2024/25 and still offer opportunities. Reporting difficult conditions & challenging business decisions that agents make are entirely consistent.
Now, the figures … you are correct about the two errors. They were typos as I was doing it late Wednesday night, and I will arrange their correction for next week. Also, I have also accepted that my “every agent” wording was too sweeping. I am sorry to anyone I offended.
But come on RM, readership comparisons betwen the number of people who have read one article over a another & repeated references to when I last worked in agency do nothing to establish whether my analysis is right.
I 100% recognise the pressure agents face. They cannot control the economy, yet they can improve their marketing, develop the skills to win instructions against inflated overvaluations and cheap fees, price honestly and her eis the big bit …… decide what fee to charge. Those decisions become more important when trading gets harder.
I respect agents enough to believe they can handle difficult figures and the blunt & direct difficult questions I ask of them. You (or anyone else) do not have to like my tone yet disliking how I say it does not prove that what I am saying is wrong on either the direction of UK property market or how estate agents can be more successful in such a market.
PS why dont you send editorial to PIE about the topics you mentioned ?? You are really good at your pieces on Linkedin, and whilst we dont always agree, I will always say you are passionate about what you say and you deserve a wider audience (for anyone reading this – do follow Robert on Linkedin. You might or might not agree with him, but he does craft some interesting & insight posts/articles
Fair reply, Chris. Correcting the figures and apologising for the wording is the right call, and it does not always happen online. I respect it.
But I did not quote your figures as though you were hiding them. I quoted them because they contradict you. Your article opens with sarcasm aimed at anyone who does not share your view. The market is “apparently at death’s door”. “Someone might want to tell the buyers.” “Doom. Gloom.” Then it publishes numbers that justify the very criticism you mock. Net sales are down. Sell-through is down. Fall-throughs are up. Withdrawals are up. Stock is the highest you quote. You have corrected two typos. You have not answered what the rest of your numbers say.
One more thing I will not let pass. Your article did not ask agents questions. It TOLD them they were making excuses and hiding behind headlines. That is criticism, and calling it questions now does not change what was written.
Agents can handle blunt questions. Most of them are already asking their own. Where is the money coming from? Why won’t they exchange? Where is the money coming from? This market is answering them hard. We can leave it there.
On the editorial, thank you, but no. From early 2014 I put a great deal of work into this community and into supporting this site. In May 2019 one of my suppliers made a minor- macro error on a Friday afternoon, on a beta site. It was apparent by Saturday morning and corrected as soon as the new data came in on Monday morning. For 48 hours it affected no one at all. At 6.30 that Monday morning this site ran it as a headline story. It was known to be nothing at all before it was published. That story cost me an investor and £420,000. It cost me respect, and someone I had trusted as a friend. Five people lost their jobs. Four of them had joined me from unemployment. I did not pursue damages. The setback taught me how disingenuous and greedy people can be, and how little loyalty counts for when a headline is on offer.
My commentary here is worth more than any article. It is twelve years of it, often outspoken, always written in public under my own name, never behind a moniker, and before anyone knew how things would turn out. In almost every case it has turned out to be right. It all sits on this site as a library, a drawer of receipts anyone can open. That record is my integrity, and it does not need an editor.