

 March 2026 marks a decade since the ‘second home’ stamp duty surcharge transformed the economics of investing in residential property. Introduced on 1 April 2016 for additional property purchases in England and Scotland, the measure signalled a clear shift in the tax treatment of owner-occupiers and property investors.
Initially set at an additional 3% on top of standard rates in England, the surcharge has since risen to 5% following changes introduced in October 2024. Similar measures apply elsewhere in the UK, with a 5% surcharge in Wales, while the equivalent charge in Scotland has increased to 8%.
Chart 1 – Share of households renting privately in Great Britain
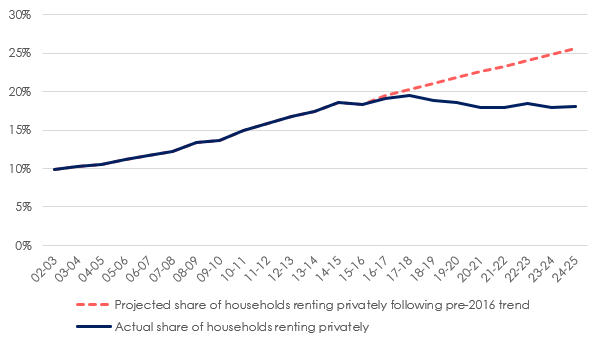
Source: Hamptons & ONS
What changed – and why it mattered
The surcharge dramatically increased the cost of purchasing an investment property. Today, a £350,000 buy-to-let in England attracts a £25,000 stamp duty bill for an investor, compared with £7,500 for a mover and £2,500 for a first-time buyer.
By design, the policy tilted the market away from landlords. But despite accounting for a smaller share of all transactions, by the 2024/25 tax year, surcharge payers accounted for 48% of all residential stamp duty revenue.
A decade on: 2.2 million ‘missing’ rental homes
These higher taxes, alongside other regulatory and demographic changes, had a profound effect on the size of the private rented sector. Our analysis suggests that had the private rented sector continued to grow at pre-2016 rates, there would be an additional 2.2 million households renting privately across Great Britain. Instead, the number of rented households has effectively plateaued.
Despite demand rising with population growth, only around 5.2 million households rent privately today, compared with the 7.4 million that might have been expected had pre-surcharge trends continued.
Proportionally, this means 18% of households now rent – far from the 25.6% that would have mirrored the 1960s-style levels implied by earlier growth rates (chart 1).
The surcharge achieved its core objective: fewer purchases by investors. But fewer landlord purchases, combined with some investors choosing to sell, have resulted in 25.4% fewer homes available to rent in February 2026 than in February 2016.
Investor activity falls as taxes rise
In the 12 months before the 3% stamp duty surcharge was initially introduced in England and Scotland on 1 April 2016, investors rushed to beat the deadline, with 16.5% of homes bought by landlords, above the previous five-year average of 14.5% (chart 2, chart 3, table 1).
Chart 2 – Share of homes bought by a landlord
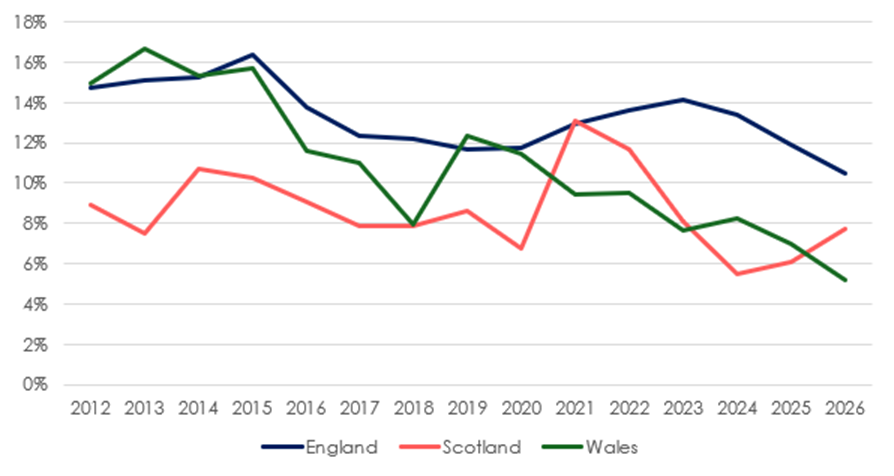
Source: Hamptons
However, in the decade since the surcharge was introduced, the average share of purchases made by landlords has fallen to 11.8%, reaching a low of 10.8% so far in 2026, following the 2024 surcharge increase from 3% to 5% (chart 3, table 1). The share of purchases bought by landlords has also fallen after subsequent stamp duty surcharge hikes across England, Scotland and Wales.
Chart 3 – Landlord purchases before and after stamp duty surcharge changes
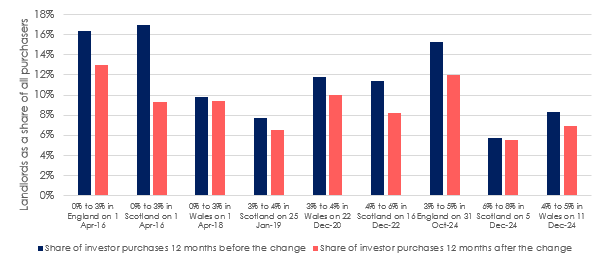
Source: Hamptons
This decline in investor appetite has had several knock-on effects – not only for tenants and rental affordability, but also for housebuilding investors, who have traditionally helped de‑risk development schemes by buying off‑plan.
Table 1 – Share of homes bought by an investor
| 12 months prior to the surcharge | 2026 | Change | |
| London | 16.4% | 8.5% | -7.9% |
| South East | 15.1% | 10.5% | -4.6% |
| South West | 14.7% | 7.3% | -7.4% |
| East of England | 14.6% | 8.1% | -6.5% |
| East Midlands | 18.1% | 15.3% | -2.8% |
| West Midlands | 21.2% | 14.6% | -6.6% |
| North East | 23.3% | 29.2% | 5.9% |
| North West | 16.9% | 13.4% | -3.5% |
| Yorkshire & Humber | 15.7% | 13.8% | -1.9% |
| Scotland | 17.0% | 6.1% | -4.1% |
| Wales | 15.7% | 7.0% | -8.7% |
| GB | 16.5% | 10.8% | –5.7% |
Source: Hamptons
Tighter rental supply pushes rents above inflation
For long-term tenants and those unable or unwilling to buy, the surcharge has been less favourable. Rents across Great Britain have risen 44.1% over the last decade, outpacing CPI inflation, which rose at 39.9% over the same period.
Rents have risen by an average of 4.0% a year since the surcharge was introduced, up from 3.0% during the five preceding years. This suggests the surcharge has added around 1% to annual rental growth over the last decade – equivalent to an additional £70 per month.
First-time buyers are the main beneficiaries – but not all have gained
First-time buyers have been the main beneficiaries of the second home stamp duty surcharge. They now make up a record share of purchasers and are significantly less likely to find themselves competing with a landlord.
Table 2 – Share of offers made by first-time buyers where an investor is also bidding
| 12 months prior to the surcharge | 2026 | Change | |
| London | 38% | 21% | -17% |
| South East | 28% | 15% | -13% |
| South West | 22% | 10% | -12% |
| Eastern | 29% | 18% | -11% |
| East Midlands | 26% | 22% | -4% |
| West Midlands | 22% | 22% | 0% |
| North East | 17% | 17% | 0% |
| North West | 18% | 24% | 6% |
| Yorkshire & Humber | 23% | 26% | 3% |
| Scotland | 15% | 18% | 3% |
| Wales | 9% | 13% | 4% |
| GB | 26% | 19% | -7% |
Source: Hamptons
In the 12 months before the surcharge was introduced, more than a quarter (26%) of first-time buyers faced competition from an investor when submitting an offer (table 2). Today, that figure has fallen to less than a fifth (19%), reflecting both fewer investor purchases and the rising first-time buyer demand.
This reduction in competition has been most pronounced across the South of England, particularly in London and the South East.
But in more affordable regions – the North West, Yorkshire & Humber, Scotland and Wales – competition from landlords has increased as investors have gravitated towards higher‑yield, lower‑cost markets (table 2).
This is also reflected in bidding behaviour. In the 12 months running up to the surcharge’s introduction, the average investor offer was 0.8% below the average first-time buyer offer. Today, higher tax bills mean the average investor bid is 2% below that of a first-time buyer, as investors struggle to make deals stack up.
Around three-quarters of the “missing” rented homes – roughly 1.4 million – are now lived in by owner-occupiers, broadly matching the government’s figures for growth in homeownership over the same period.
However, the surcharge has also likely suppressed housebuilding. The remaining 25% of ‘lost’ homes (around 800,000 properties) have not been built.
These are new units that might previously have been purchased by investors, often one to two years off-plan, which significantly helps with the developers’ cash flow.
Rental growth picks up again
Annual rental growth for newly let homes moved back into positive territory for the first time since June 2025. Newly agreed rents in Great Britain rose 0.6% year-on-year to £1,368 per month (table 3), ending a seven-month run of annual declines.
Unlike in 2025, rental growth has been led by London, where 13 consecutive months of falling rents came to an end in February. Rents in the capital rose 1.0% over the last 12 months, driven by Inner London, where rents increased 2.6% year-on-year (table 3).
Table 3 – Annual rental growth by region in the year to January 2026
| Region | New lets | Renewals | ||
| Average monthly rent | YoY % | Average monthly rent | YoY % | |
| Greater London | £2,294 | 1.0% | £2,179 | -2.3% |
| Inner London | £2,749 | 2.6% | £2,636 | -4.3% |
| Outer London | £1,959 | -0.6% | £1,843 | -0.2% |
| South | £1,338 | -0.5% | £1,278 | 4.7% |
| East of England | £1,260 | 0.5% | £1,247 | 4.6% |
| South East | £1,445 | -1.4% | £1,369 | 4.7% |
| South West | £1,254 | 0.0% | £1,172 | 4.7% |
| Midlands | £1,042 | 1.8% | £974 | 4.4% |
| East Midlands | £992 | 1.6% | £936 | 4.6% |
| West Midlands | £1,085 | 2.0% | £1,008 | 4.2% |
| North | £957 | 1.0% | £896 | 5.4% |
| North East | £832 | 1.4% | £780 | 3.9% |
| North West | £1,032 | 2.2% | £928 | 6.4% |
| Yorkshire & The Humber | £912 | -1.0% | £905 | 4.6% |
| Wales | £873 | 0.0% | £821 | 2.1% |
| Scotland | £1,023 | 2.7% | £929 | 5.8% |
| Great Britain | £1,368 | 0.6% | £1,295 | 2.2% |
| Great Britain (Exc London) | £1,131 | 0.3% | £1,069 | 4.7% |
Source: Hamptons
This marks the first time in 27 months that rental growth in the capital (+1.0%) has outpaced growth outside London (+0.3%). Back in October 2023, London rents were close to rising at a double-digit pace (+9.6%) compared with 8.0% elsewhere.
Rental supply in the capital remains tight. The number of homes on the market in London is down 42.4% compared with the same period 10 years ago, exceeding the 25.4% fall recorded nationally. Outer London has seen an even larger fall of 50.7%.
Annual rental growth picked up across the country. Growth in the three northern regions returned to 1.0% for the first time since June 2025, while annual growth in the two Midlands regions returned to its highest level since August 2025.
Meanwhile, the average rent paid by a tenant renewing a contract rose 2.2% over the last 12 months, the slowest pace since September 2021, when renewals rose 1.6%. Over the last five years, the cost of renewing a contract has risen 24.7%.
Aneisha Beveridge, Head of Research at Hamptons, said: “Higher rates of stamp duty for anyone buying a second home have broadly delivered what the government of the day set out to achieve. Almost overnight, the market tilted away from investors, meaning far fewer homes have been added to the rented sector and more have found their way into owner-occupation over the last decade.
“However, large stamp duty bills have also brought side effects, particularly as the wider tax and regulatory environment for landlords has tightened. Tenants who can’t afford to buy, or don’t want to, have seen rents rise faster than inflation, while those on the margins of the market have found it increasingly difficult to find somewhere to rent in the first place.
“Domestic and international landlords were once some of the biggest buyers of city centre flats. Prior to 2016, housebuilders often had waiting lists of investors, sometimes years before they even put a spade in the ground. Their partial withdrawal has reduced viability and slowed the pace of housebuilding, particularly in the new-build apartment sector, where sales are now taking longer and often completing at lower prices.
“With D-Day for the Renters’ Rights Act now less than 50 days away, rental growth has started to creep up. But awareness of the many upcoming changes remains relatively low among landlords, and so far there have been few signs that landlords are looking to push up rents specifically ahead of 1 May. Whether the Renters’ Rights Act proves to be inflationary for rents will ultimately depend on how well it works in practise for landlords.”