

 Savills has produced new research that could serve as valuable marketing material for estate agents operating in the listed areas – provided they are comfortable citing a rival company.
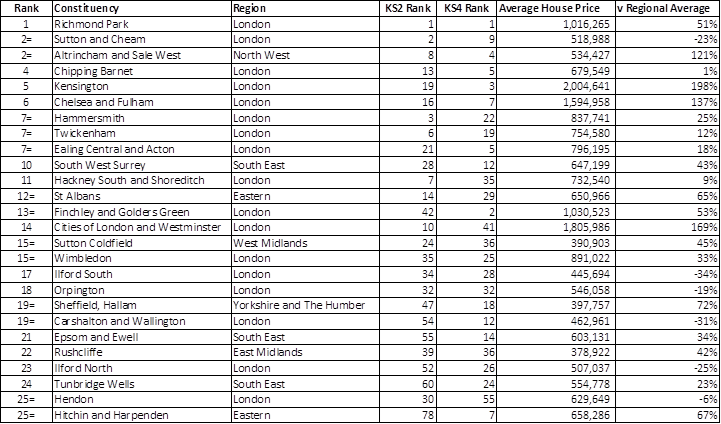
The latest study carried out by Savills reveals the best places to live for access to high-performing schools across England.
The research shows that by these measures over two thirds (68%) of parliamentary constituencies in the top 20% are located in London and the South East.
On this basis alone, access to high-quality state education often comes with a house price premium. But even after adjusting for regional differences in house prices, homes in the top 10% of areas for school performance still command a significant premium, of +28%, according to Savills
| Average House Price | V Regional Average | |
| Top 10% | 695,018 | +28% |
| 10% to 20% | 484,811 | +13% |
| 20% to 30% | 423,640 | +15% |
| 30% to 40% | 349,904 | +1% |
| 40% to 50% | 335,027 | +1% |
| 50% to 60% | 307,873 | -3% |
| 60% to 70% | 255,955 | -12% |
| 70% to 80% | 284,446 | -7% |
| 80% to 90% | 261,639 | -12% |
| Bottom 10% | 240,485 | -22% |
| Grand Total | 363,916 | n/a |
Source: Savills Research
“There is a well-established link between house prices and access to high-performing schools. Families often judge the desirability of an area by the reputation of its schools, based on a on a long-term perception of track record, and are willing to pay more to live in the associated catchment areas,” said Lucian Cook, head of residential research at Savills.
“This is likely to become more pronounced with the rise of private school fees. Although we haven’t seen a mass exodus from the private sector, there is likely to be a steady rise in families looking to access the best state schools over time, putting further pressure on surrounding home values.”
Source: Savills Research
Regional hotspots
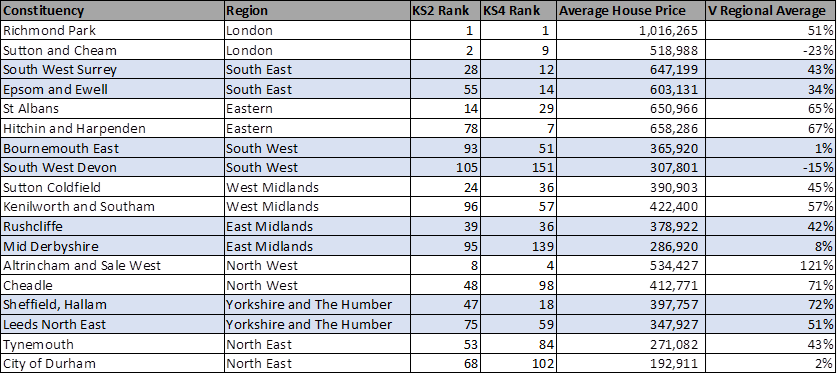
Source: Savills Research
*Methodology
Savills analysis looked at the average Key Stage 2 and Key Stage 4 (GCSE-level) results from the Department for Education (DfE), for all students living in each constituency, which provides a general picture of how well students are doing academically in each area.
Secondly, Savills looked at the proportion of primary or secondary schools in each area that rank in the top 20% nationally, and subtracted the proportion in the bottom 20%. This indicates whether a local area is more likely to have access to high-performing schools, without the risk of securing a place at a lower-performing one.
| Key Stage 2 | Key Stage 4 | ||||
| % KS2 at Expected | % KS2 at High | KS2 top – bottom 20% | KS4 Attainment | KS4 top – bottom 20% | |
| Top 10% | 72% | 13.4% | +34% | 55 | +52% |
| 10% to 20% | 68% | 11.1% | +20% | 52 | +31% |
| 20% to 30% | 65% | 9.4% | +11% | 49 | +16% |
| 30% to 40% | 63% | 8.0% | +3% | 48 | +7% |
| 40% to 50% | 63% | 7.8% | +1% | 47 | -3% |
| 50% to 60% | 61% | 7.3% | -8% | 46 | -7% |
| 60% to 70% | 60% | 6.5% | -7% | 45 | -16% |
| 70% to 80% | 58% | 6.0% | -14% | 44 | -20% |
| 80% to 90% | 57% | 5.3% | -18% | 42 | -32% |
| Bottom 10% | 54% | 4.5% | -28% | 40 | -52% |
Source: Savills Research
Comments are closed.