 The UK property market has spent much of 2026 looking weaker than last year, but the latest figures suggest the gap may finally be narrowing.
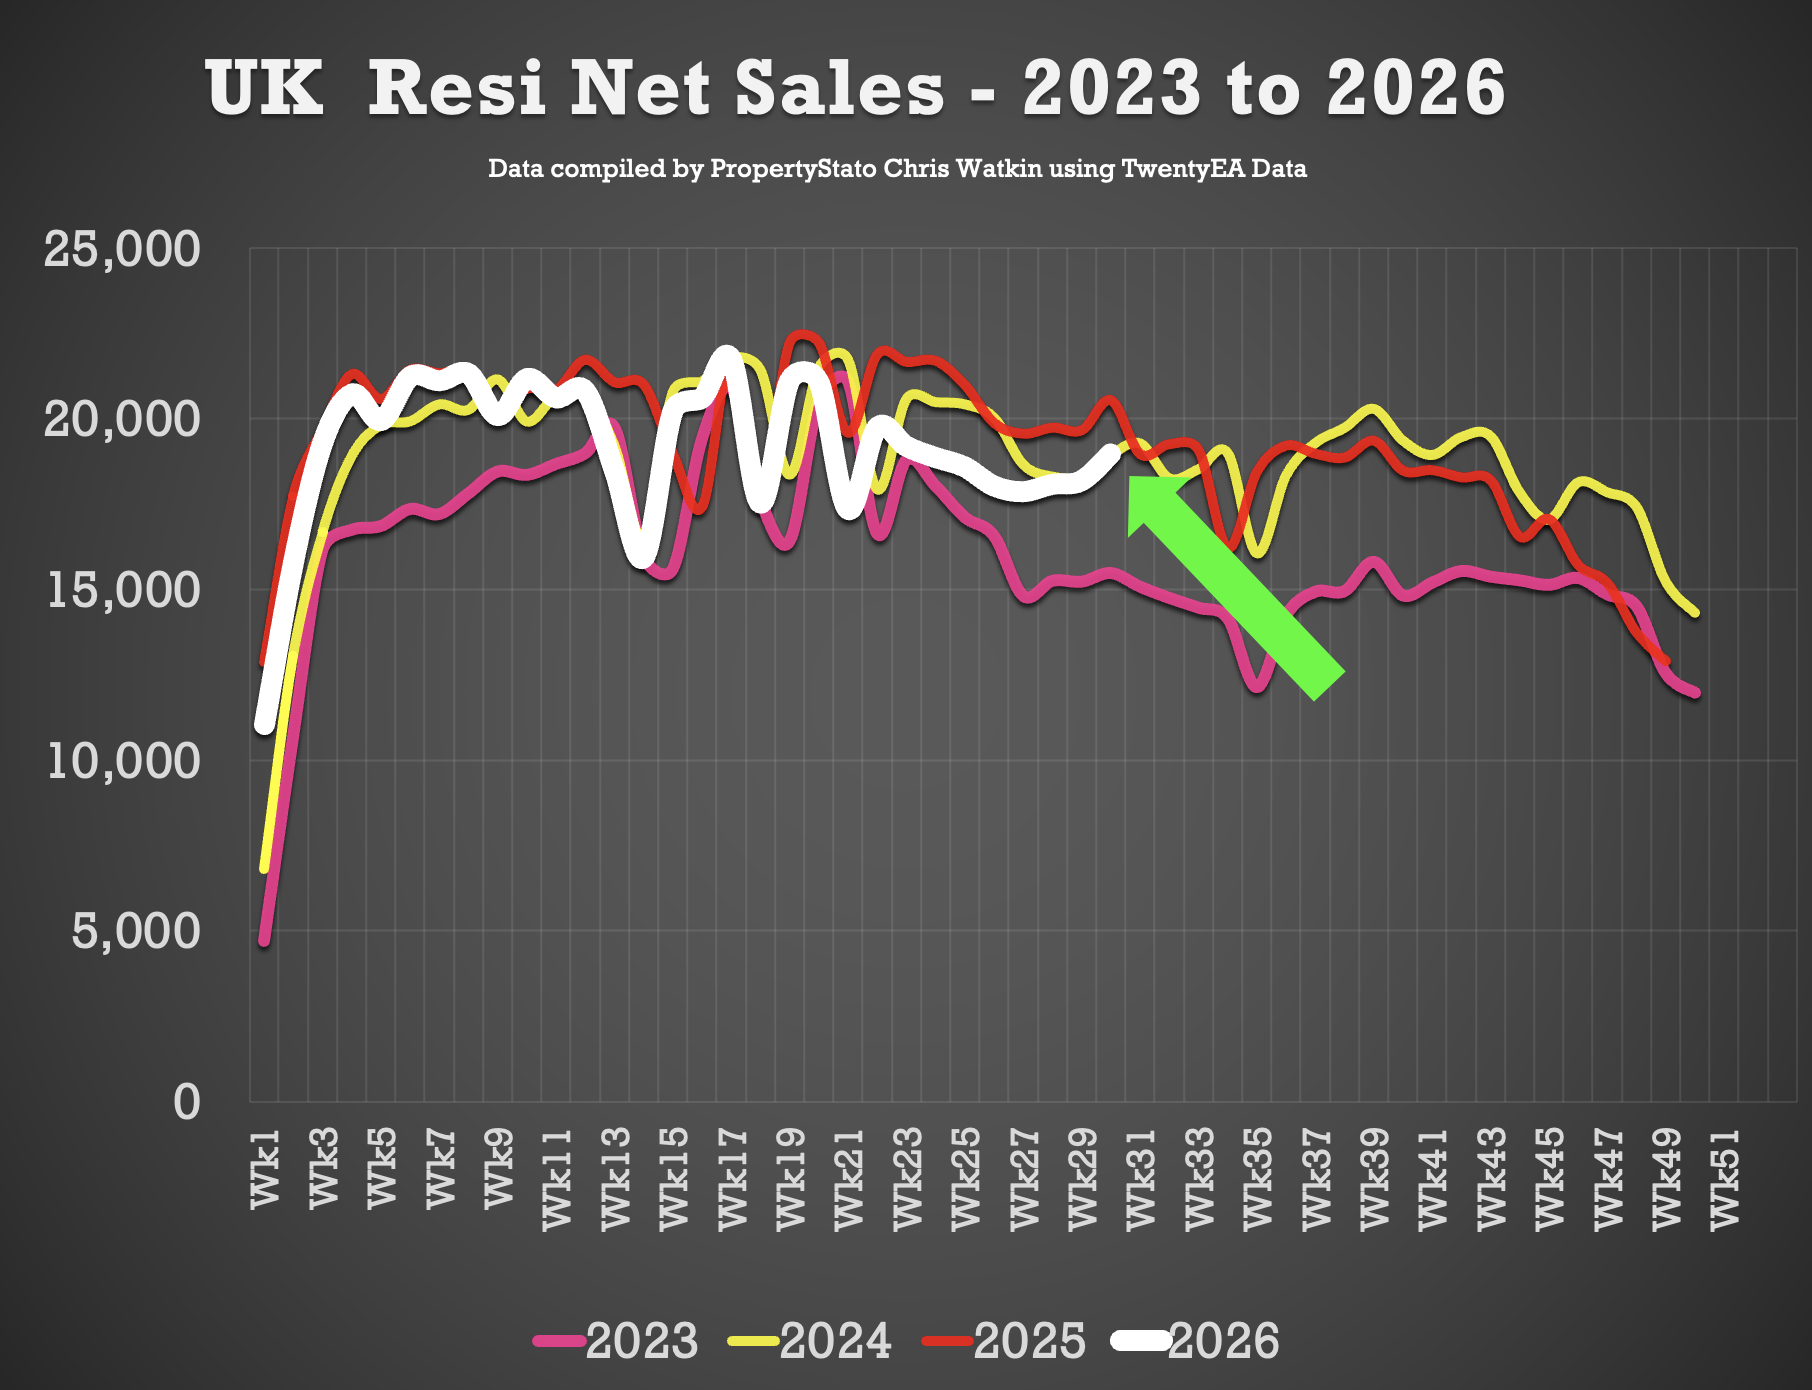
In Week 30, 24.7k homes sold subject to contract, net sales moved back in line with 2024, and July appears to have delivered a noticeably stronger finish than many expected.
Is it too early to declare a Burnham Bounce?
Yet after a difficult late spring and early summer, there are some signs that the market has found a little momentum. Don’t get me wrong, it’s tough out there, yet the data, the cold hard data, shows something is doing OK. What do you think?
This week, I am joined by property economist Adam Lawrence from Properomics to dig beneath the headlines and examine what is really happening with listings, price reductions, sales, fall-throughs, exchanges and stock levels.
We also head to Maidstone for a detailed review of its estate and letting agents, revealing the huge differences in market share, pricing strategy, fall-through rates and the chances of a homeowner actually reaching exchange and completion.
The main stats for UK property market stats for week 30, week ending 2nd August 2026.
Listings
Week 30
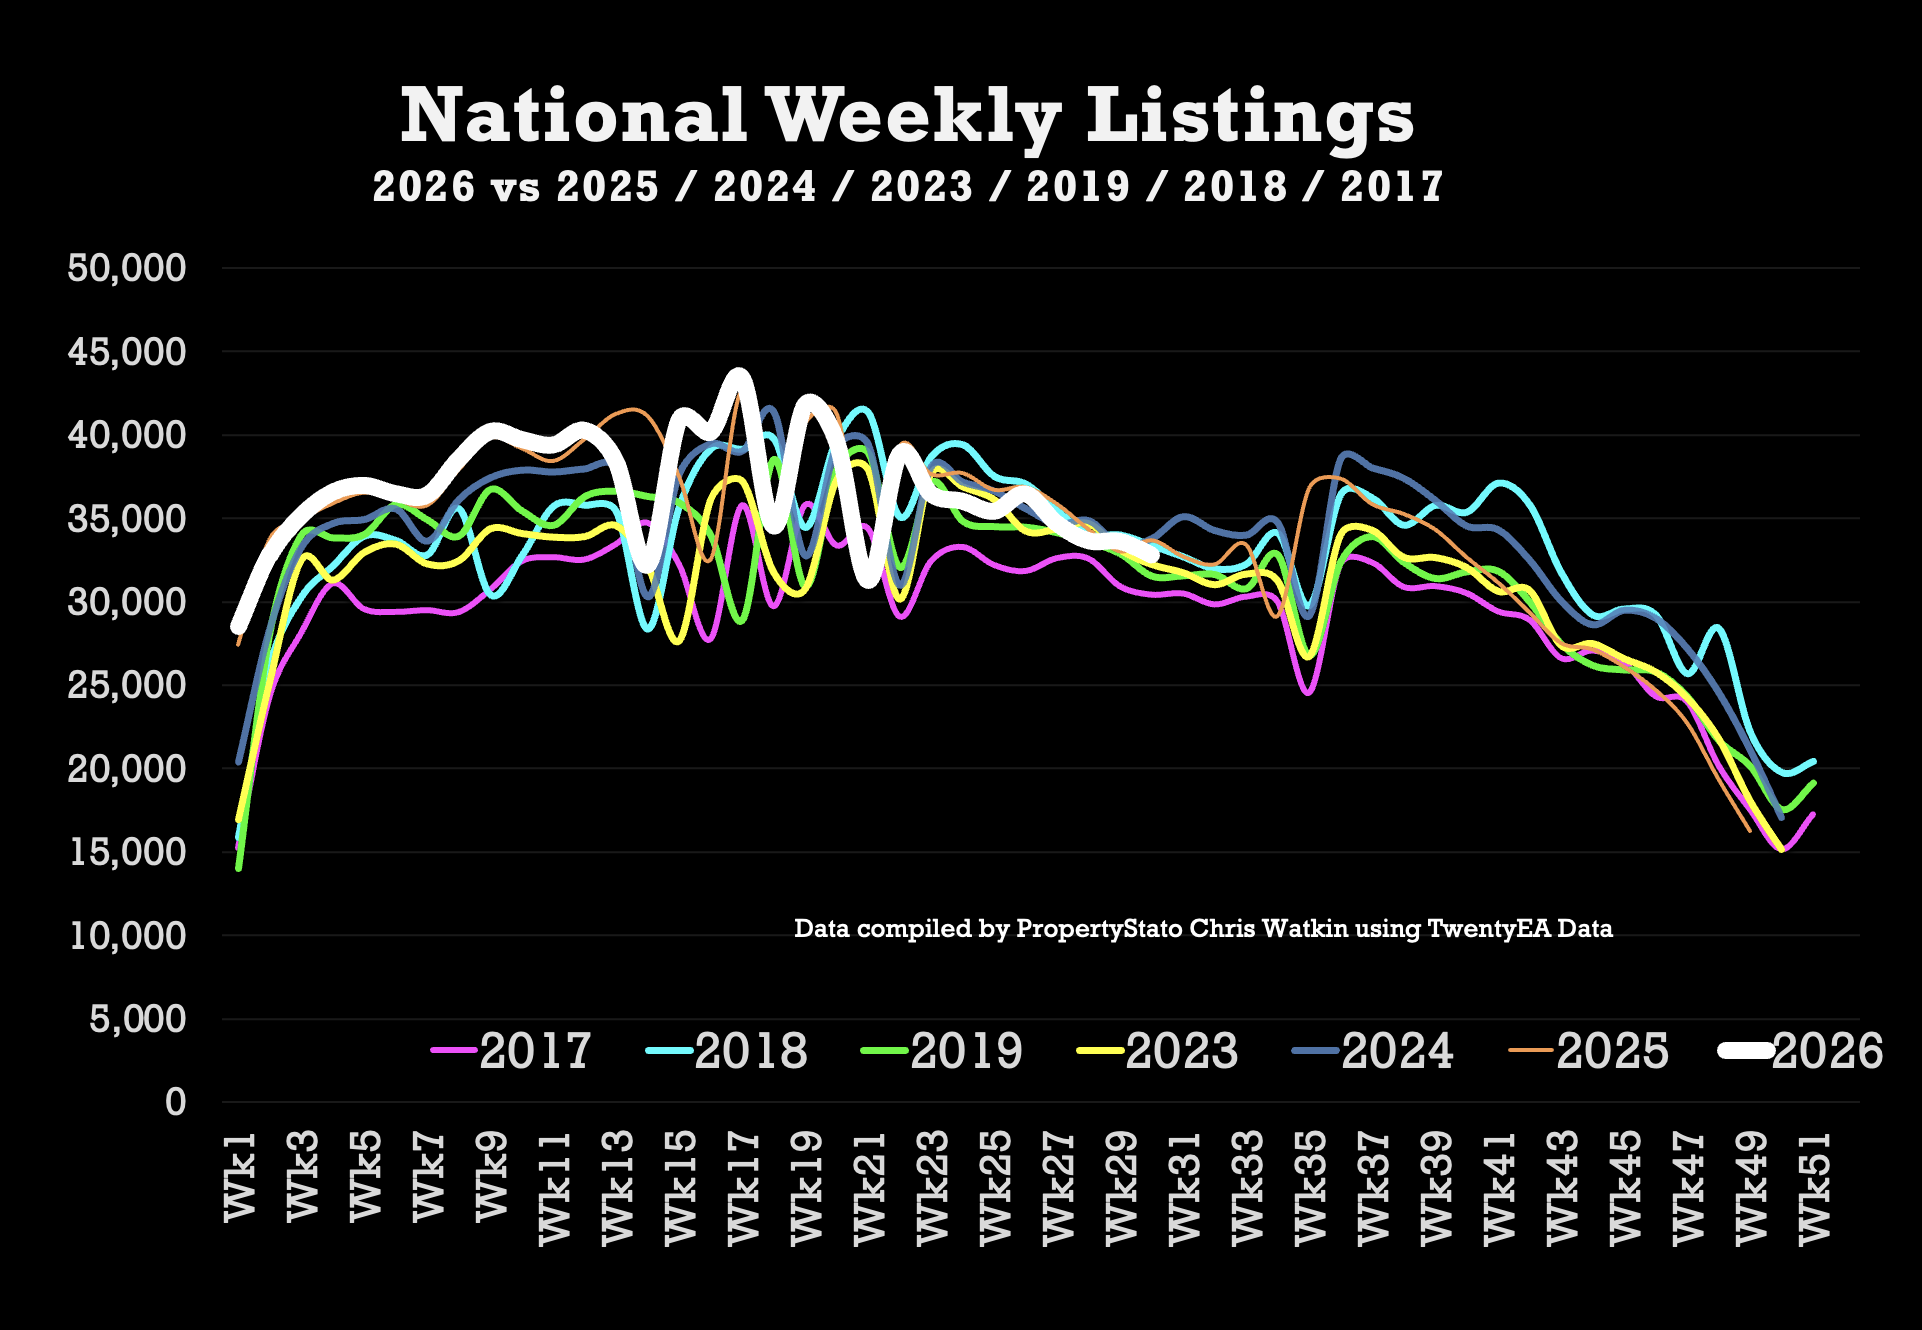
32.8k new listings this week (33.6k last week)
Weekly 2026 average: 36.7k
10 year week 30 average: 33.8k
Year to Date
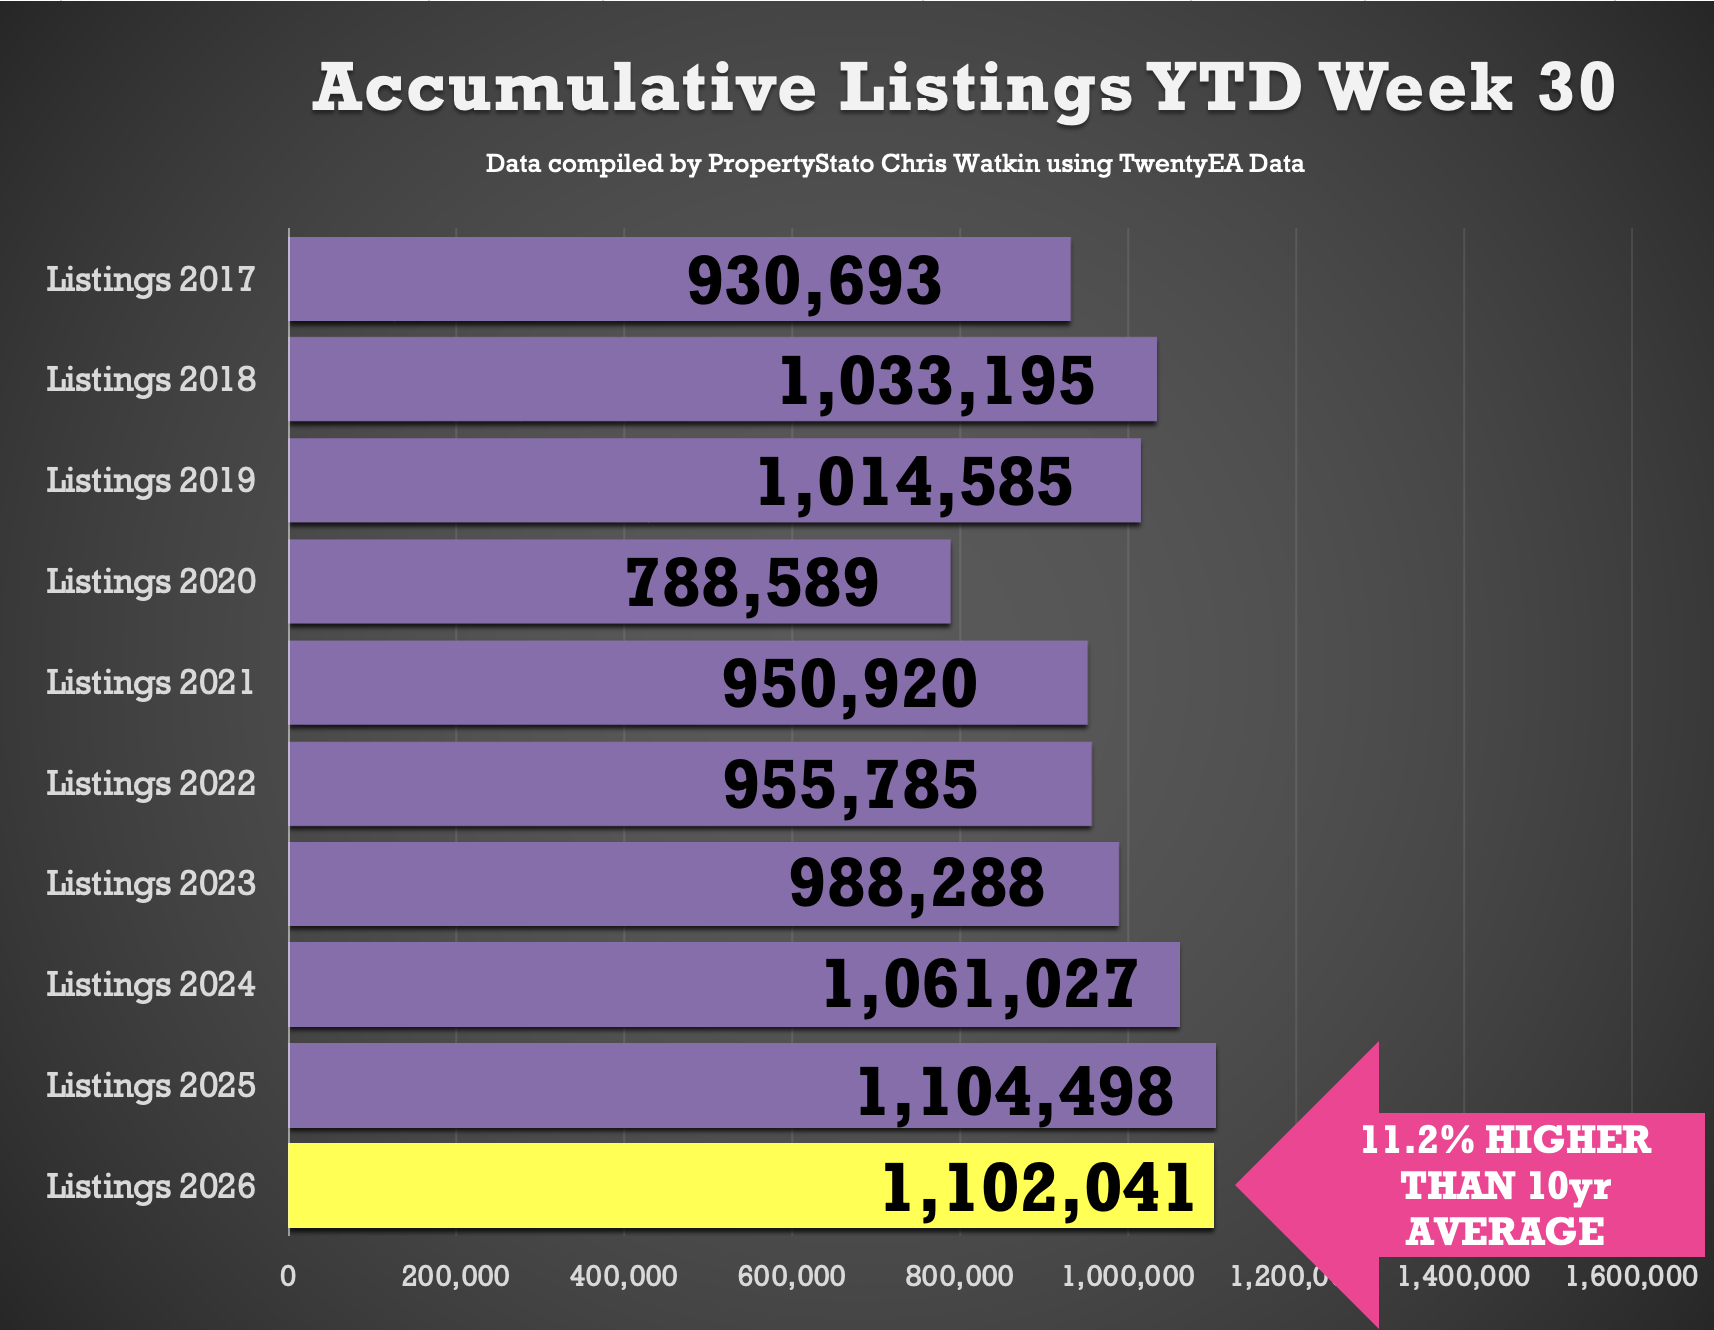
1.102m new listings YTD
0.2% lower than 2025 YTD (1.104m)
3.9% ahead of 2024 YTD (1.061m)
11% higher than the 2017-19 average YTD (988k) 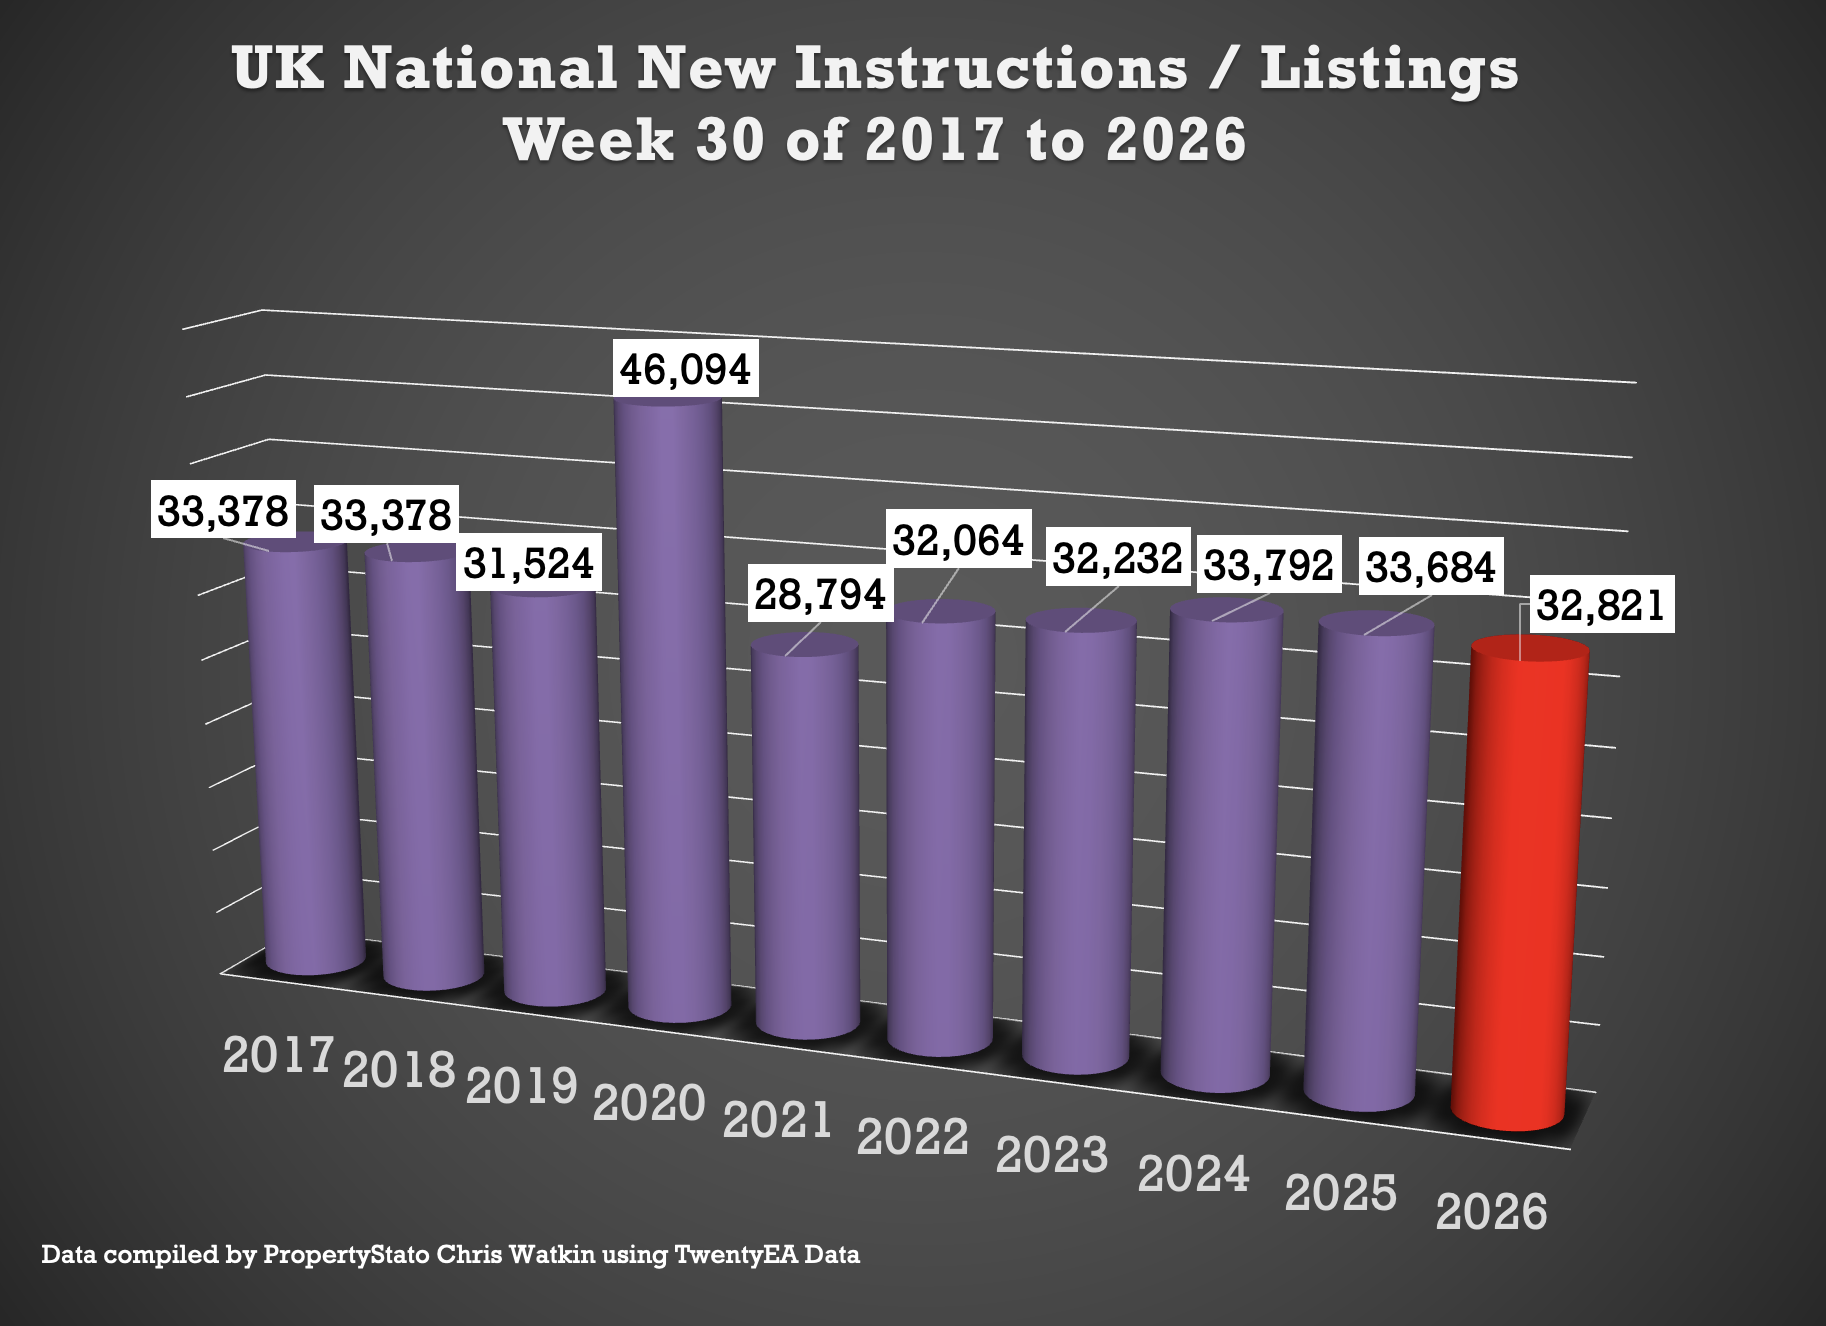
UK Gross Resi Sales
Week 30
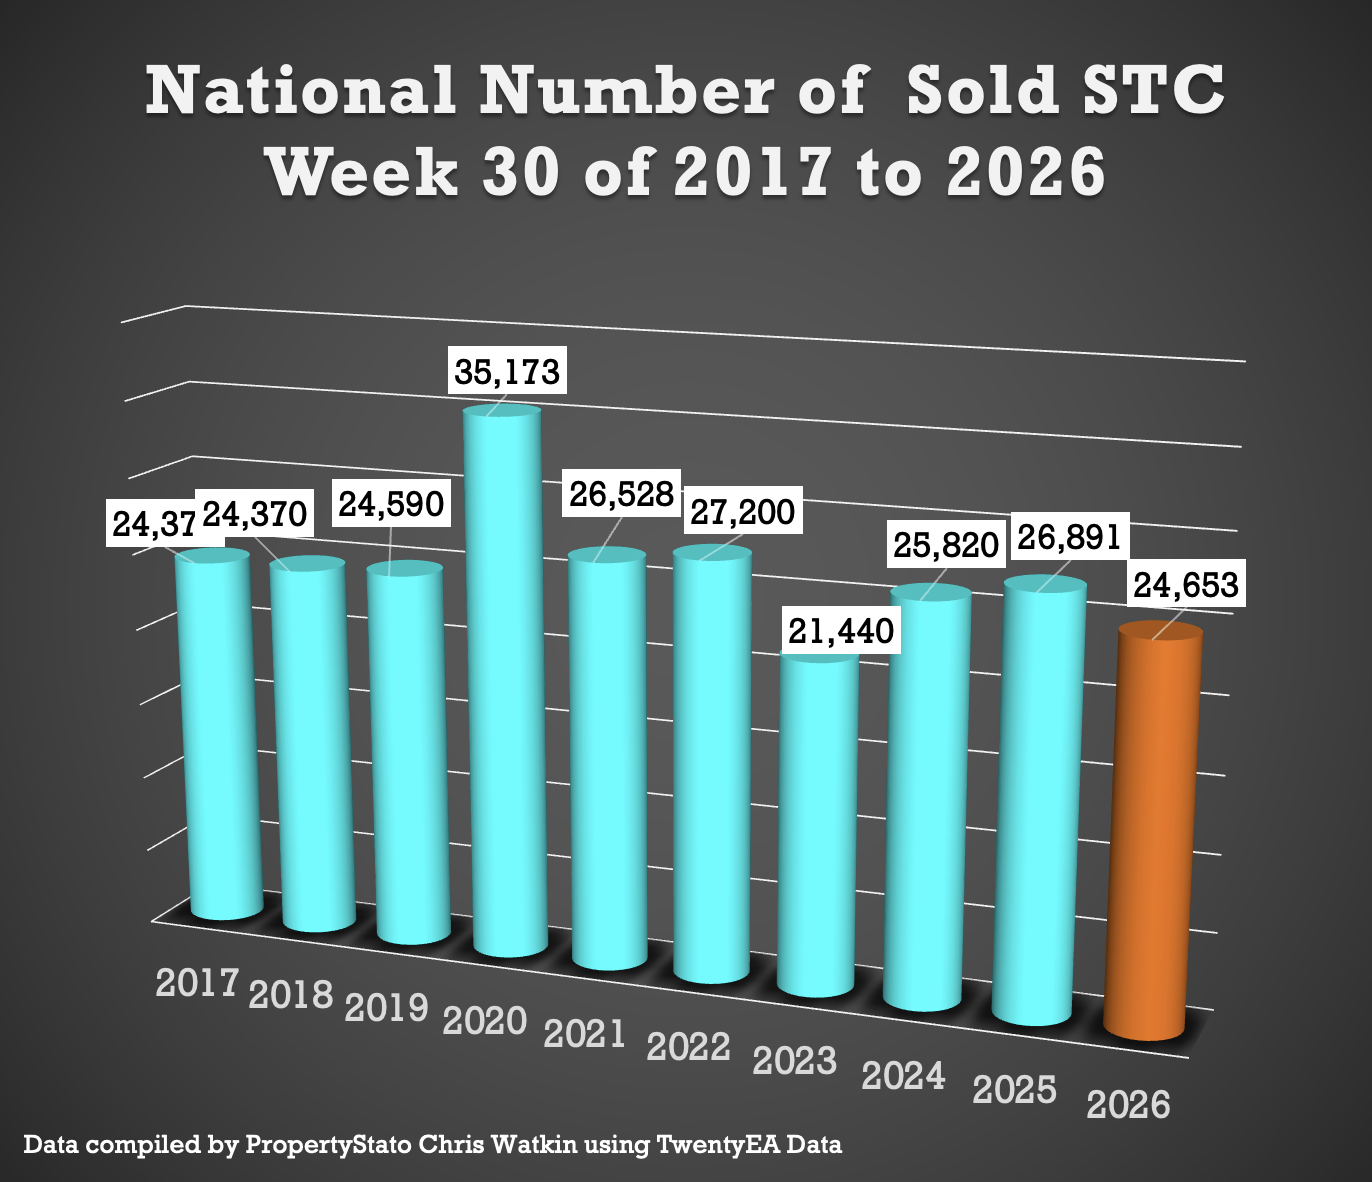
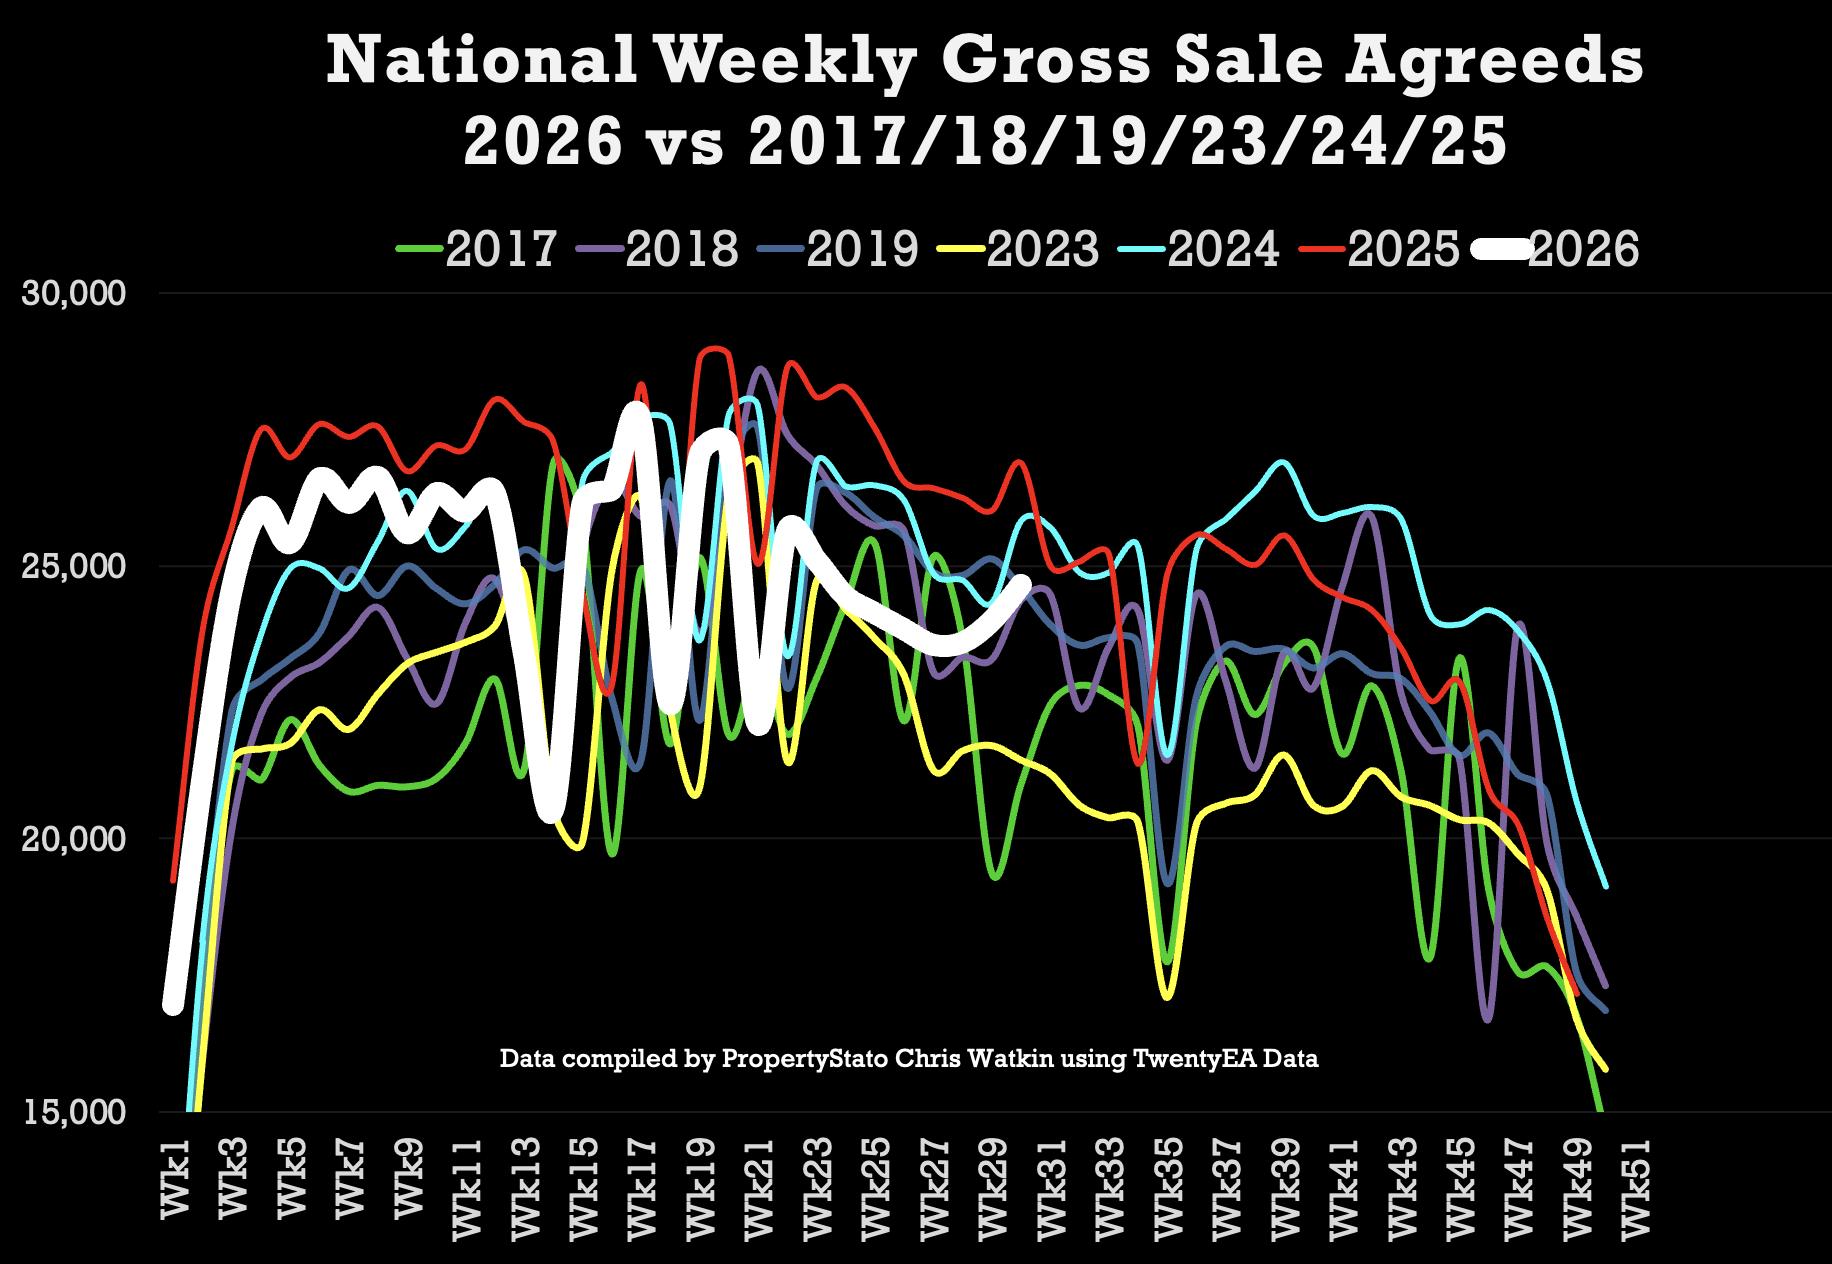
24.7k homes sold STC this week 30 (24k last week)
10 year week 30 average: 26.1k
2026 weekly average: 24.6k
Year to Date for house sales
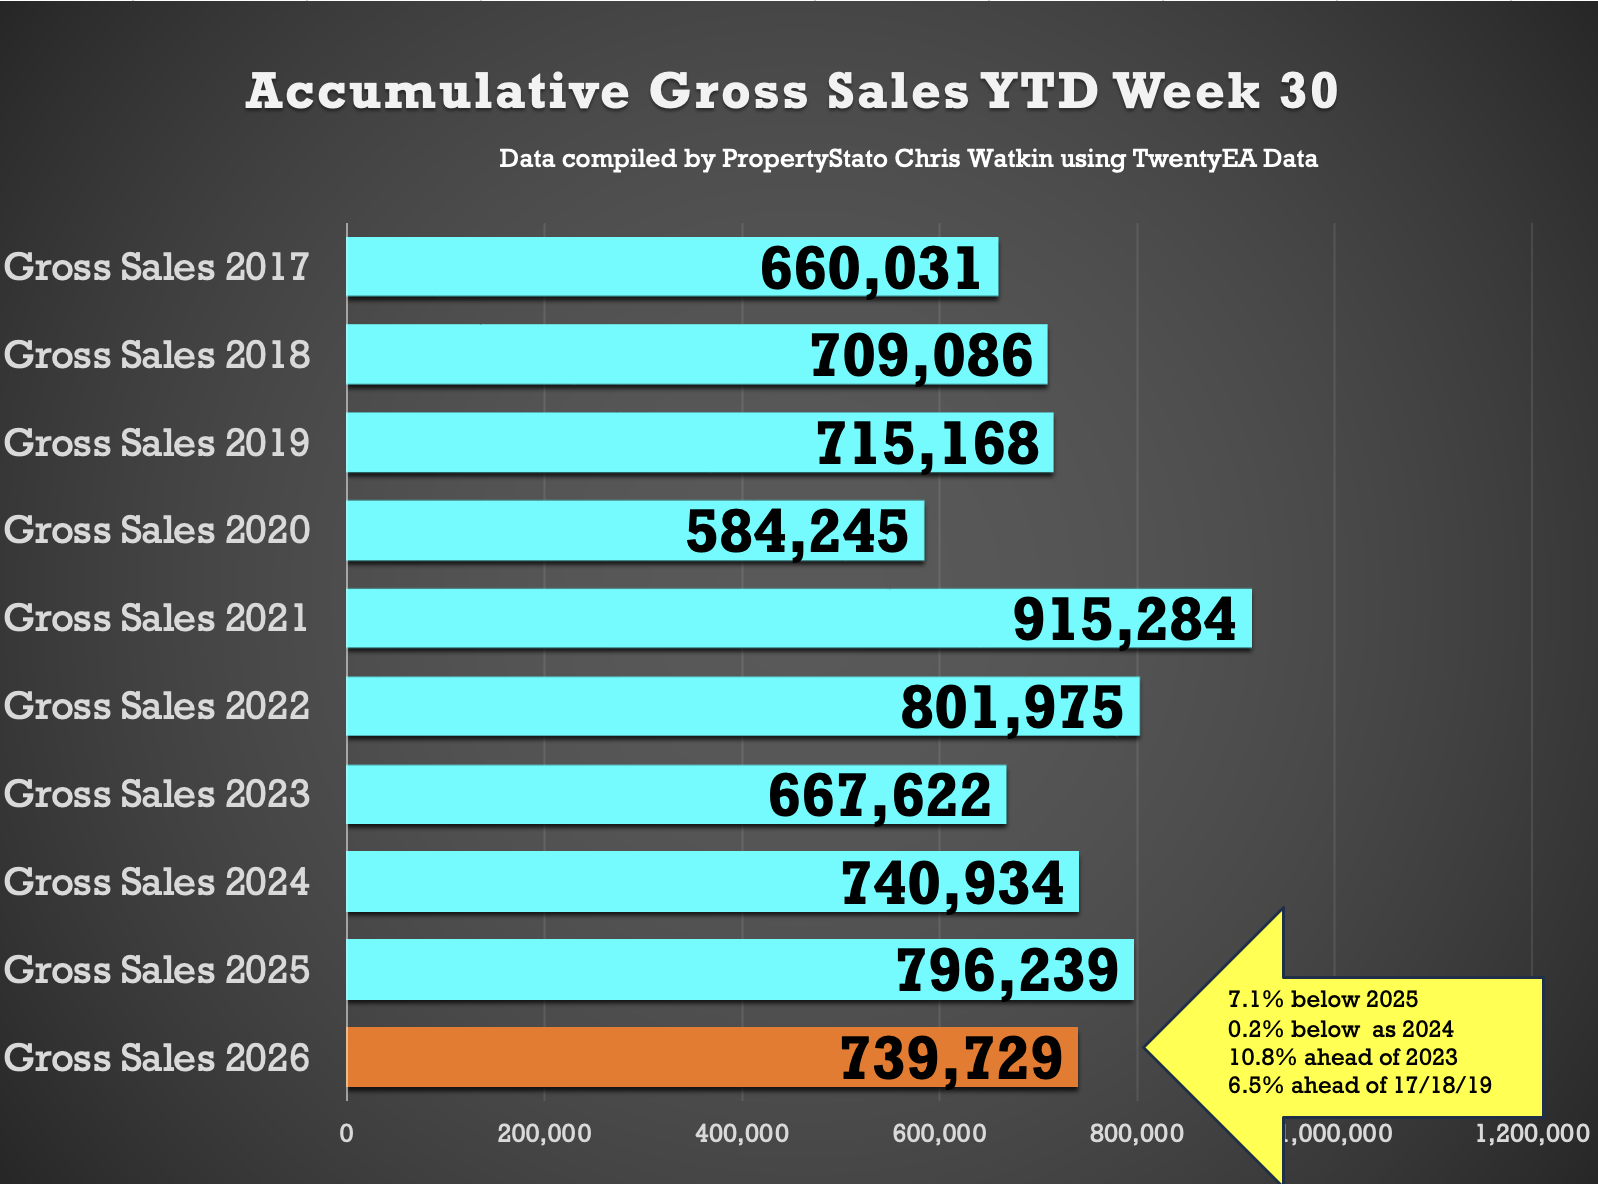
740k UK homes sold STC YTD
7.1% lower than 2025 YTD (796k)
Yet still Gross Sales YTD are still…
0.2% lower to 2024 YTD (741k)
10.8% higher than 2023 YTD (668k)
6.5% higher above pre Covid 2017-19 years (733k)
Decade average – 733k YTD
UK Net Resi Sales YTD
(Net Sales being Gross Sales less Sale Fall Throughs).
Week 30
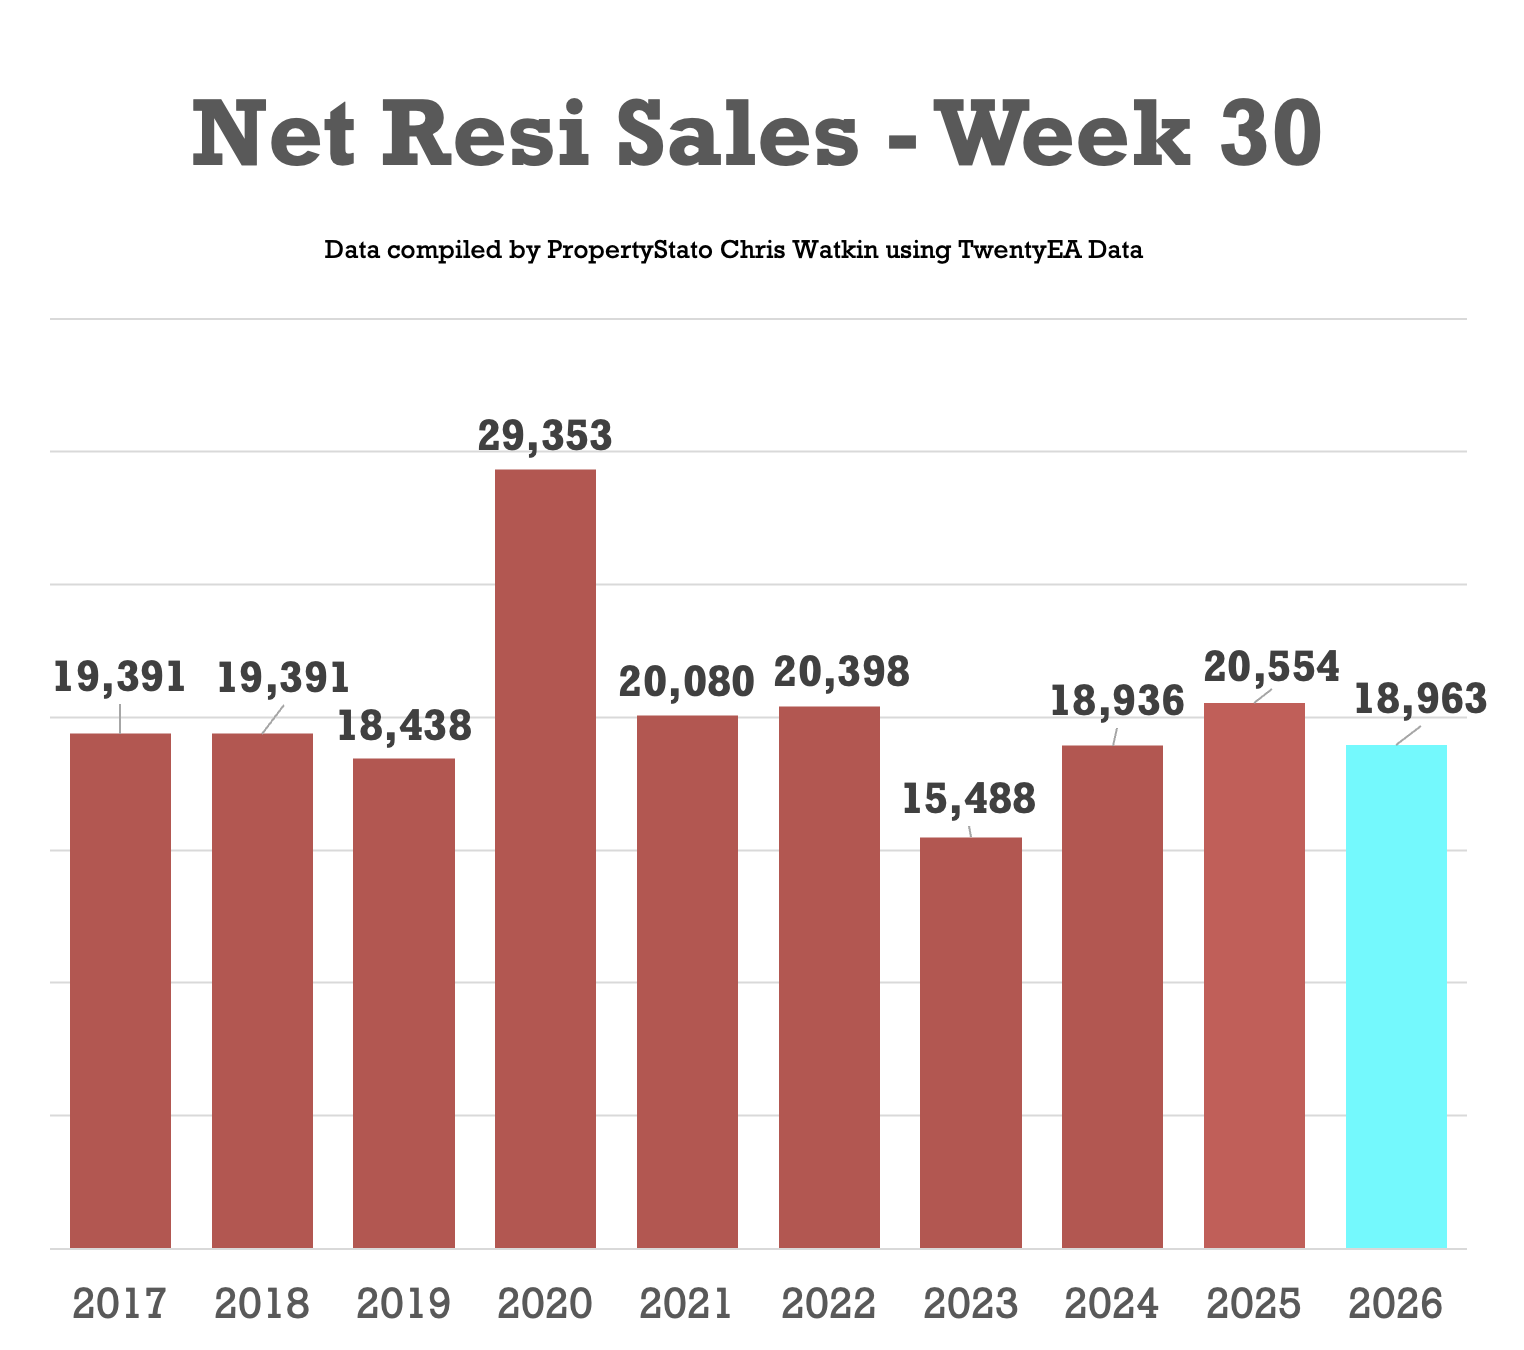
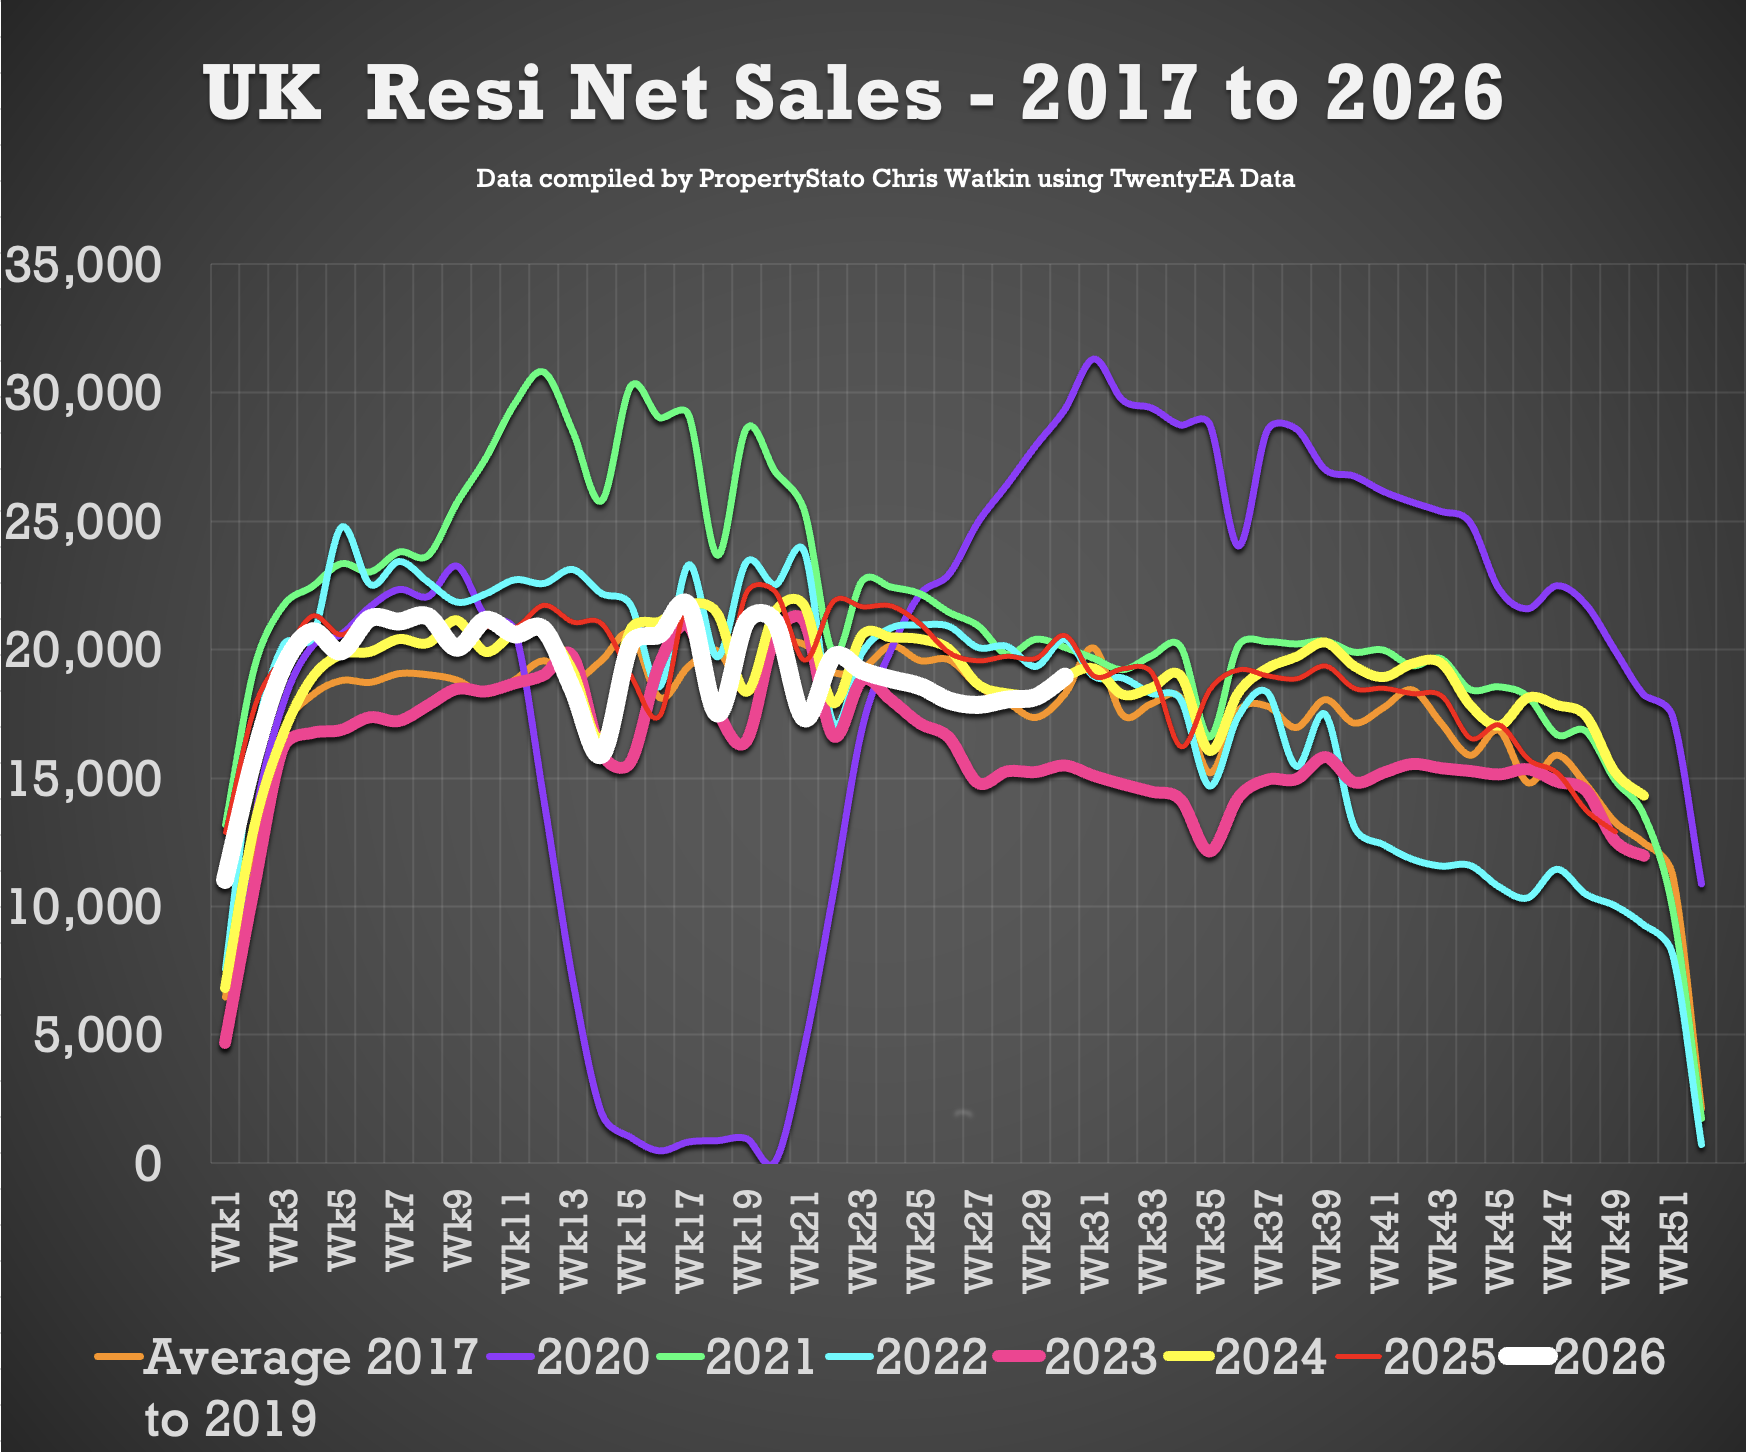
19k Net Sales (18.2k last week)
10 year Week 30 average: 20.1k
Weekly average for 2026: 19.2k
Year to Date
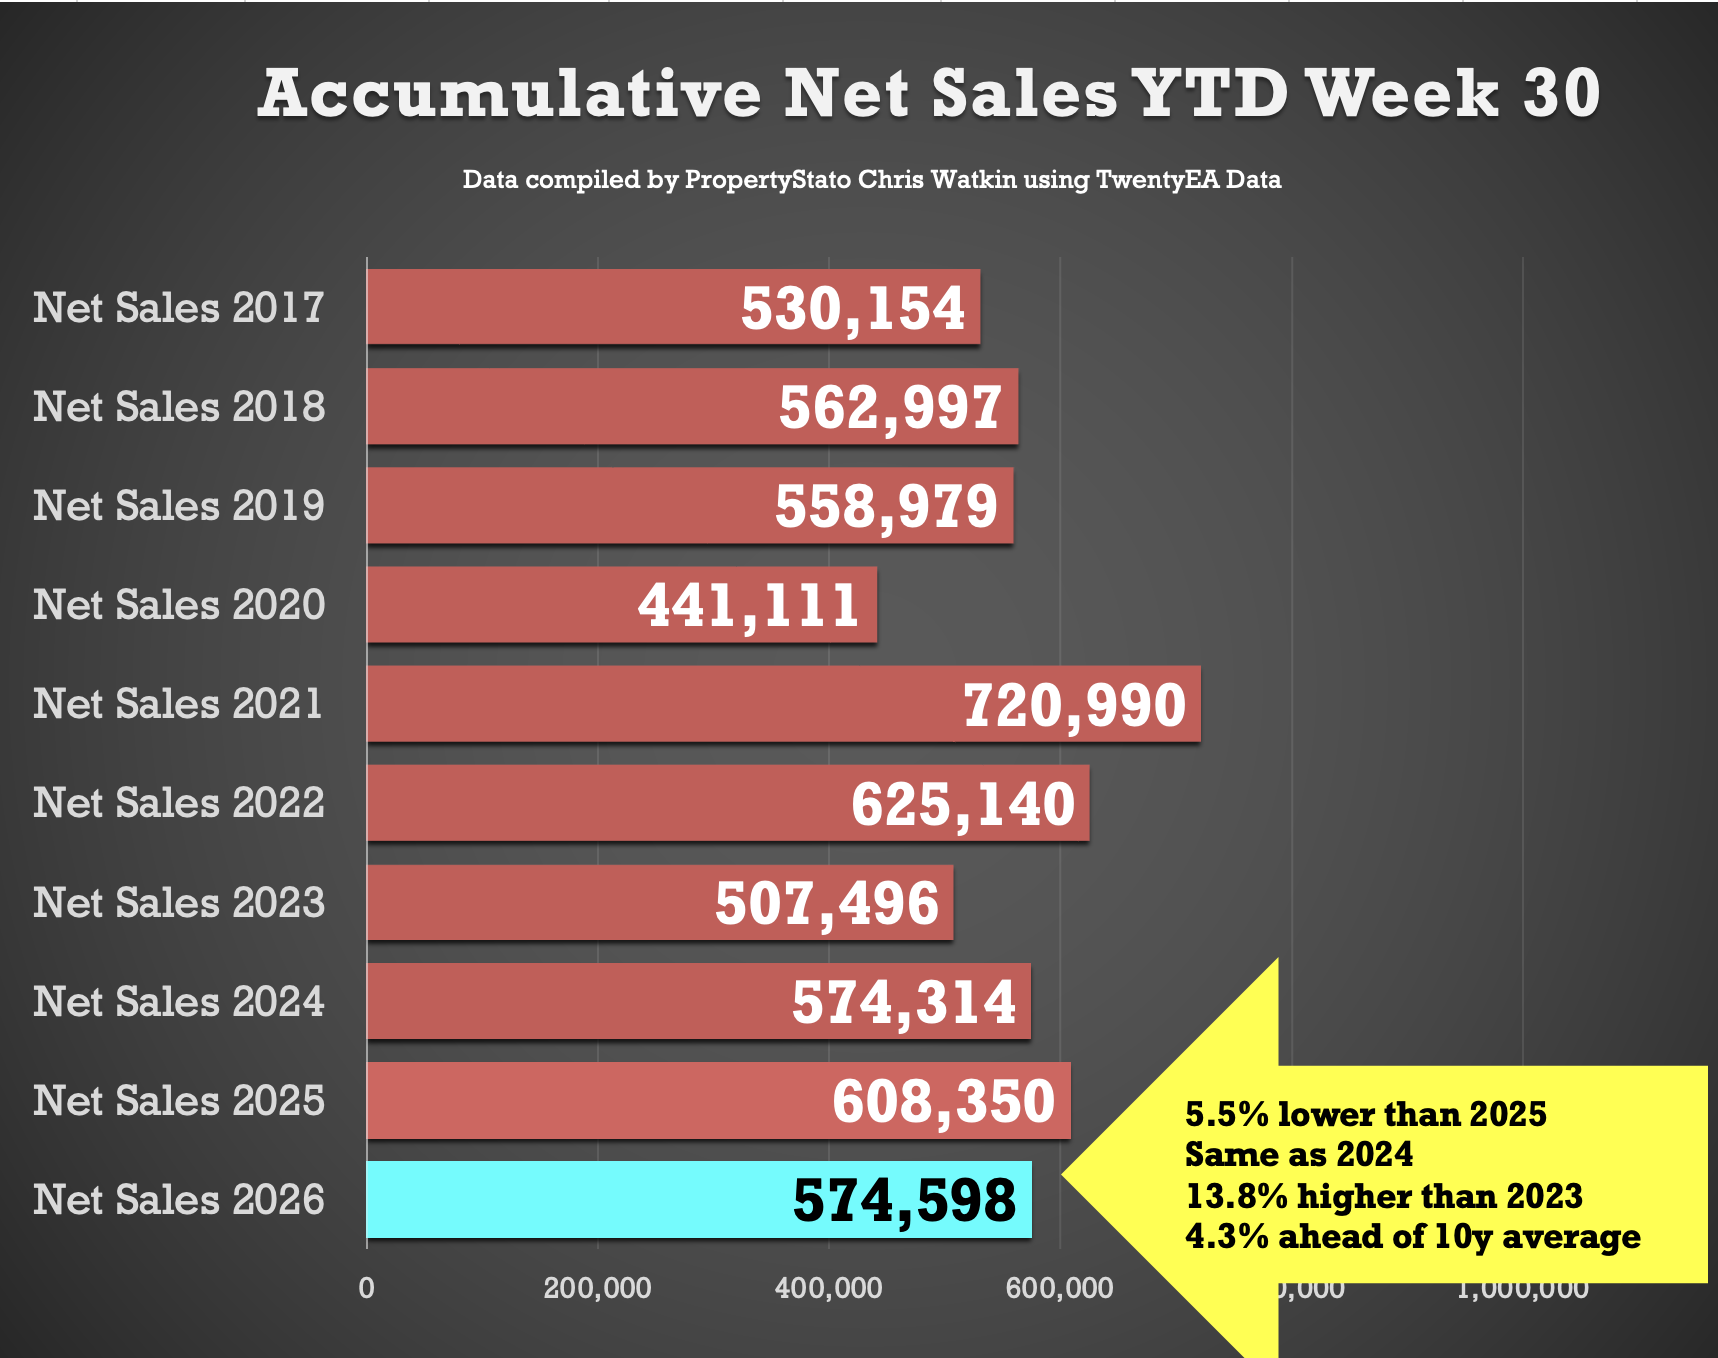
575k UK net home sales YTD
5.5% lower than 2025 (608k)
Same as 2024
13.2% ahead of 2023 (507k)
4.3% above the 2017-19 average (551k)
Exchanges & Withdrawals
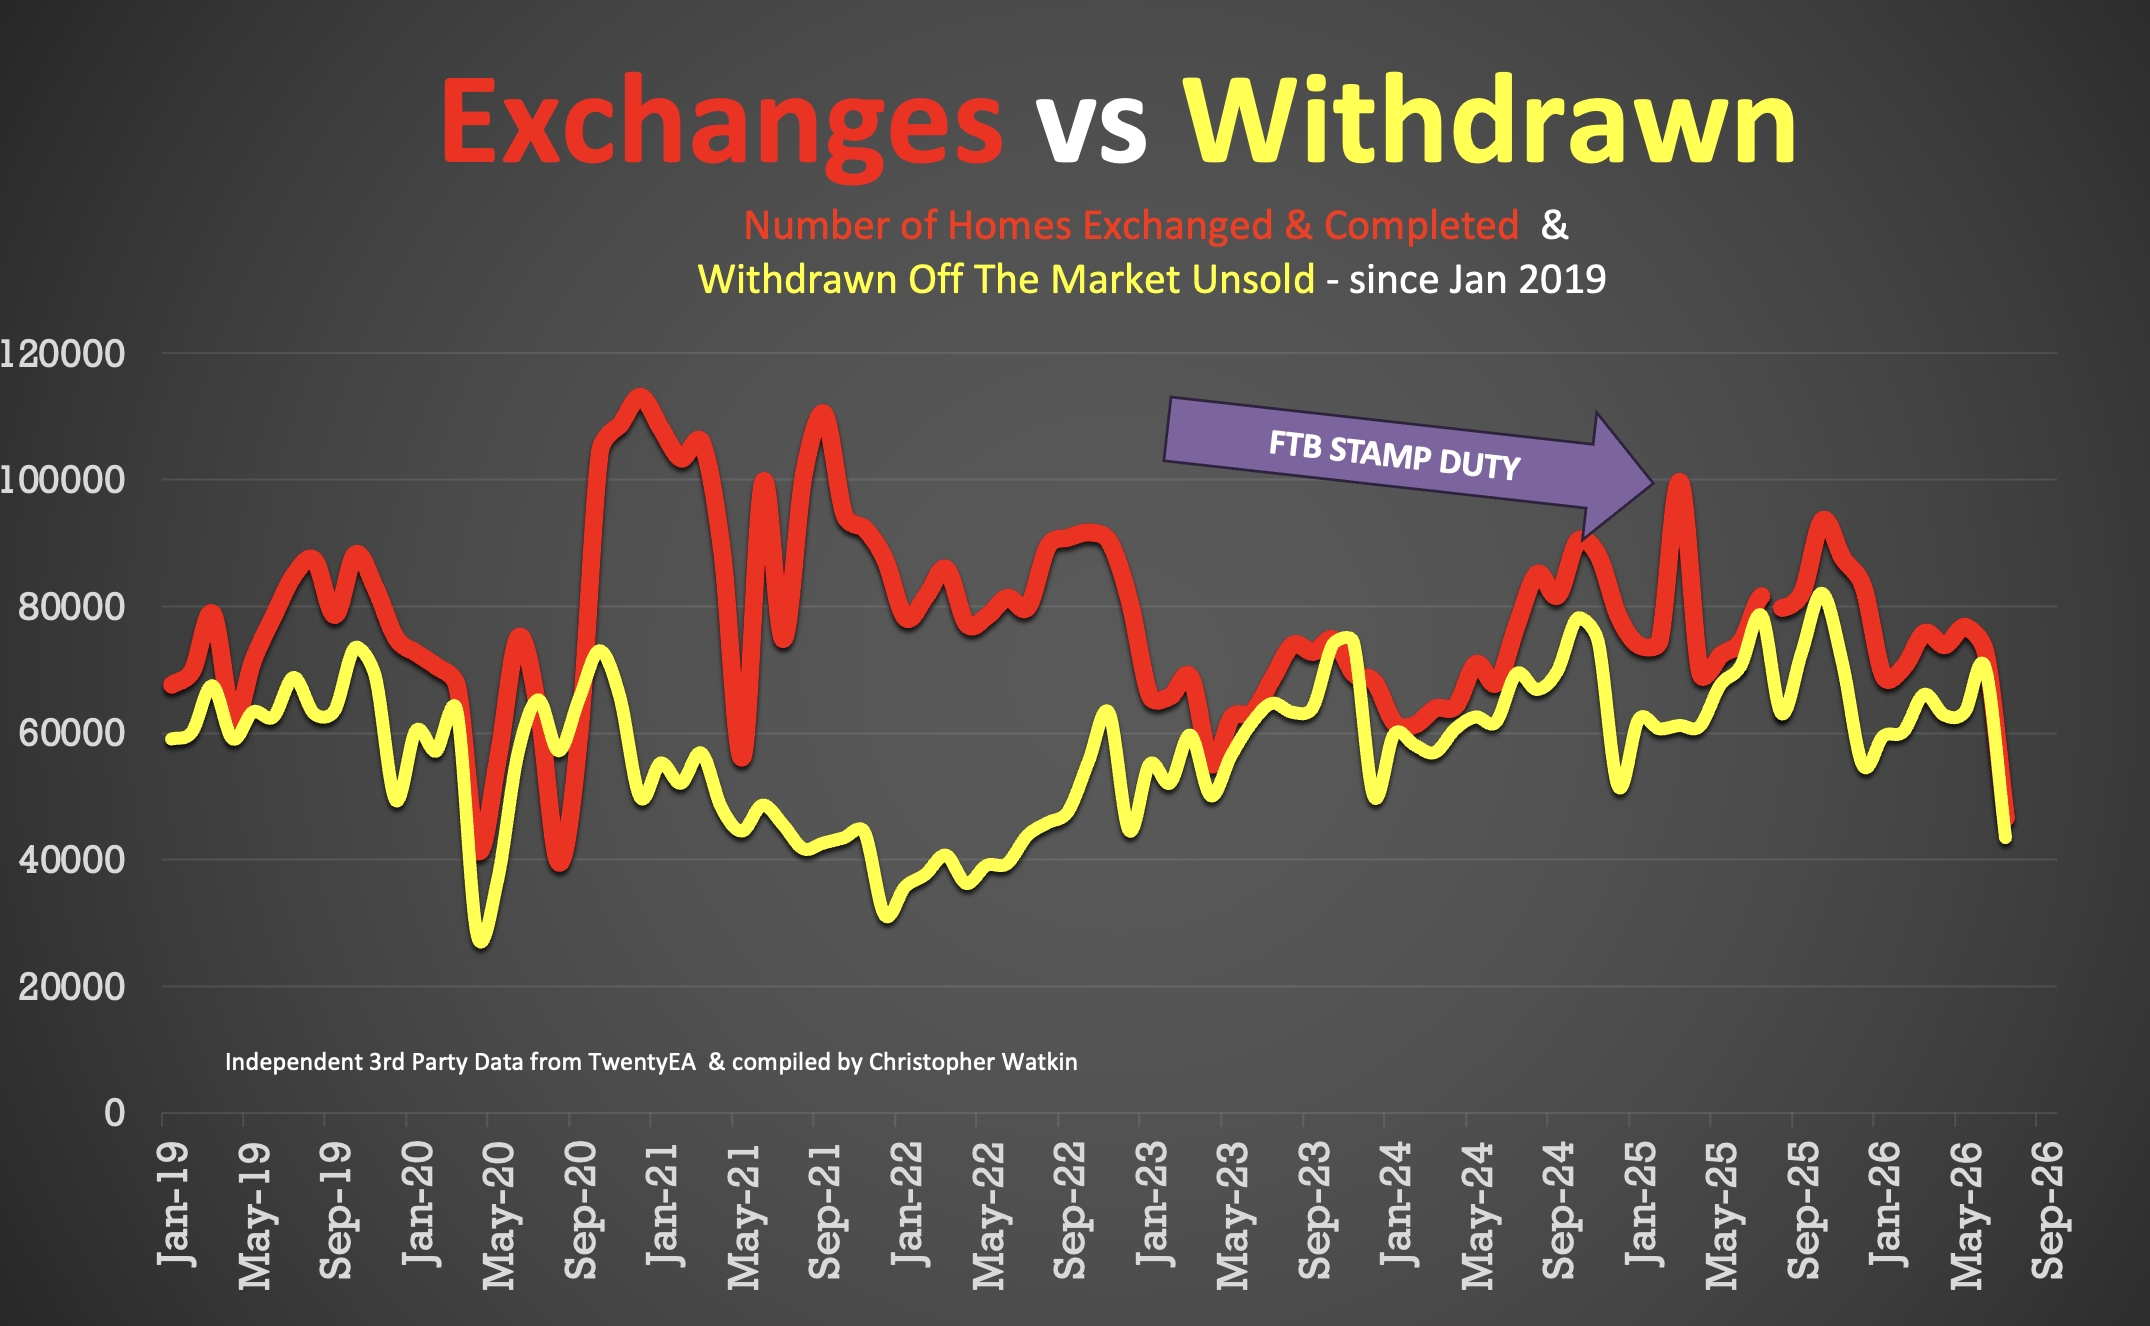
46.6k Exchanges in July 2026 (note this figure will rise during August as more exchanges get reported. On past trends, expect that to end on mid/ late 70k’s
43.5k withdrawals in July 2026 – again, this figure will increase as more July withdrawals come through the system throughout August
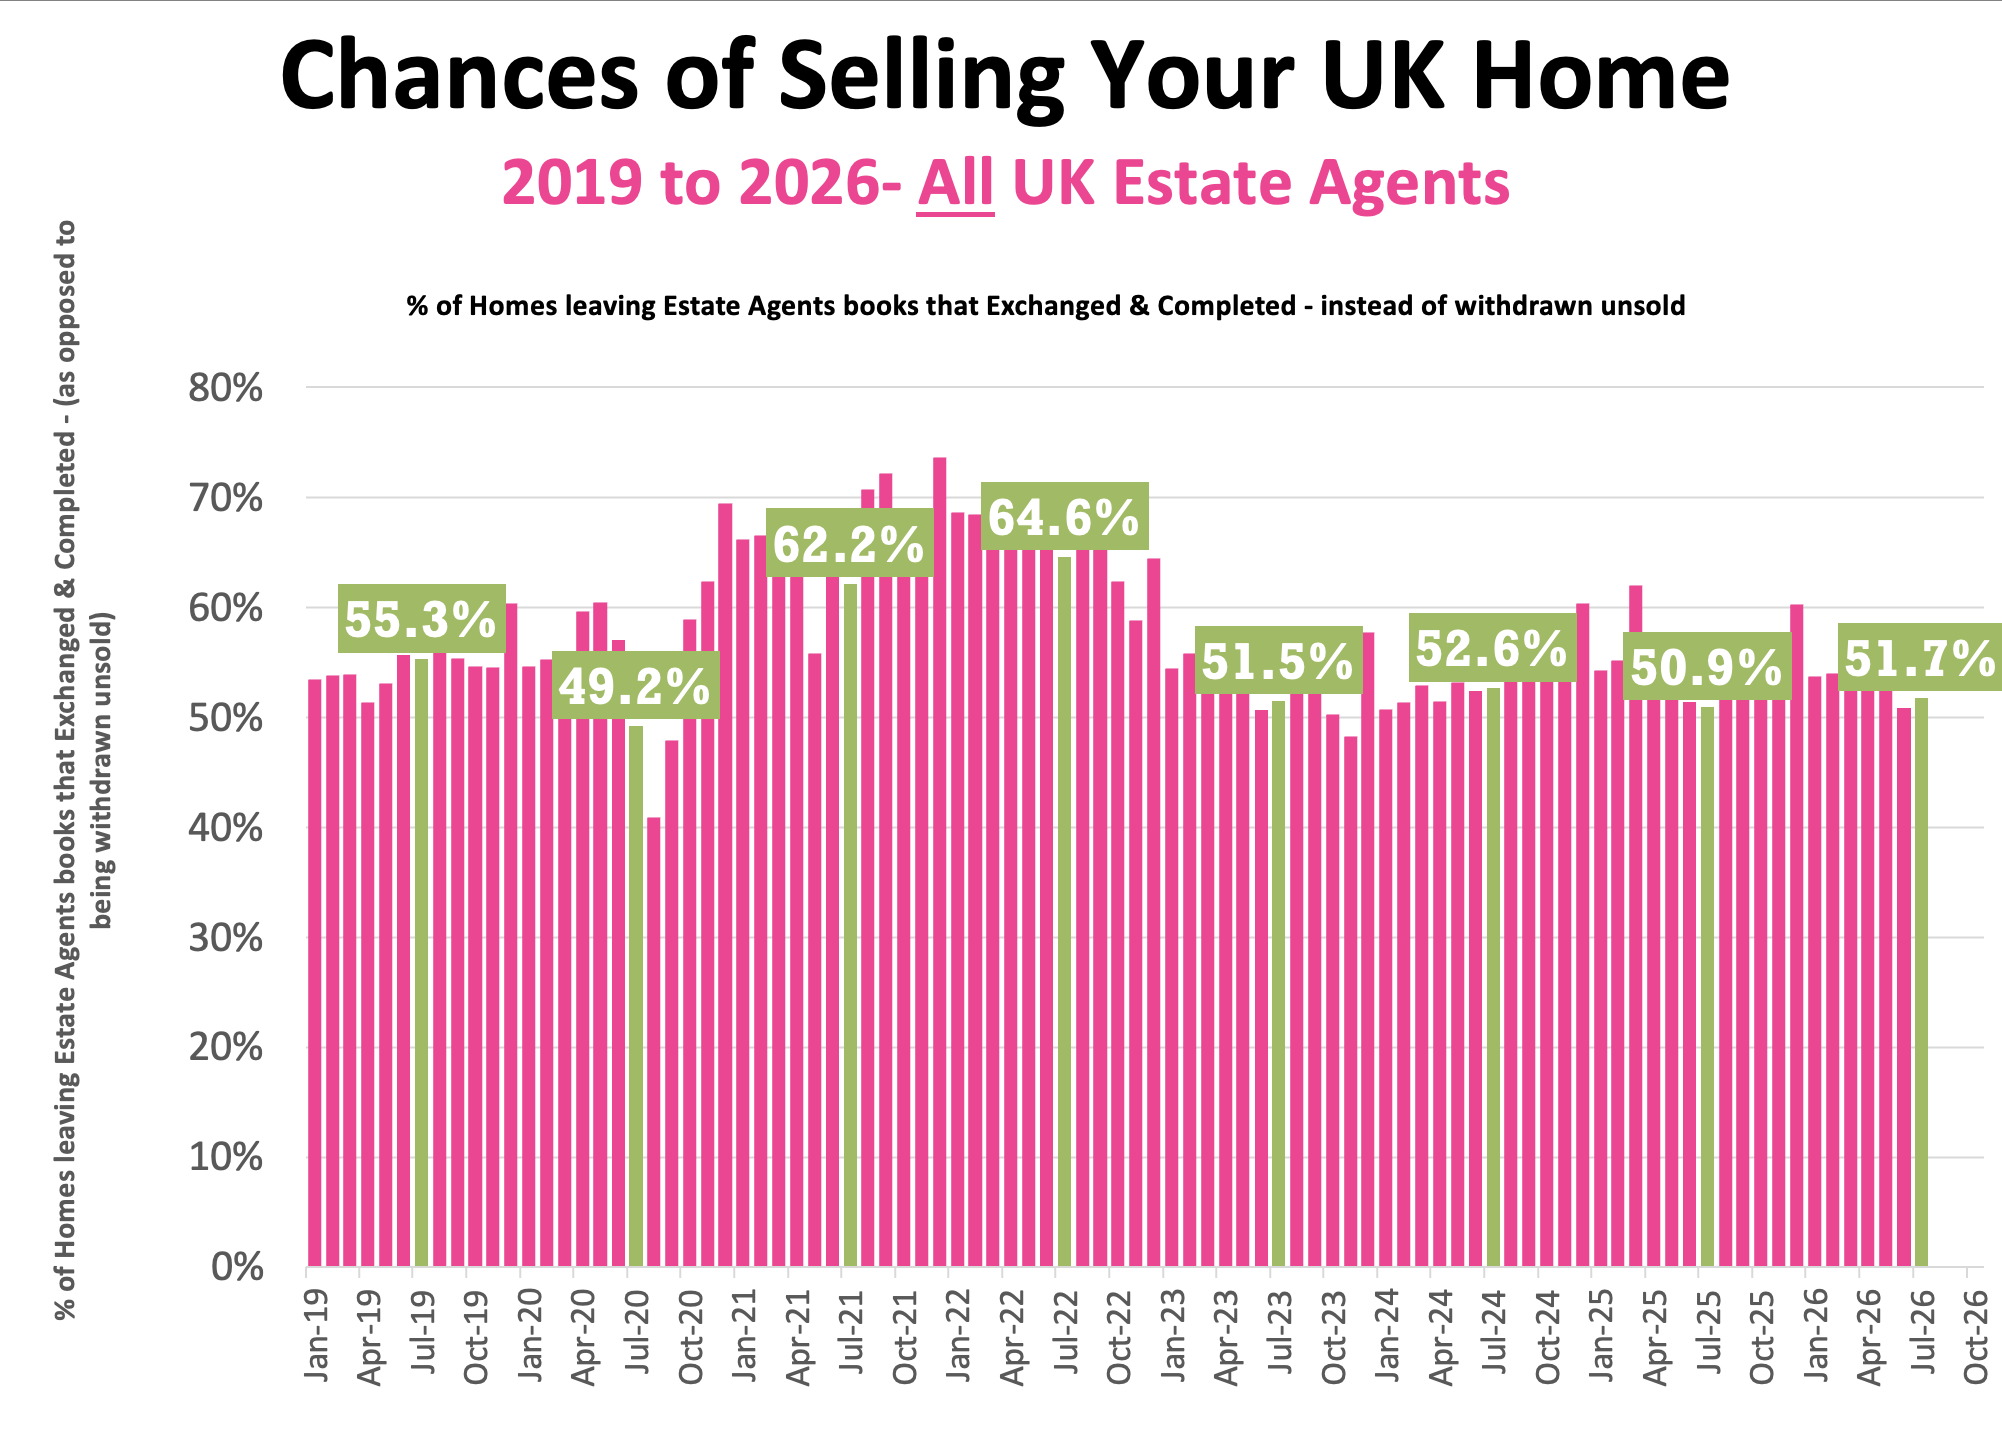
Therefore, in July 2026, only 51.7% of homes that left agents’ books exchanged & completed in July (the rest – 48.3% withdrew, unsold)
57.6% is the seven year average exchange to listings ratio (which includes the crazy years post-lockdown 18 months)
Additional info…
Price Reductions
23.1k reductions this week on a 767k UK homes for sale
13.7% of UK homes for sale were reduced in July (down from 14.3% in June)
2026 YTD average 13%, versus the 6-year long-term average of 11.2%
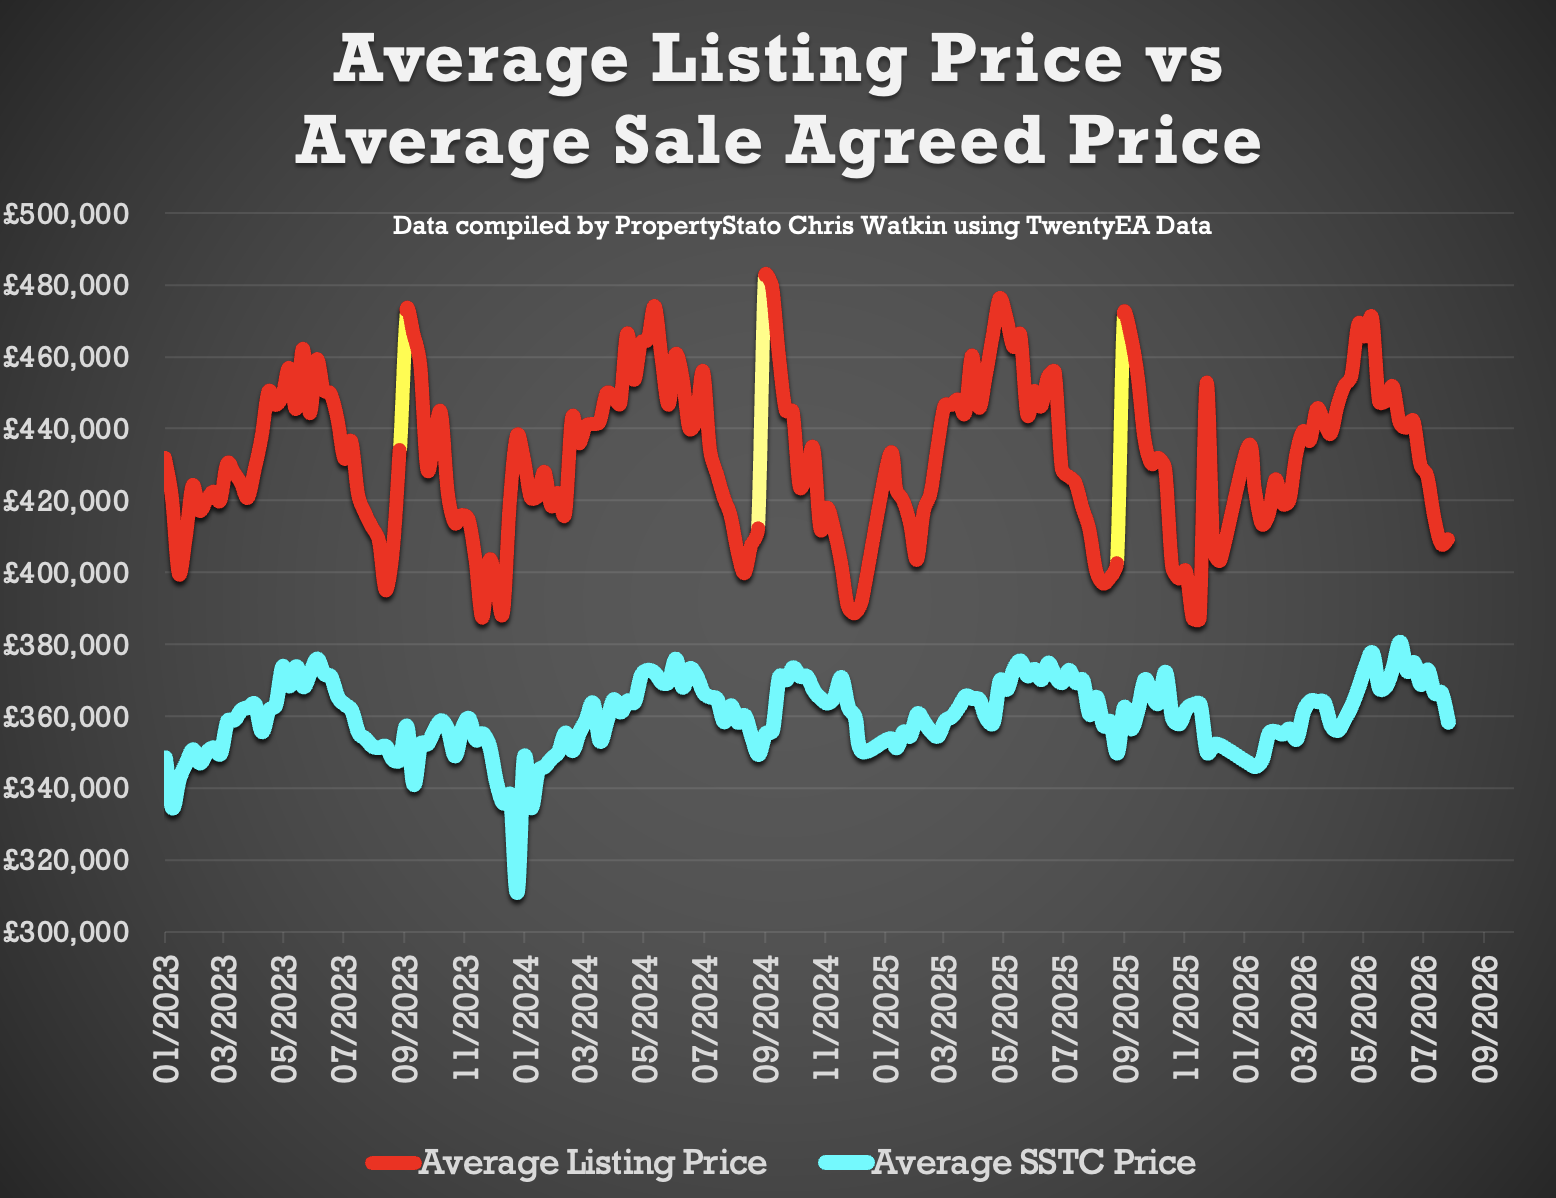
Price Difference between Asking Price of Listings & Asking Price of those Homes that go Sold STC
14.2% difference (long term 10 year average is 16% to 17%). (£409k ave listing ave asking price vs £358k sale agreed ave asking price)
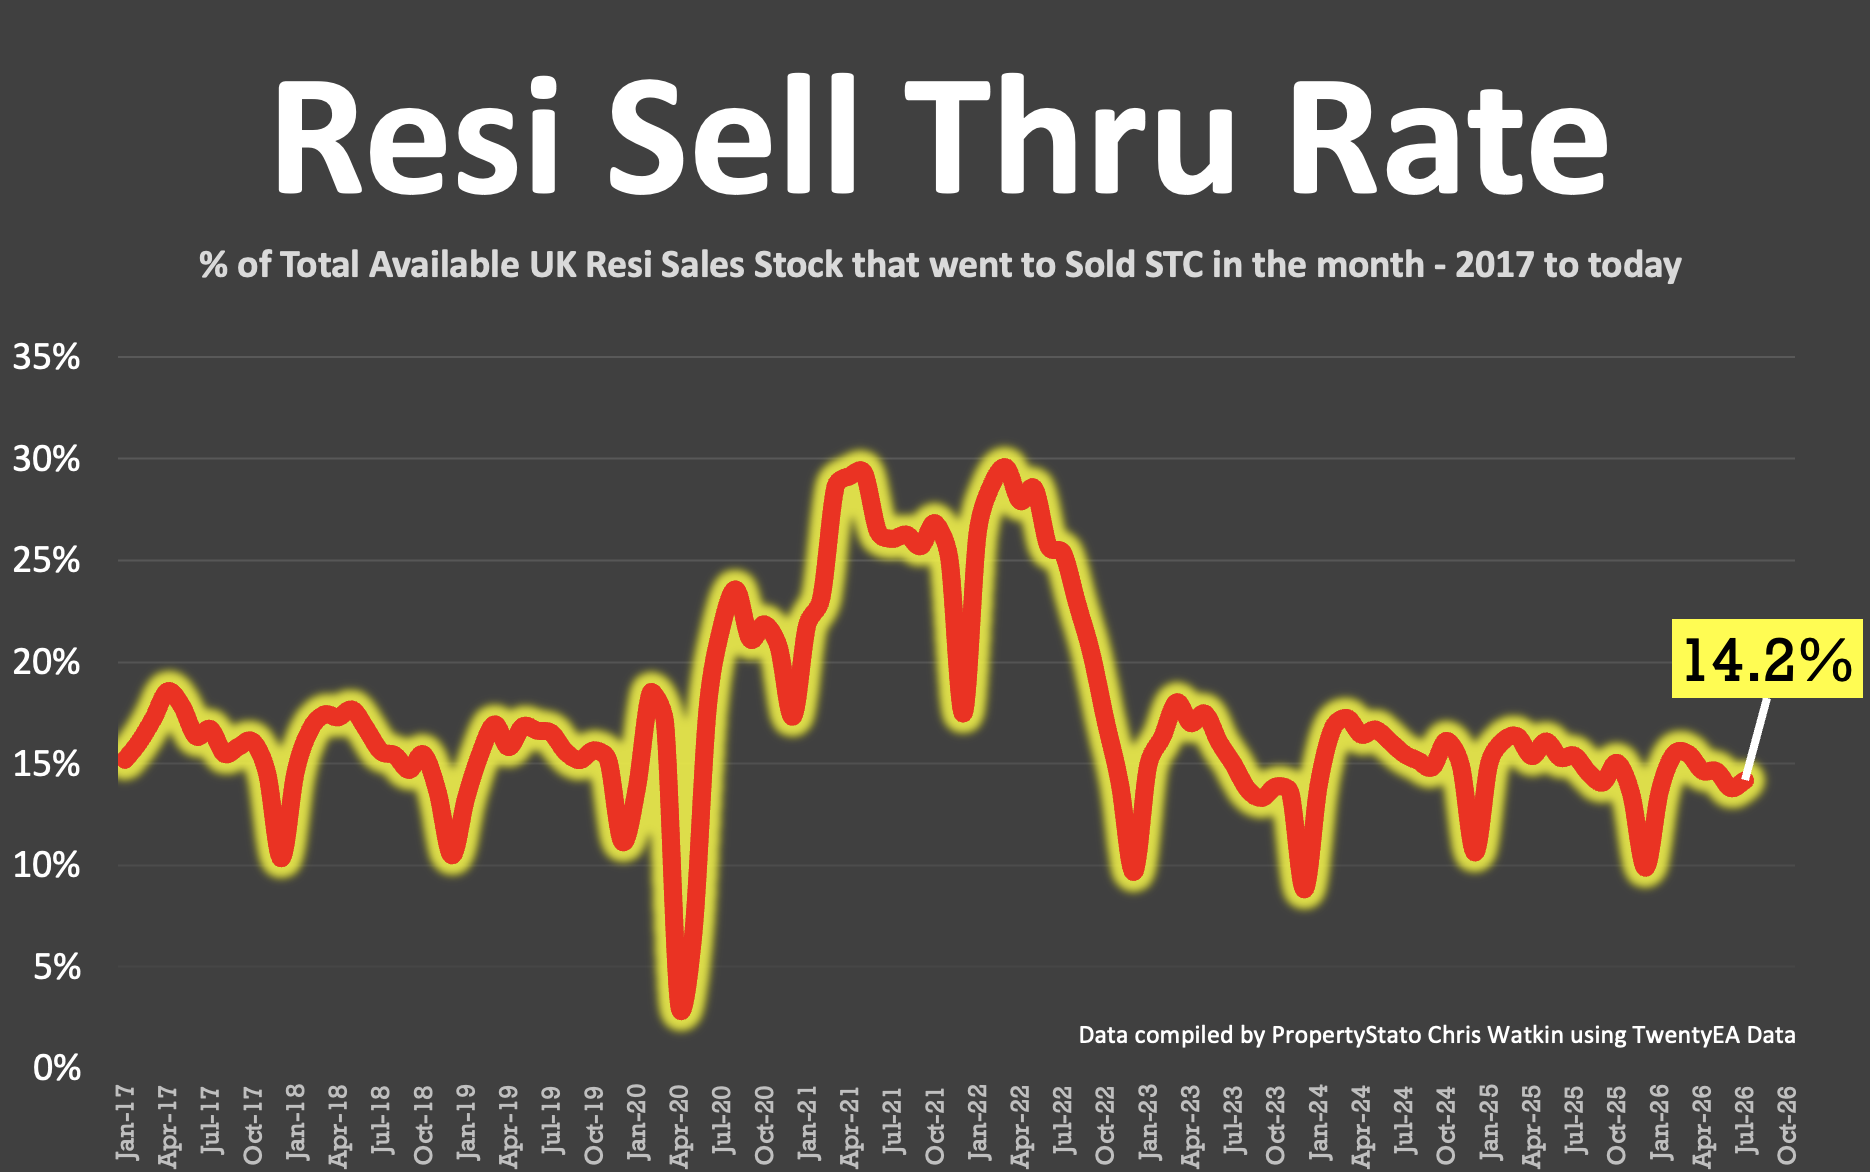
Sell-Through Rate
14.2% of homes on agents’ books went SSTC in July 26 (compared to 13.8% in June 26)
Pre-Covid average: 15.5%.
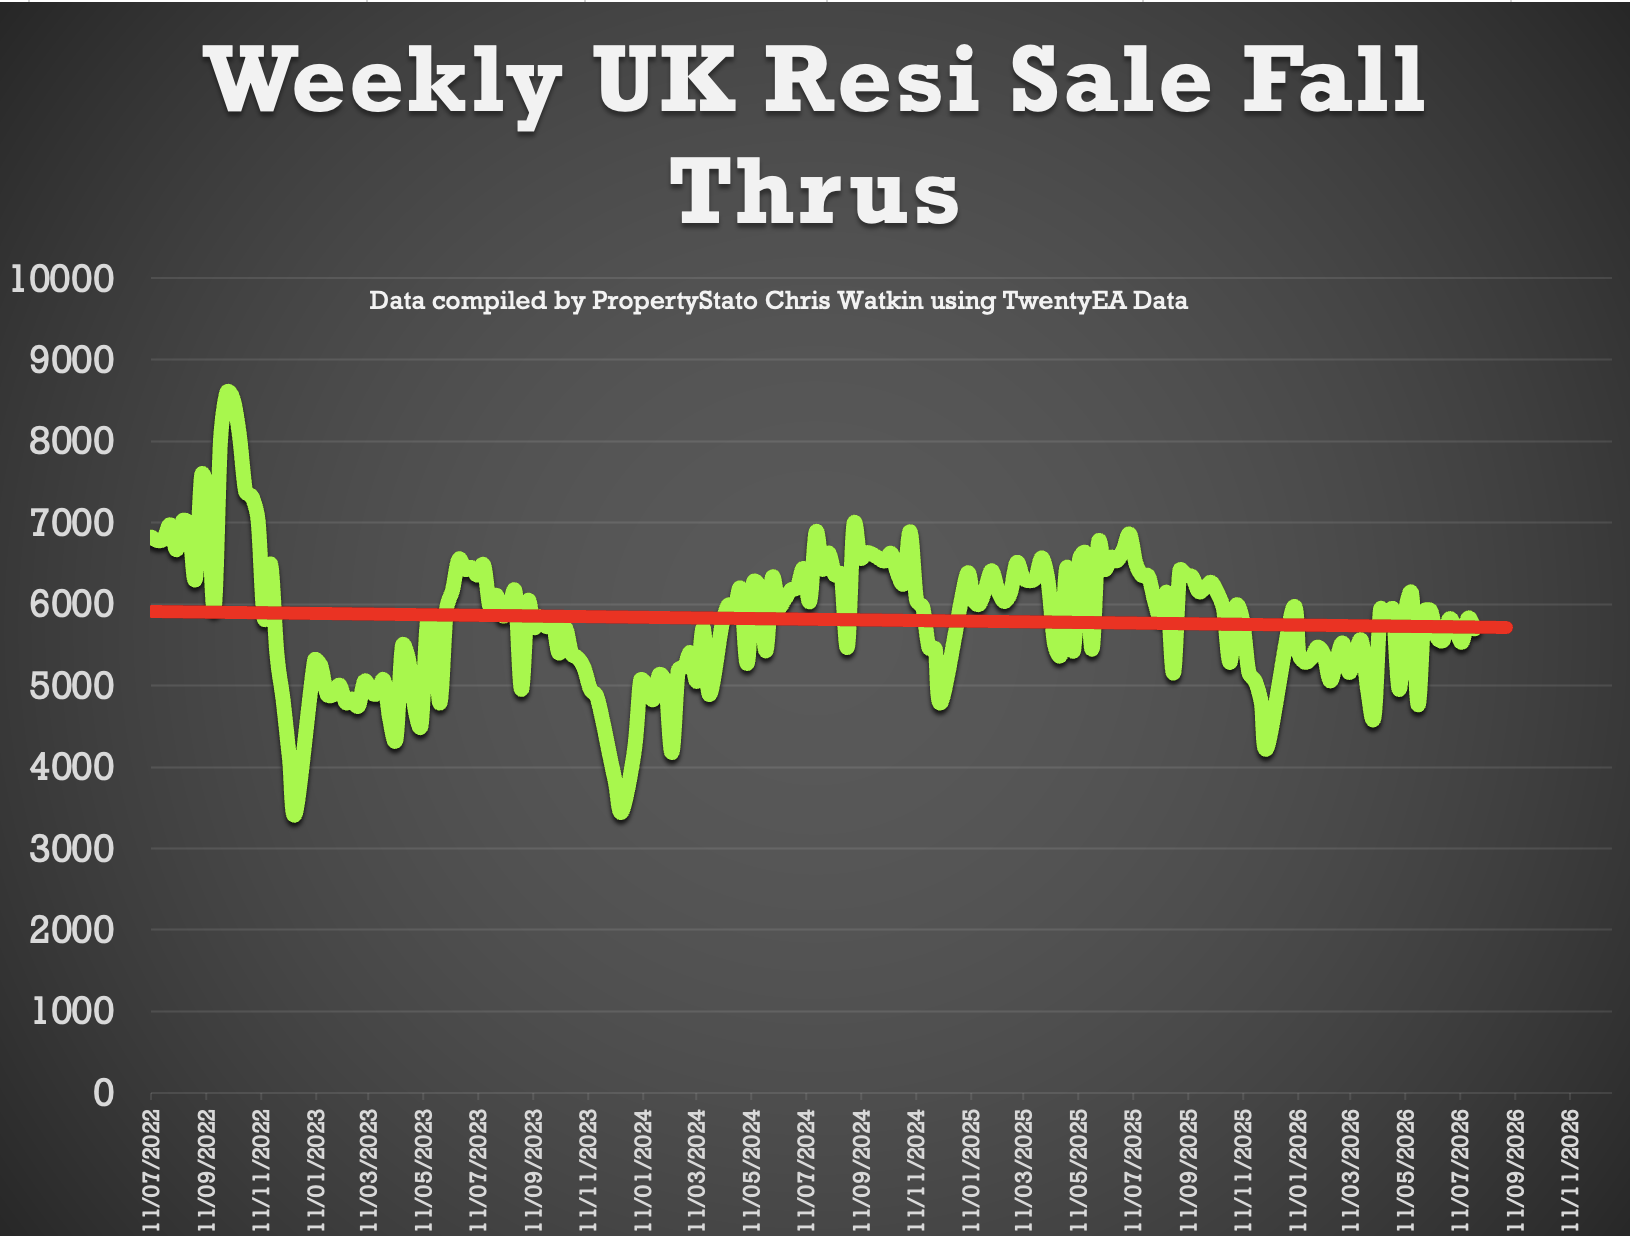
Sale Fall-Throughs
Fall-through rate: 24.3%
Decade average: 24.5%
5.07% of homes sold STC fell through in June 2026, below both the 2025 average of 5.3% and the 10 year average of 5.8%.
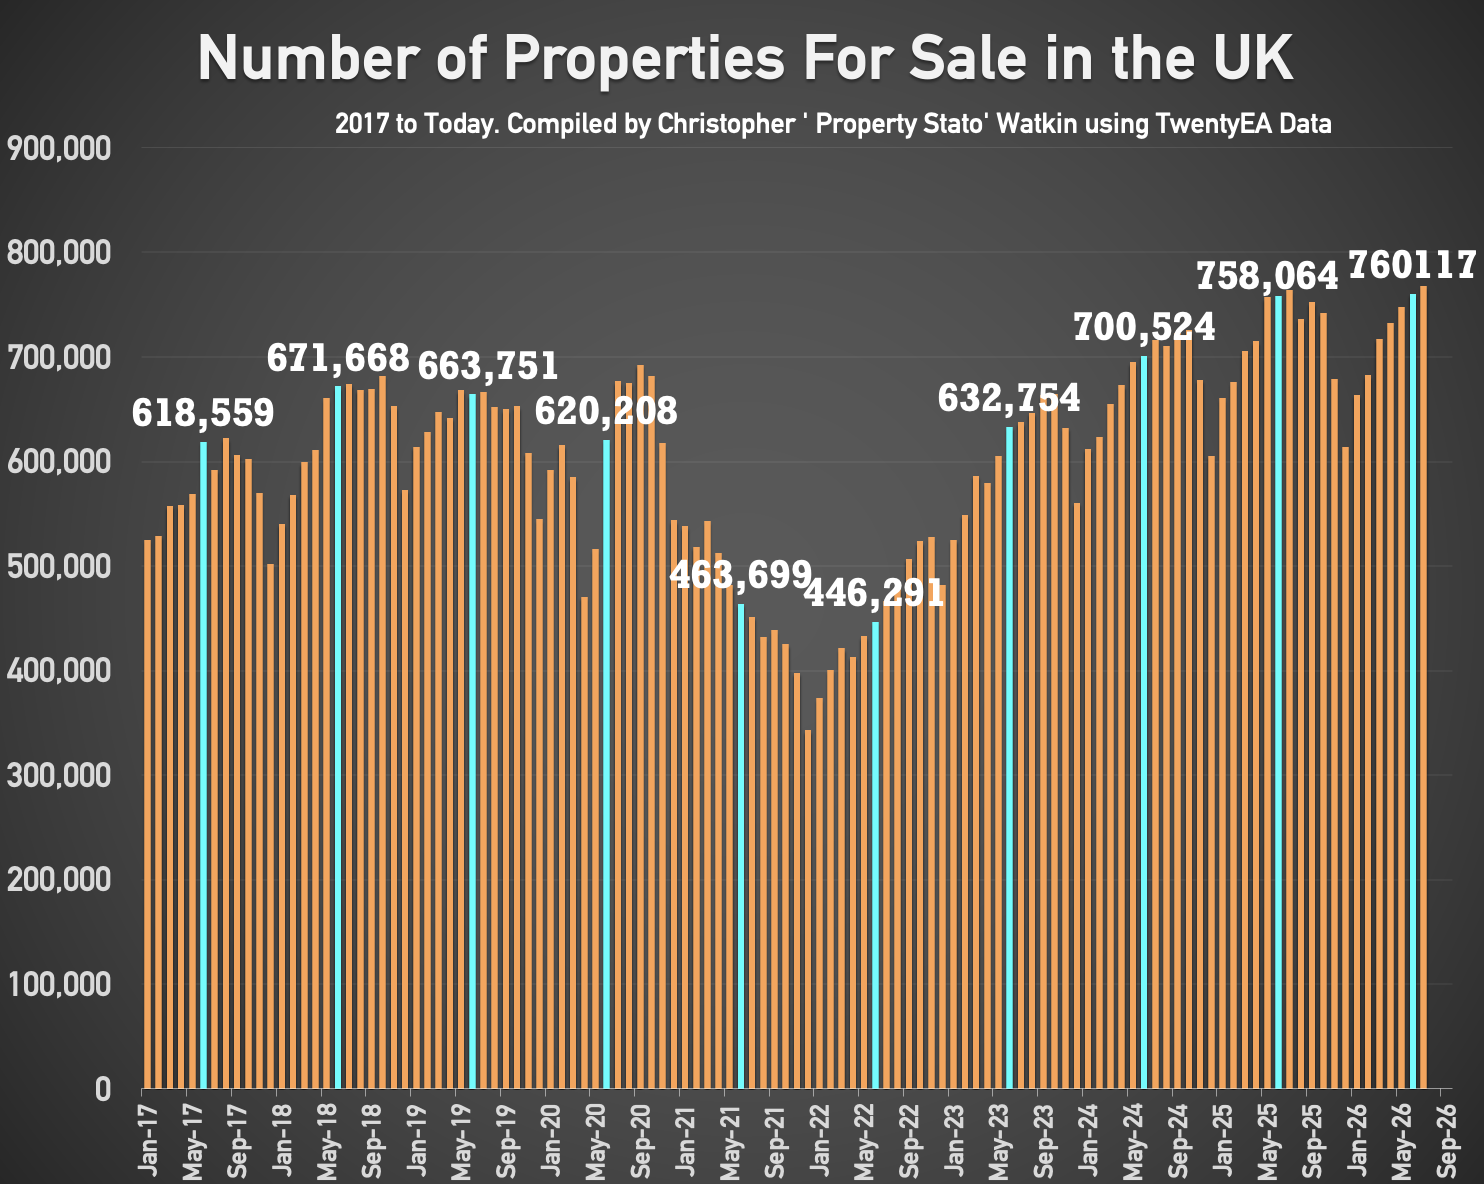
Stock Levels
767k homes on the market on the 1st August 26 (760k the month before and 763k 12 months ago)
487k homes in agent’s sales pipeline on the 1st August 26, lower than 12 months ago on 1st August 25 (508k).
House Prices (£/sq.ft)
July 26 agreed sales averaged £345.41 per sq.ft. 1.2% higher than 12 months ago (£341.43) and 11.9% than five years ago (£308.60). The £/sqft at sale agreed matches the HM Land Registry Index with a 98% accuracy, five months in advance. That is why it is so important
UK Rental Data
Average Rent in Wk 30 – £1,813 pcm
Average Rent in July 2026 – £1,837 pcm
Average Rent in July 2025 – £1,849 pcm
Average Rent in July 2021 – £1,446 pcm
Average Rent in YTD 2026 – £1,764 pcm
323k UK rental stock available to rent in July 26 (319k in July 2025)
New Rental Properties Coming onto the Market in July 2026 – 135,928. (128,821 in July 2025 & 111,080 in July 2022)
Local Focus this Week in the Show
Maidstone