

 The share of homes sold by a landlord in Great Britain fell from 15.7% in 2022 to14.0% so far this year, the latest data from Hamptons shows.
This means investors are set to sell 139,820 buy-to-lets across Great Britain in 2023, 53k fewer than in 2022 and 62k less than in 2021 when landlord sales peaked.
The agency reports that by the end of this year, private landlords will have sold 294,300 more homes than they’ve bought since 2016. This is more than the total number of homes in Manchester (237,000) and Cornwall (288,000).
Scotland is the only region in Great Britain where the landlord sell-off has accelerated this year and where new purchases hit a record low, based in the figures provided.
Annual rental growth remained at 11.7% across Great Britain in October, led by double-digit hikes in London and Scotland.
Chart 1 – Number of homes bought and sold by landlords across Great Britain
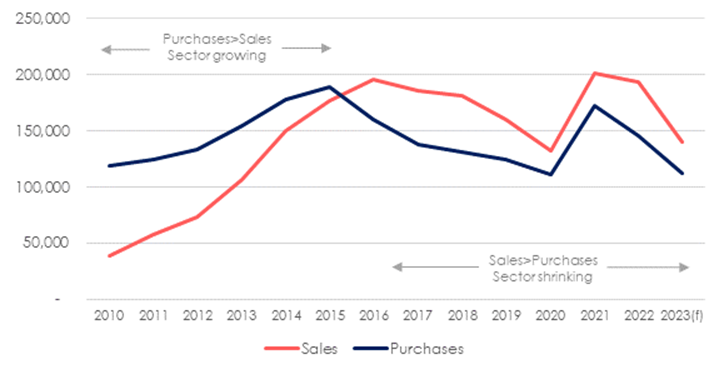
Source: HMRC & Hamptons
Even with rising running costs and higher mortgage rates eroding profits, so far this year private landlords accounted for 14.0% of all sellers in Great Britain (GB), down from 15.7% in 2022.
In number terms, this means that landlords sold 103,130 homes across GB between January and September this year, 39,270 or 28% fewer than during the same period last year as transactions have slowed across the board (table 1). Apart from when Covid hit in 2020, this also marked the lowest number of homes sold by investors during the first three quarters of a year in a decade.
If this pace continues and a total of 1m sales take place across GB this year, private investors are set to sell 139,820 buy-to-lets in 2023, 53,240 fewer than in 2022 and 61,810 less than in 2021 when landlord sales peaked.
Despite this fall, landlords are still selling more homes than they’re buying. So far this year landlords purchased 11.2% of all homes sold across Great Britain. This means that, apart from during the first nine months of 2020, landlords will have bought the fewest number of homes in any year since at least 2010 when our records began.
Table 1 – Percentage and number of homes bought and sold by landlords across Great Britain
| % of homes bought & sold by landlords | Number bought & sold
(Jan-Sep of each year) |
Number bought & sold
(Full year) |
|||||||
| % Sold | % Bought | Sales | Purchases | Net* | Sales | Purchases | Net* | ||
| 2010 | 4.4% | 13.7% | 28,240 | 88,180 | 59,940 | 38,190 | 119,250 | 81,060 | |
| 2011 | 6.6% | 14.3% | 41,850 | 89,980 | 48,130 | 57,770 | 124,210 | 66,440 | |
| 2012 | 8.0% | 14.5% | 53,340 | 97,060 | 43,720 | 73,120 | 133,070 | 59,950 | |
| 2013 | 10.0% | 14.6% | 74,760 | 108,790 | 34,030 | 105,920 | 154,140 | 48,220 | |
| 2014 | 12.5% | 14.9% | 110,790 | 131,750 | 20,960 | 149,810 | 178,170 | 28,360 | |
| 2015 | 14.7% | 15.7% | 127,650 | 136,570 | 8,920 | 177,020 | 189,390 | 12,370 | |
| 2016 | 16.2% | 13.2% | 146,520 | 119,800 | – 26,720 | 195,570 | 159,920 | – 35,650 | |
| 2017 | 15.5% | 11.6% | 136,700 | 101,830 | – 34,870 | 185,360 | 138,080 | – 47,280 | |
| 2018 | 15.6% | 11.3% | 131,900 | 95,740 | – 36,160 | 181,040 | 131,410 | – 49,630 | |
| 2019 | 14.0% | 10.8% | 116,820 | 90,160 | – 26,660 | 160,380 | 123,790 | – 36,590 | |
| 2020 | 12.9% | 10.9% | 84,770 | 71,400 | – 13,370 | 132,200 | 111,350 | – 20,850 | |
| 2021 | 14.0% | 11.9% | 161,010 | 137,430 | – 23,580 | 201,630 | 172,100 | – 29,530 | |
| 2022 | 15.7% | 11.9% | 142,400 | 107,540 | – 34,860 | 193,060 | 145,810 | – 47,250 | |
| 2023 | 14.0% | 11.2% | 103,130 | 82,830 | – 20,300 | 139,820 | 112,300 | – 27,520 | |
Source: HMRC & Hamptons
*If the net figure is positive, it means that landlords have purchased more homes than they bought, therefore adding to the supply of rental stock. If the net figure is negative, it means that the number of homes available to rent has likely shrunk.
While institutional investment in the private rented sector through Build-to-Rent schemes will have filled some of the gap left by private landlords, overall there were 43% fewer homes available for tenants to rent in the first 10 months of this year compared to the same period in 2015.
Table 2 – Share of homes bought and sold by landlords by region
|
|
Share of homes bought by a landlord | Share of homes sold by a
landlord |
||
| 2023 YTD | YoY Change | 2023 YTD | YoY Change | |
| London | 9% | -1% | 15% | -4% |
| East | 9% | -1% | 12% | -2% |
| S. East | 10% | 1% | 15% | -2% |
| S. West | 10% | -1% | 15% | -4% |
| E. Midlands | 17% | 1% | 18% | -1% |
| W. Midlands | 14% | -2% | 15% | -1% |
| Y. Humber | 13% | -2% | 15% | -4% |
| N. West | 15% | 0% | 14% | -2% |
| N. East | 27% | -2% | 22% | -9% |
| Wales | 9% | -1% | 10% | 0% |
| Scotland | 6% | -2% | 12% | 3% |
| Great Britain | 11.2% | -0.6% | 14.0% | -1.7% |
Source: Hamptons
Scotland is the only region in Great Britain where the landlord sell-off has accelerated this year. Investors have made up a record 12% of all sellers in Scotland so far in 2023, up from 10% in 2022 (table 2). Tighter rules and regulations, predominantly in the form of rent caps, have seen landlord purchases fall to a record low too. Landlords bought just 6% of all homes sold in Scotland so far this year, the lowest proportion in Great Britain. It’s also where the gap between landlord sales and new purchases is widest.
Meanwhile the North East, the highest-yielding region in the country, saw the pace of landlord sales slow the most this year. Here, higher average returns offer landlords more scope to cover their rising costs. Landlords accounted for 22% of all sellers in the region this year, down from a peak of 31% in 2022 (table 2). However, given that 27% of homes in the North East were purchased by a landlord this year, landlords are still buying more homes than they’re selling – the North East and North West are the only regions where this is the case.
In London, the lowest-yielding region in the country and where mortgaged landlords are likely to be hardest hit by higher rates, new purchases have slipped. Landlords bought 9% of homes sold in the capital this year down from a peak of 20% in 2015. The share of homes sold by London investors has also declined from 19% in 2022 to 15% so far this year (table 2). Consequently, the number of homes available to rent in the capital so far this year has halved relative to 2015 levels.
As cost pressures mount for many landlords, buy-to-let increasingly only stacks up for the highest-yielding homes. This is particularly true for those investors with a mortgage. Consequently, landlords are increasingly selling lower-yielding homes, while those purchasing a new investment are targeting higher-yielding options. The average gross yield achieved on a new purchase this year rose to 6.8%, whereas the average yield on sale was 5.5% across England & Wales. This yield gap equates to an extra £2,710 a year in rental income on a typical £200k buy-to-let.
Just over half (53%) of all homes sold by a landlord in England and Wales this year were achieving a sub-5% gross yield, up from 46% in 2022. Meanwhile 78% of new buy-to-lets achieved a +5% gross yield so far this year, up from 65% in 2019. Strong rental growth has meant that a record 12% of new buy-to-let purchases this year achieved a gross yield of 10% or above, double the share in 2021. However, these returns are pre-costs and taxes which will eat into profit.
With regards to rental growth, this shows little sign of slowing as rents rose 11.7% year-on-year across Great Britain in October, the same annual pace as in September.
The average rent on a newly let property in Great Britain rose to £1,345pcm in October, up £141pcm compared to the same month last year. This marked the third consecutive month of double-digit increases and the sixth double-digit hike recorded during the last 12 months.
Table 3 – Rental growth on newly let properties in October 2023
| Average monthly rent | YoY % | YoY £ | |
| Greater London | £ 2,423 | 14.8% | £ 312 |
| Inner London | £ 3,140 | 9.7% | £ 277 |
| Outer London | £ 2,287 | 15.9% | £ 314 |
| East of England | £ 1,263 | 10.4% | £ 119 |
| South East | £ 1,393 | 11.5% | £ 144 |
| South West | £ 1,174 | 7.0% | £ 77 |
| Midlands | £ 943 | 10.9% | £ 92 |
| North | £ 894 | 9.8% | £ 79 |
| Wales | £ 803 | 6.2% | £ 47 |
| Scotland | £ 928 | 12.9% | £ 106 |
| Great Britain | £ 1,345 | 11.7% | £ 141 |
| Great Britain (Exc. London) | £ 1,069 | 9.9% | £ 97 |
Source: Hamptons
Rents are rising in every region, however, London and Scotland are leading the way. Led by growth in Outer London, rents rose 14.8% across the capital last month which would cost the average tenant an extra £312pcm or £3,744 a year if they were to move into a new home. Meanwhile Scotland, where the landlord sell-off accelerated this year, followed with rents rising 12.9% year-on-year. This marked the eighth double-digit increase for newly let properties over the last 12 months.
The average cost of a three-bed home in Great Britain rose to £1,412pcm in October, crossing the £1,400pcm month mark for the first time. This represented an 11.8% or £149pcm annual hike. However, the average one-bed rent also rose 10.0% year-on-year and the average two-bed increased by 13.3%, suggesting that rent rises are embedded across all property types.
Aneisha Beveridge, head of research at Hamptons, said: “There’s a strong argument that landlords have been hit harder by higher rates than anyone else. However, despite these challenges, most landlords are sticking it out. Strong rental growth is softening the blow, but they’re also drawing on their equity and cash reserves to see them through. Portfolio investors – who tend to be more highly leveraged – are juggling their assets by selling one or two properties to reduce their mortgage debt on the rest of their portfolio, rather than selling up entirely.
“Most landlords cashing in are one of the 10%-20% of mortgaged investors who face making losses when remortgaging at higher rates. Typically, they bought low-yielding properties in the South of England relatively recently or they’ve been aggressively maximising their leverage and extracting equity to grow their portfolio.
“The real supply issue facing the private rented sector hasn’t just been caused by landlords selling up, but also because there’s been little appetite among investors to purchase new buy-to-lets over the last few years. This has reduced the number of homes available to rent which is fuelling rental growth. After adding wider inflationary pressures on top, we think rents will have risen by 25% by the end of 2026.”
‘Cashing in’? No, there’s just selling.
You must be logged in to like or dislike this comments.
Click to login
Don't have an account? Click here to register
The key figure for me is the 43% reduction in homes available tor rent since 2015. I can’t think why that’s happened!
You must be logged in to like or dislike this comments.
Click to login
Don't have an account? Click here to register
This is a never ending story, a fiasco created by central and local governments, civil servants and anti-landlord pressure groups and no sign that it is going to stop. The lack of foresight by these people is bewildering, sitting in ivory towers where they are insulated from the coal face of reality. Ironic that their behaviour is championed to help tenants is actually a red herring and caused more misery for tenants. E.G Taxation and licensing regime fee’s has nothing to do with helping tenants, the biggest hurdles for BTL.
Until someone who is in a position of power to stop the rot takes action, this fiasco will continue and PRS will shrink. Do not say it is the Conservative party, it is all parties. SNP and Welsh Labour have created more problems than anyone to date.
You must be logged in to like or dislike this comments.
Click to login
Don't have an account? Click here to register
The lack of action by those who can act on the PRS crisis, really is bewildering. Landlords understand why it’s happening, and are responding by leaving. I’m sure those causing the problems also understand; there’s plenty of evidence out there. So, why aren’t they acting? Why do they keep hammering the PRS and expect the situation to somehow improve? What do they think will happen when S21 is abolished? Renters won’t feel more secure when there are even fewer rentals to feel secure in!
You must be logged in to like or dislike this comments.
Click to login
Don't have an account? Click here to register