

 Residential property sales activity slowed sharply at the start of June, with the number of homes sold subject to contract falling by 8.9% compared with the same week last year, according to the latest snapshot of the UK housing market, reviewed this week with the help of Verona Frankish of Yopa.
The figures, covering the week ending 7 June 2026, suggest the market has lost momentum following a stronger start to the year, with regional data showing London recorded some of the sharpest declines in agreed sales.
The latest update provides a weekly insight into what is happening on the ground across the residential property sector, tracking trends in buyer demand, sales agreed and market activity.
🟩 Listings
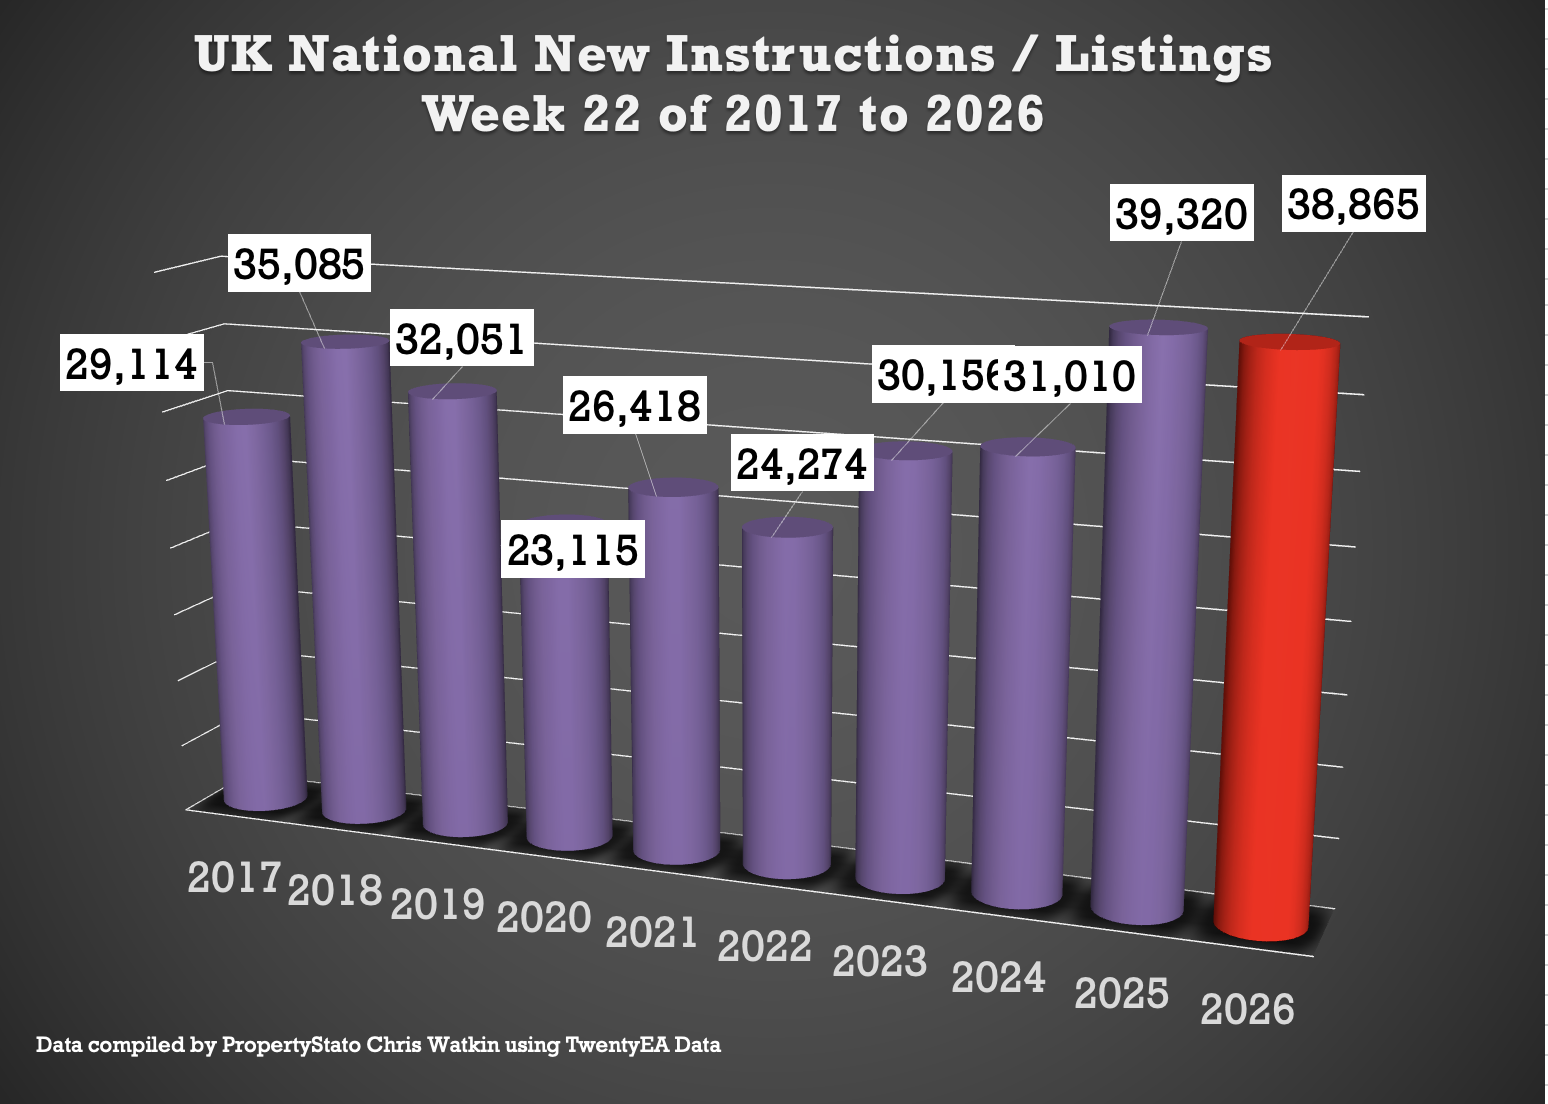
Week 22 ..
38.9k new listings this week, (31.3k last week – although it was aBank holiday ).
Weekly 2026 average : 37.4k.
10 year week 22 average : 30.9k
Year to Date
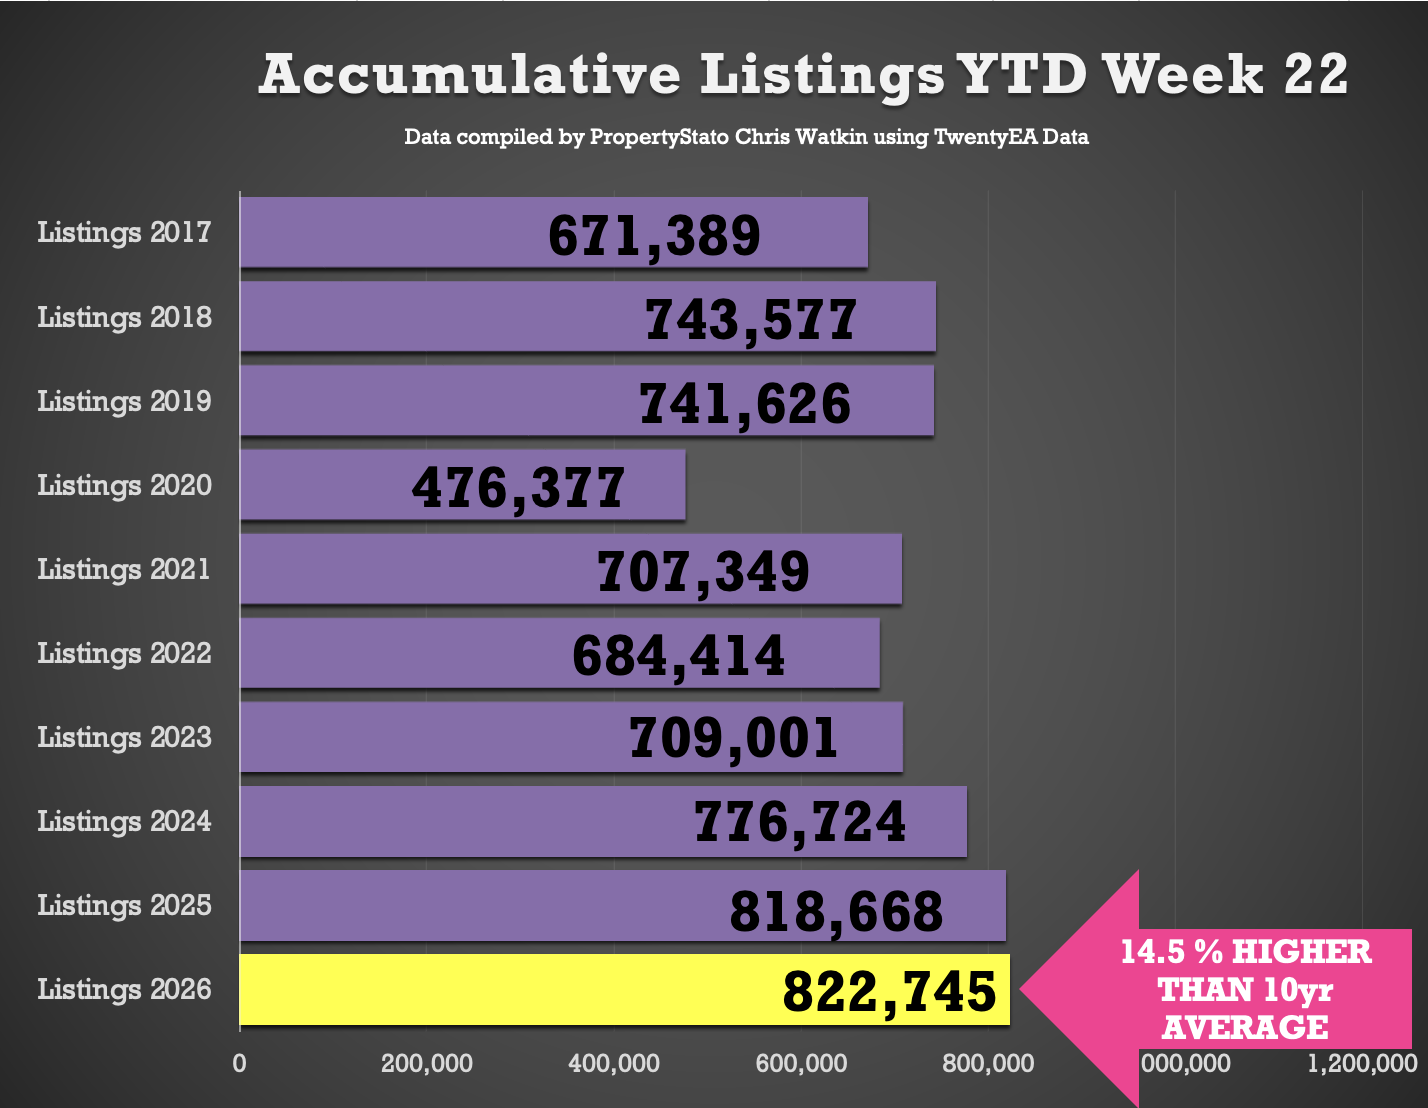
823k new listings YTD
0.5% ahead of 2025 YTD (819k)
5.9% ahead of 2024 YTD (777k)
14.5% higher than the 2017–19 average YTD (715k).
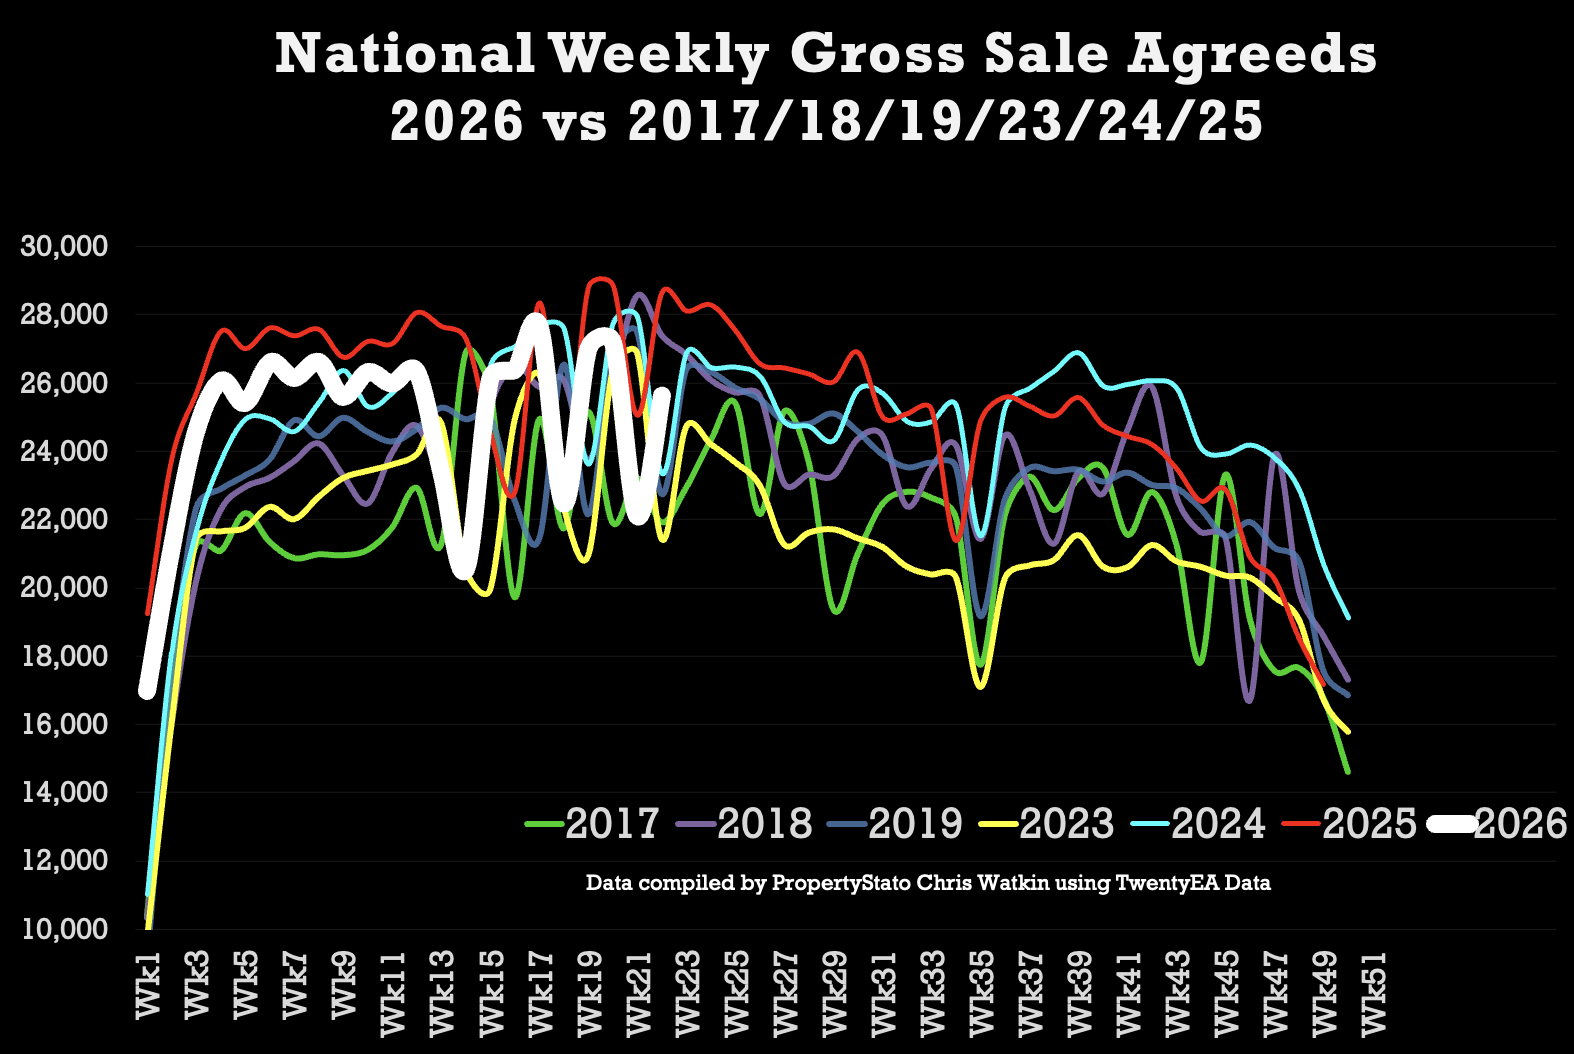
🟩 UK Gross Resi Sales
Week 22
25.6k homes sold stc this week 22 (22.1k last week – which was a Bank Holiday)
10 year week 22 average : 23.5k (NB most wk 22’s have been Bank Holidays in the last decade)
2026 weekly average : 24.8k.
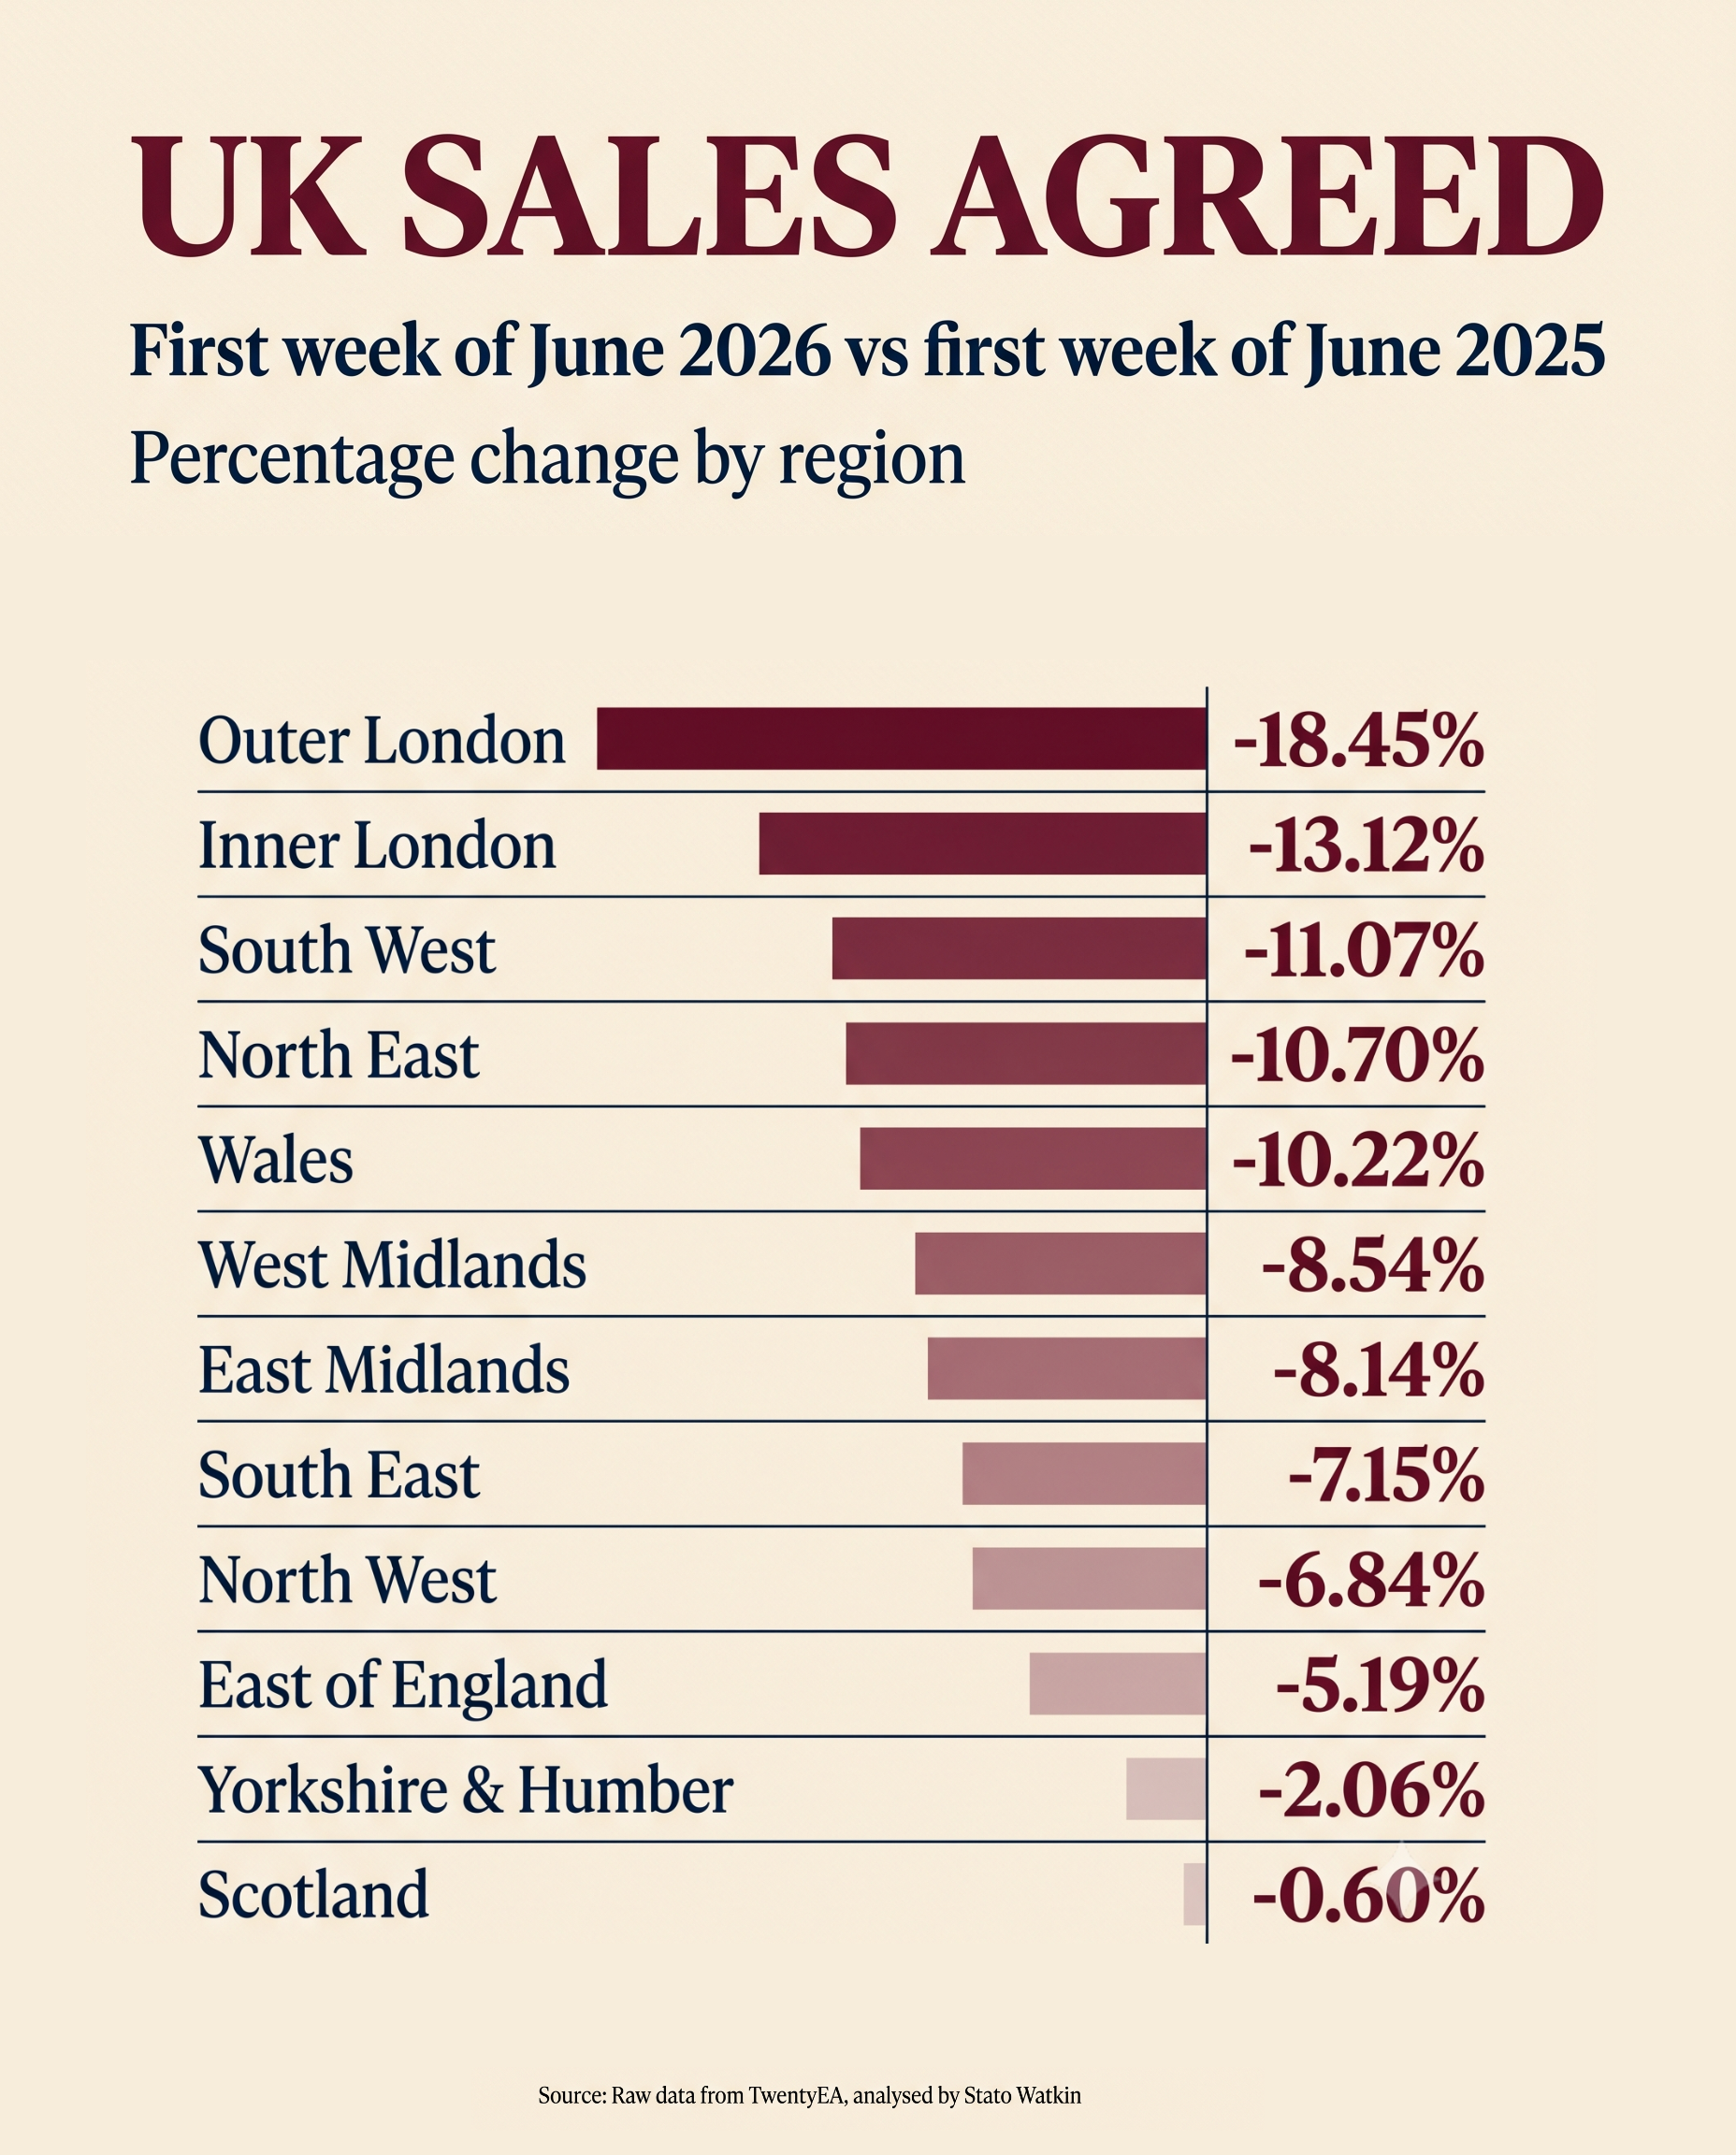
Gross sales (Sales Agreed) activity in the first week of June 2026 (wk 22) was 8,9% lower across every UK region compared with the same week in 2025:
+ Northern Ireland: 638 (sales agreed in) 2025 vs 327 (sales agreed in) 2026, down 48.75%
+ Outer London: 1,214 in 2025 vs 990 in 2026, down 18.45%
+ Inner London: 1,494 in 2025 vs 1,298 in 2026, down 13.12%
+ South West: 2,945 in 2025 vs 2,619 in 2026, down 11.07%
+ North East: 1,084 in 2025 vs 968 in 2026, down 10.70%
+ Wales: 1,311 in 2025 vs 1,177 in 2026, down 10.22%
+ West Midlands: 2,307 in 2025 vs 2,110 in 2026, down 8.54%
+ East Midlands: 2,137 in 2025 vs 1,963 in 2026, down 8.14%
+ South East: 4,266 in 2025 vs 3,961 in 2026, down 7.15%
+ North West: 3,260 in 2025 vs 3,037 in 2026, down 6.84%
+ East of England: 2,833 in 2025 vs 2,686 in 2026, down 5.19%
+ Yorkshire & Humber: 2,182 in 2025 vs 2,137 in 2026, down 2.06%
+ Scotland: 2,323 in 2025 vs 2,309 in 2026, down 0.6%
Overall, the figures point to a softer market than early June 2025, but not a uniform one. Northern Ireland and London saw the sharpest falls, while Yorkshire & Humber and Scotland remained comparatively steady.
Yet, let us not forget before all the doom mongers gather round their doom fire
Year to Date for house sales
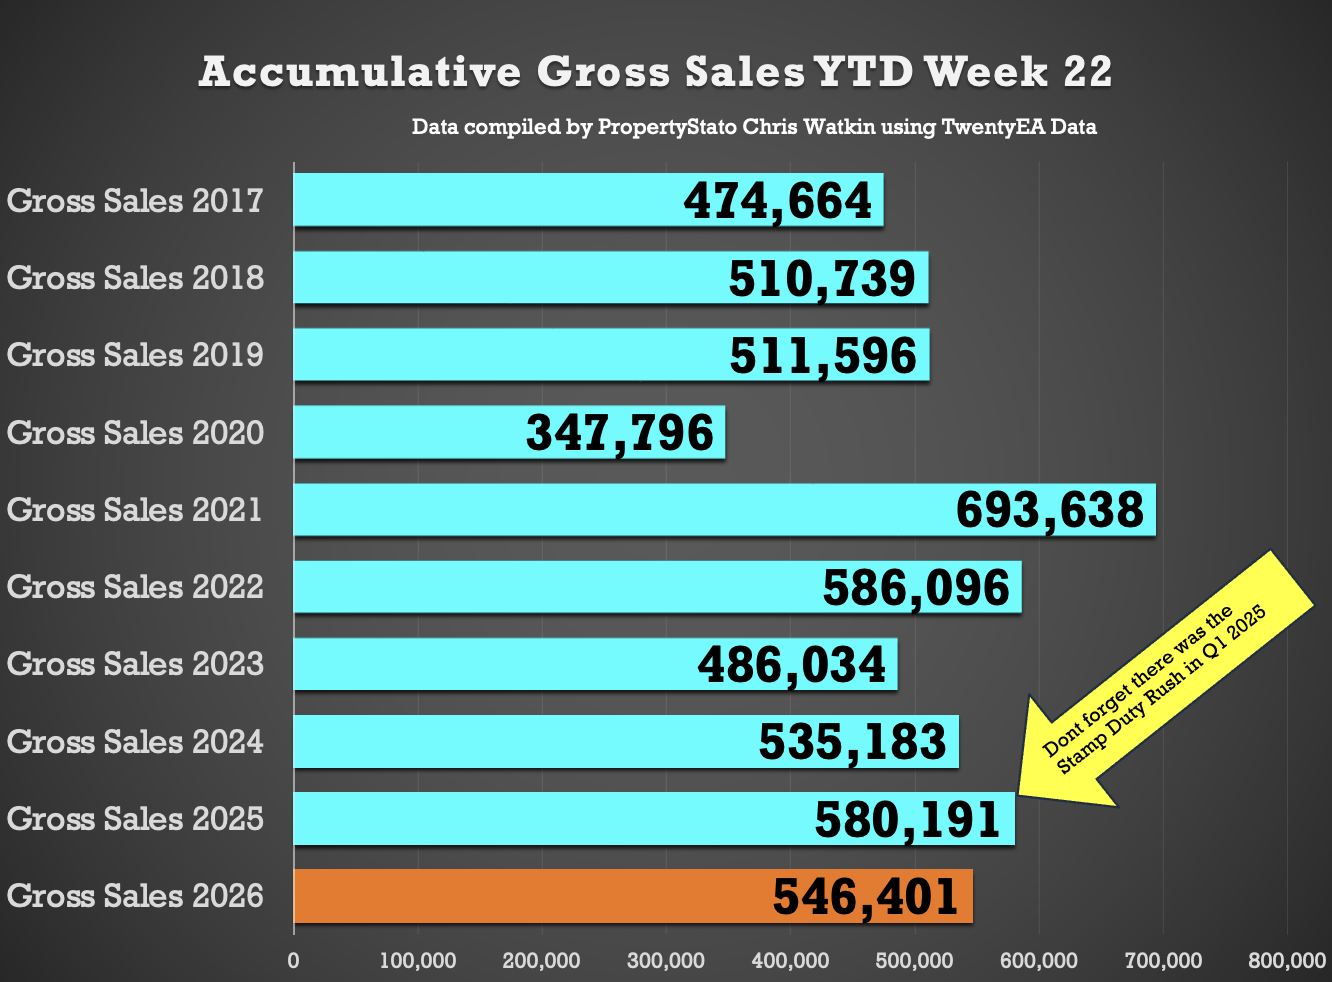
546k UK homes sold stc YTD
5.8% lower than 2025 YTD (581k) – as has been experienced since the start of the year
Yet still Gross Sales are still …
+ 2.1% higher than 2024 YTD (535k)
+ 12.4% higher than 2023 YTD (486k)
+ 9.6% higher above pre Covid 2017-19 years (475k).
What does all mean?
Yes, sales agreed were down in the first week of June 2026 compared with the first week of June 2025. But here is the bit many people will miss.
The average price achieved per square foot rose from £343.77 in April 2026 to £349.64 in May 2026, meaning house prices increased of 1.7% last month.
So, this is not a collapsing British property market. It is a more selective market.
Fewer homes are getting buyers, but the homes that are selling are still achieving strong values. That tells us something important. Buyers have not disappeared. They are simply being more careful about what they buy, what they pay, and whether the price stacks up.
For sellers, the message is clear. The market is still there, yet it rewards realism, presentation & proper marketing far more than wishful thinking.
For estate agents… stop overvaluing and timing people up for 20 to 26 week sole agency agreements. You are a disgrace to the industry that your ego needs the listing more than the homeowner wants the sale. Only 54% of the homes that get listed end up exchanging (35.6% in Inner London and 27.5% in the W Postcode). And long sole agency agreements of 20 weeks plus are there for your and only your benefit. If an agent needs 26 weeks to prove they are good, they probably are not.
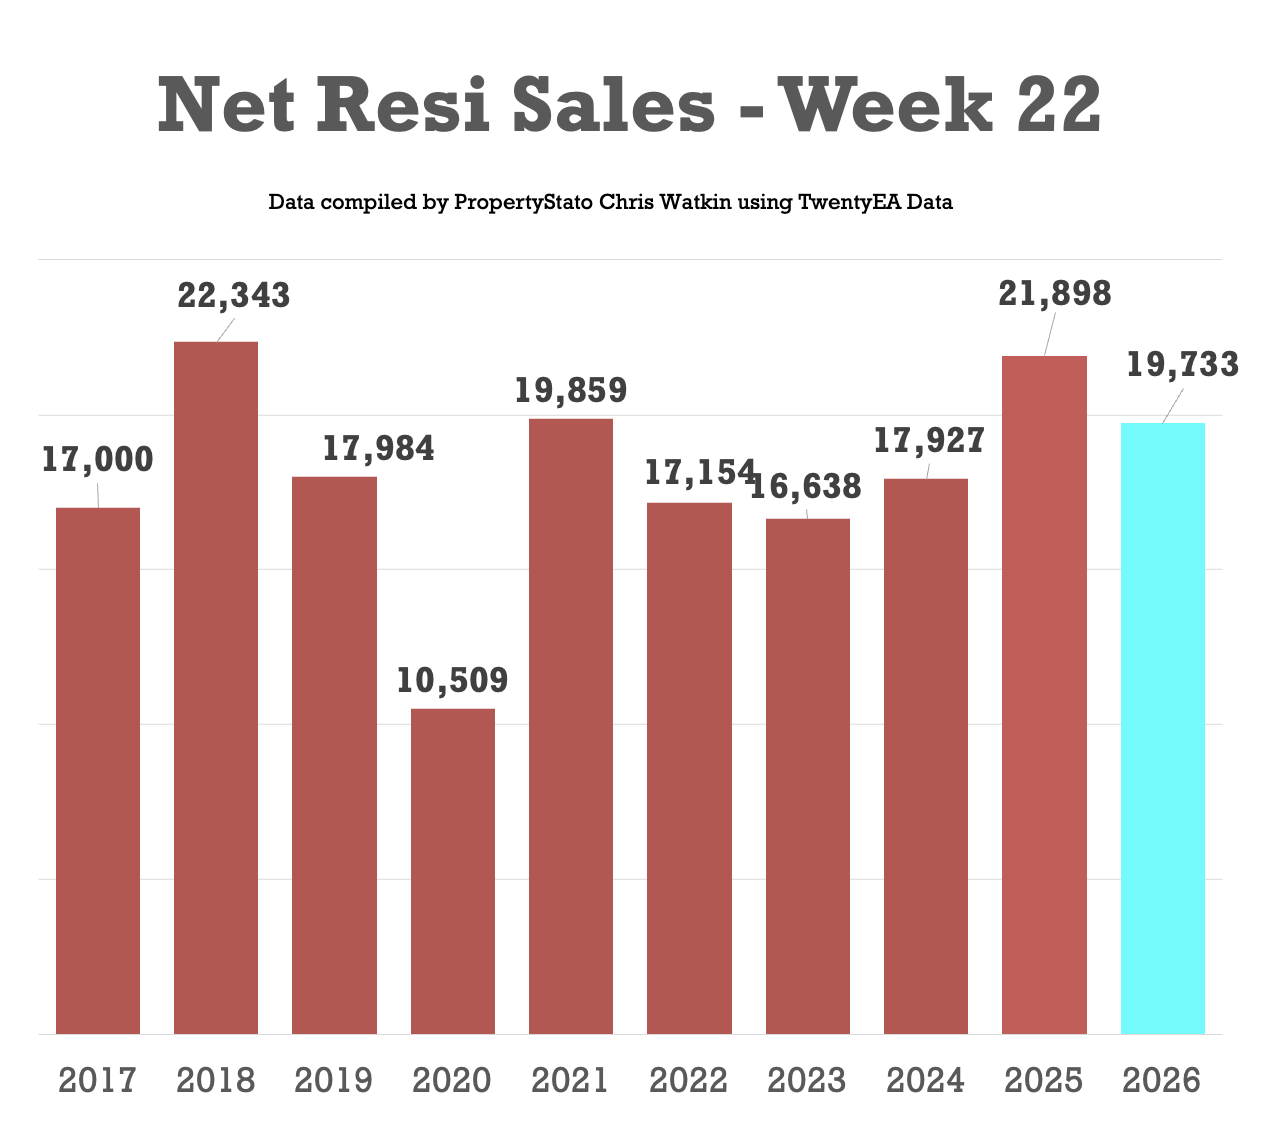
🟩 UK Net Resi Sales YTD
(Net Sales being Gross Sales less Sale Fall Thrus).
Week 22
19.7k Net Sales (17.3k last week – which was a Bank Holiday though)
10 year Week 22 average: 18.1k.
Weekly average for 2026: 19.4k.
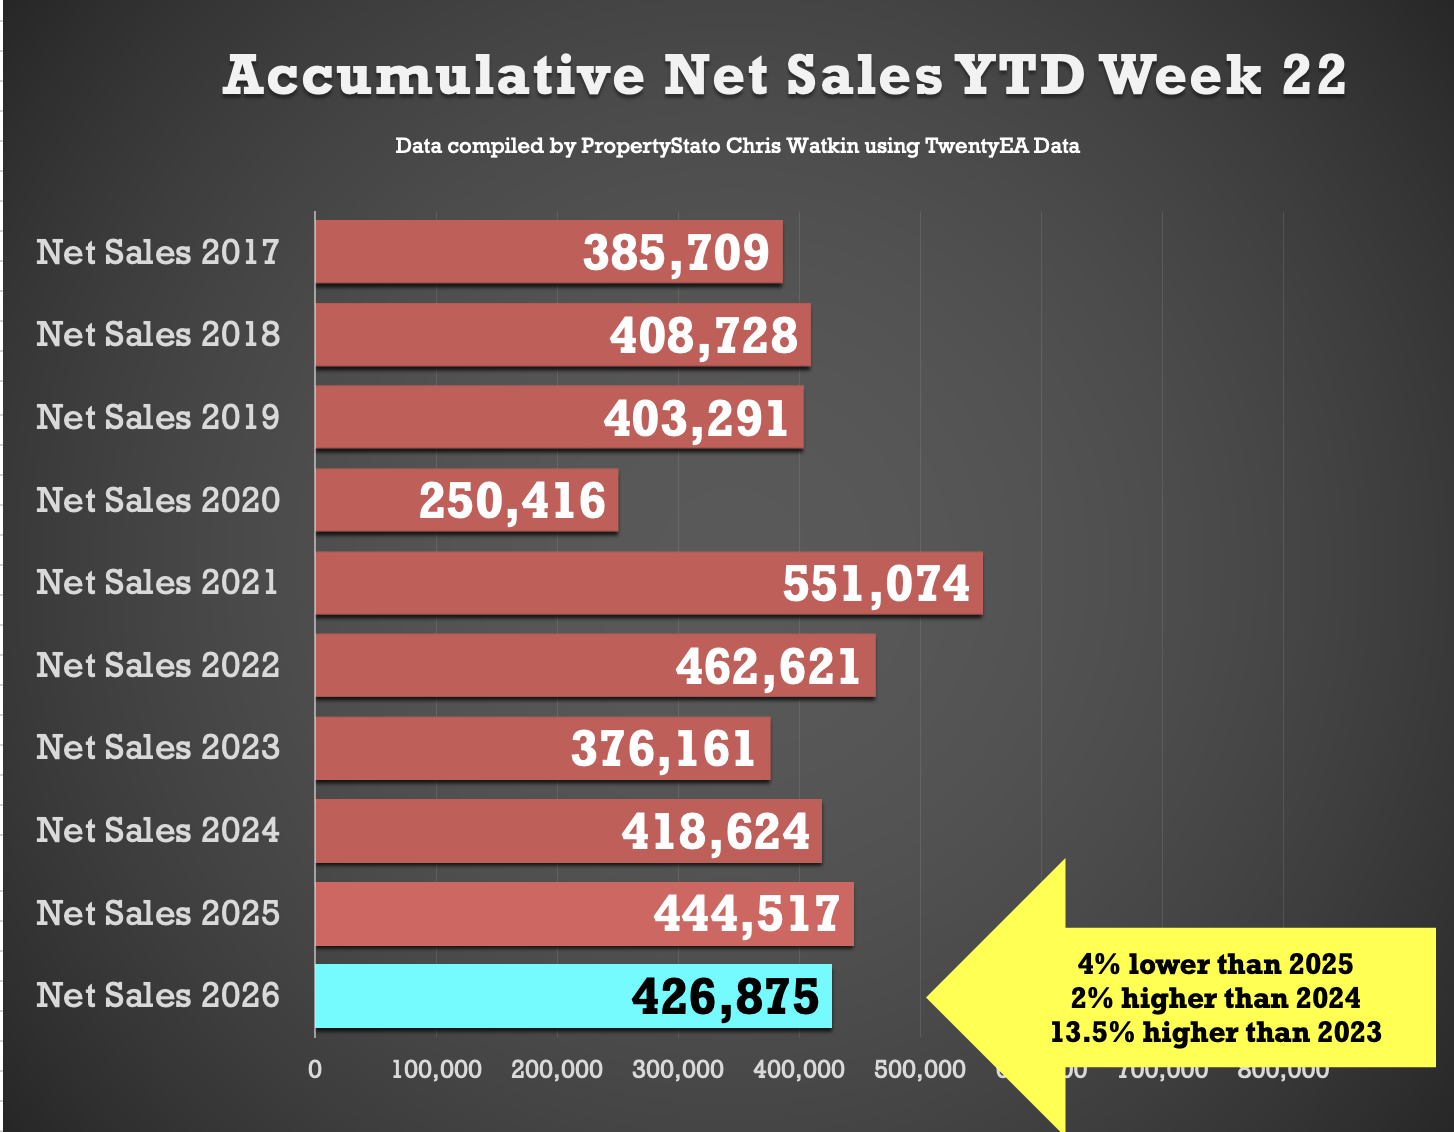
Year to Date
427k UK net home sales YTD
4% lower than 2025 (445k),
2% ahead of 2024 (419k),
13.5% ahead of 2023 (376k)
6.9% above the 2017–19 average (399k).
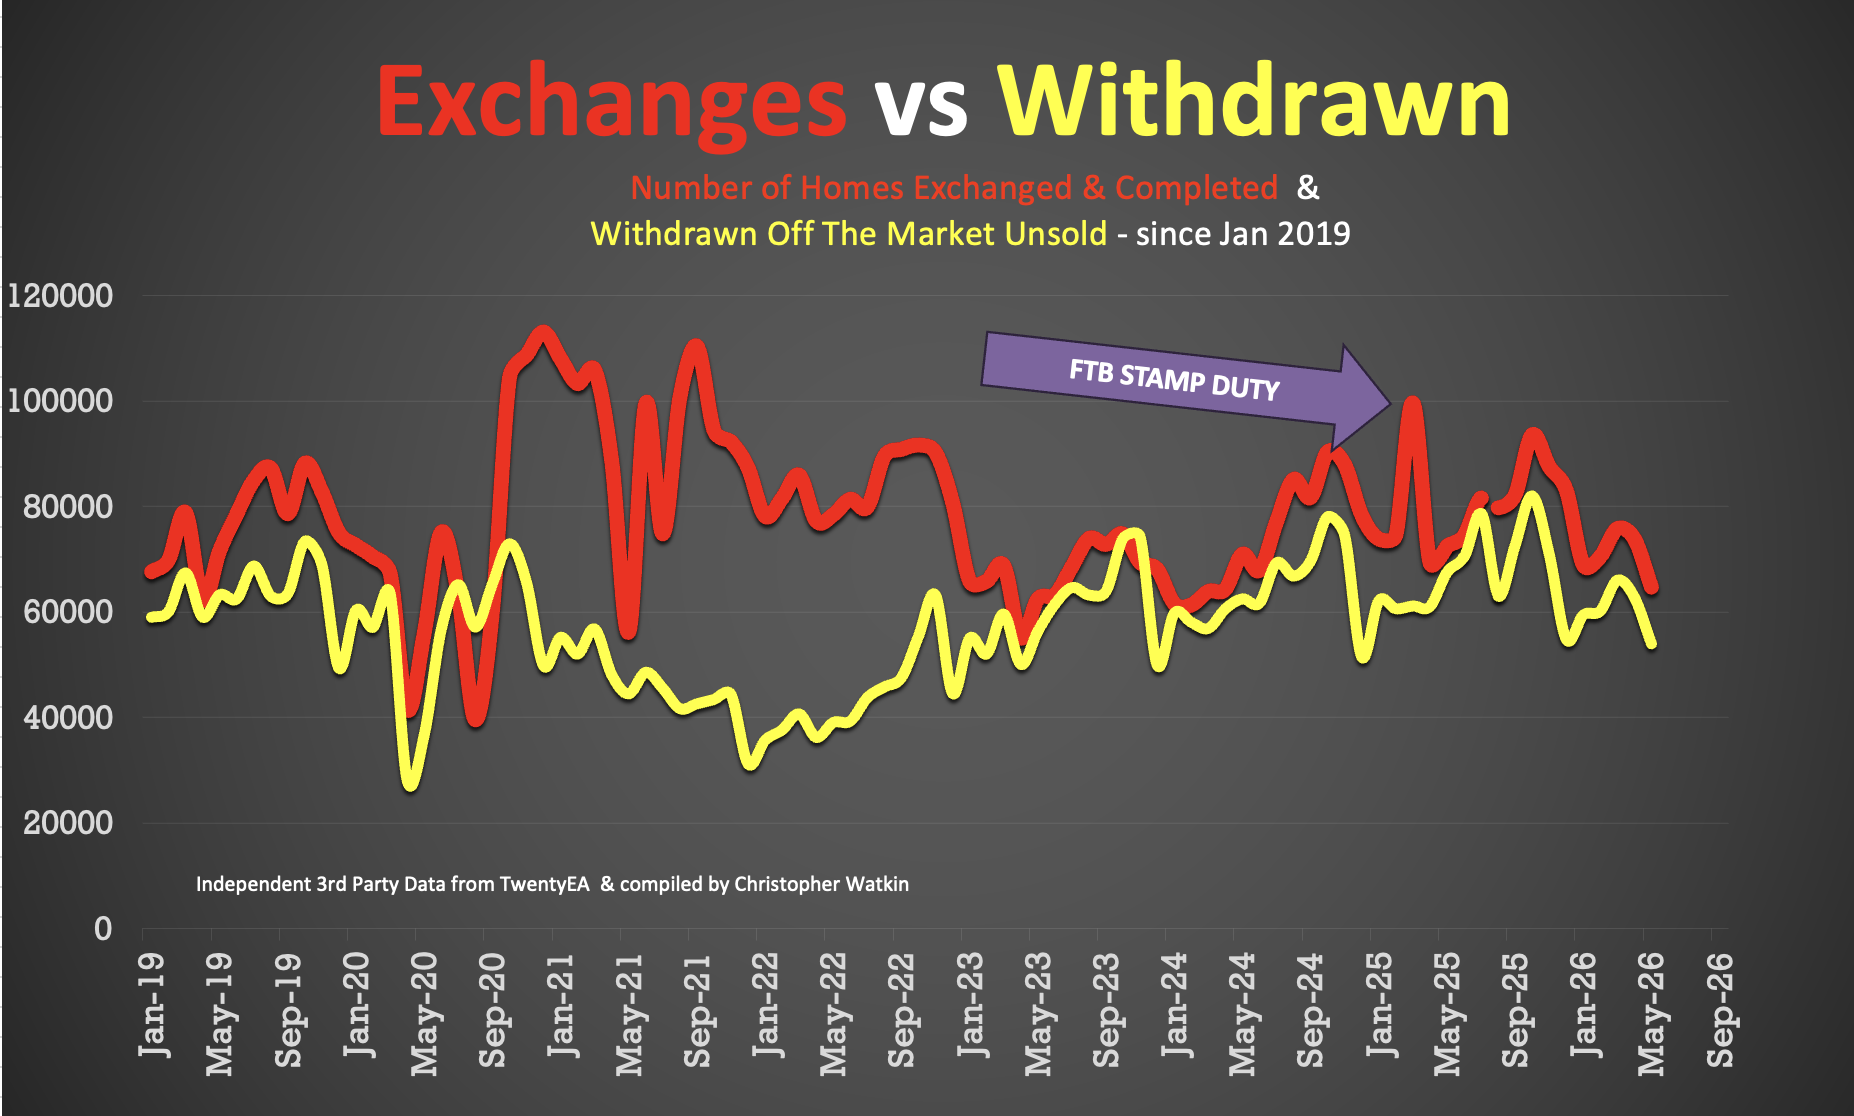
🟩 Exchanges
• May 2026 – 64.7k Exchanges – note this figure will increase throughout June as more May exchanges come thru the system
• 356k UK Exchanges YTD to end of May 2026. 7.8% lower than Jan to April 2025, when it was 386k. NB. There were more exchanges in Q1 2025 because of the stamp duty holiday which finished in April 2025. Also expecting an additional 7k to 10k exchanges in May.
Additional info …
🟥 Price Reductions
• 28k reductions this week on a 747k UK homes for sale
• 13.4% of UK homes for sale were reduced in May.
• 2025 average 12.8%, versus the 6-year long-term average of 10.7%.
🟥 Withdrawals
• May 2026 – 54k Withdrawals – again, this figure will increase as more May withdrawals come thru the system throughout June
• That means that 45.5% of all homes that left UK Estate Agent books in May went unsold.
🟥 Price Difference between Asking Price of Listings & Asking Price of those Homes that go Sold stc
• 20.8% difference (long term 10 year average is 16% to 17%). (£452k ave Listing Ave Asking price vs £374k Sale Agreed ave Asking price)
🟥 Sell-Through Rate
• 14.6% of homes on agents’ books went SSTC in May ’26.
• Pre-Covid average: 15.5%.
🟥 Sale Fall-Thrus
• Fall-thru rate 23%
• Decade average: 24.5%
• 5.05% of homes sold STC fell thru in May 2026, below both the 2025 average of 5.3% and the 10 year average of 5.8%. (May figures to follow next week)
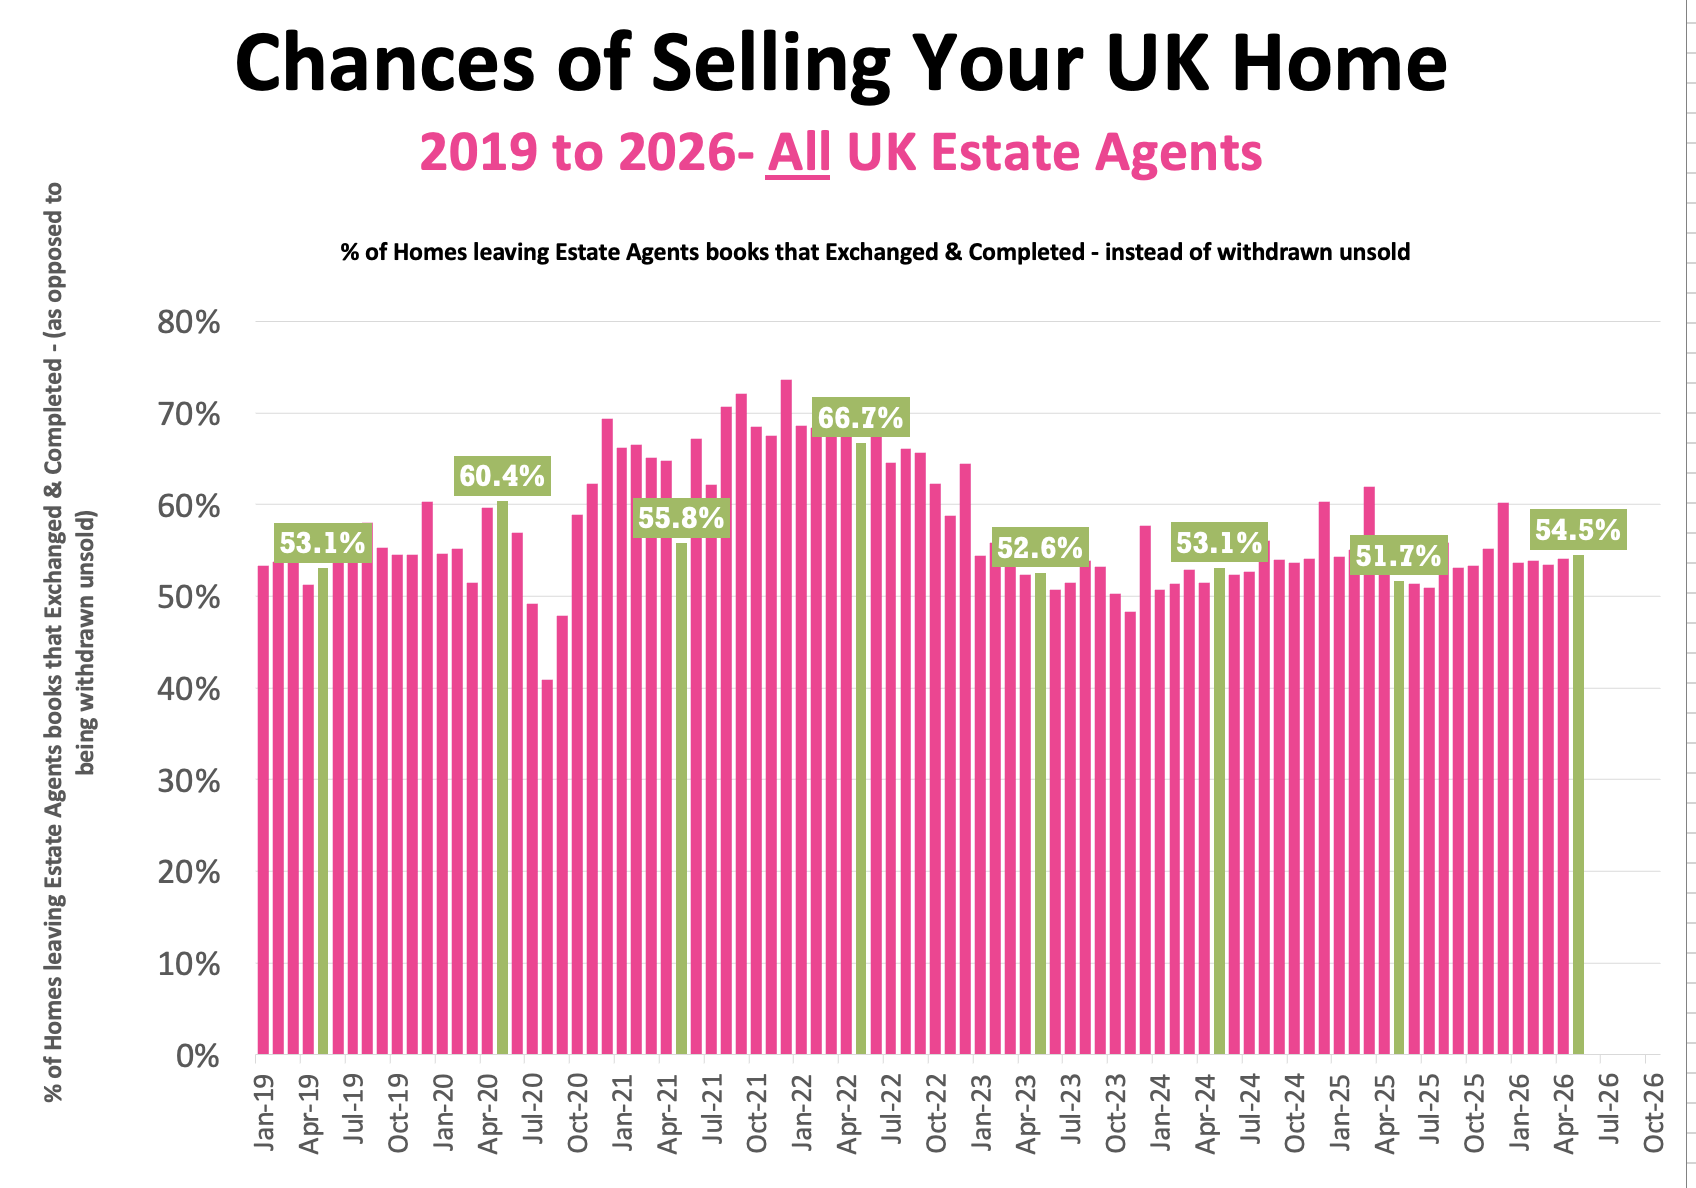
🟥 Probability of Selling (% that Exchange vs withdrawal)
• May 2026 Stats : 54.5% of homes that left agents’ books exchanged & completed in May. (Note this figure will change throughout the month as more May stats come in).
• 57.6% is the 7 year average (which includes the crazy years post lockdown 18 months).
🟥 Stock Levels
• 747k homes on the market on the 1st of June ’26.
• IMPORTANT – Still to receive the May’s Sales pipelines figures .. so looking at the previous months figures … 461k homes in agent’s sales pipeline on the 1st May 2026, slightly higher than 12 months ago on 1st May ’25 (447k).
🟥 House Prices (£/sq.ft)
• May ’26 agreed sales averaged £349.64 per sq.ft. 1.9% higher than 12 months ago (£342.87) and 13.2% than 5 years ago (£308.94).
The £/sqft at sale agreed matches the HM Land Registry Index with a 98% accuracy, 5 months in advance. That is why it is so important.
🟥 UK Rental Data
• Average Rent in Wk 22 – £1,775 pcm
• Average Rent in May 2026 – £1,785 pcm (£1,779 in May 25)
• Average Rent in YTD 2026 – £1,744 pcm
• 305k UK Rental Stock available to rent in May 26 (311k in May 2025)
🟥 Local Focus this week in the Show
East Grinstead
Buyer enquiries remain below last year’s levels, says Rightmove
