


The headlines for the 12th week of the 2026 UK Property Market (week ending Sun 29th March 2026)
🟩 Listings YTD
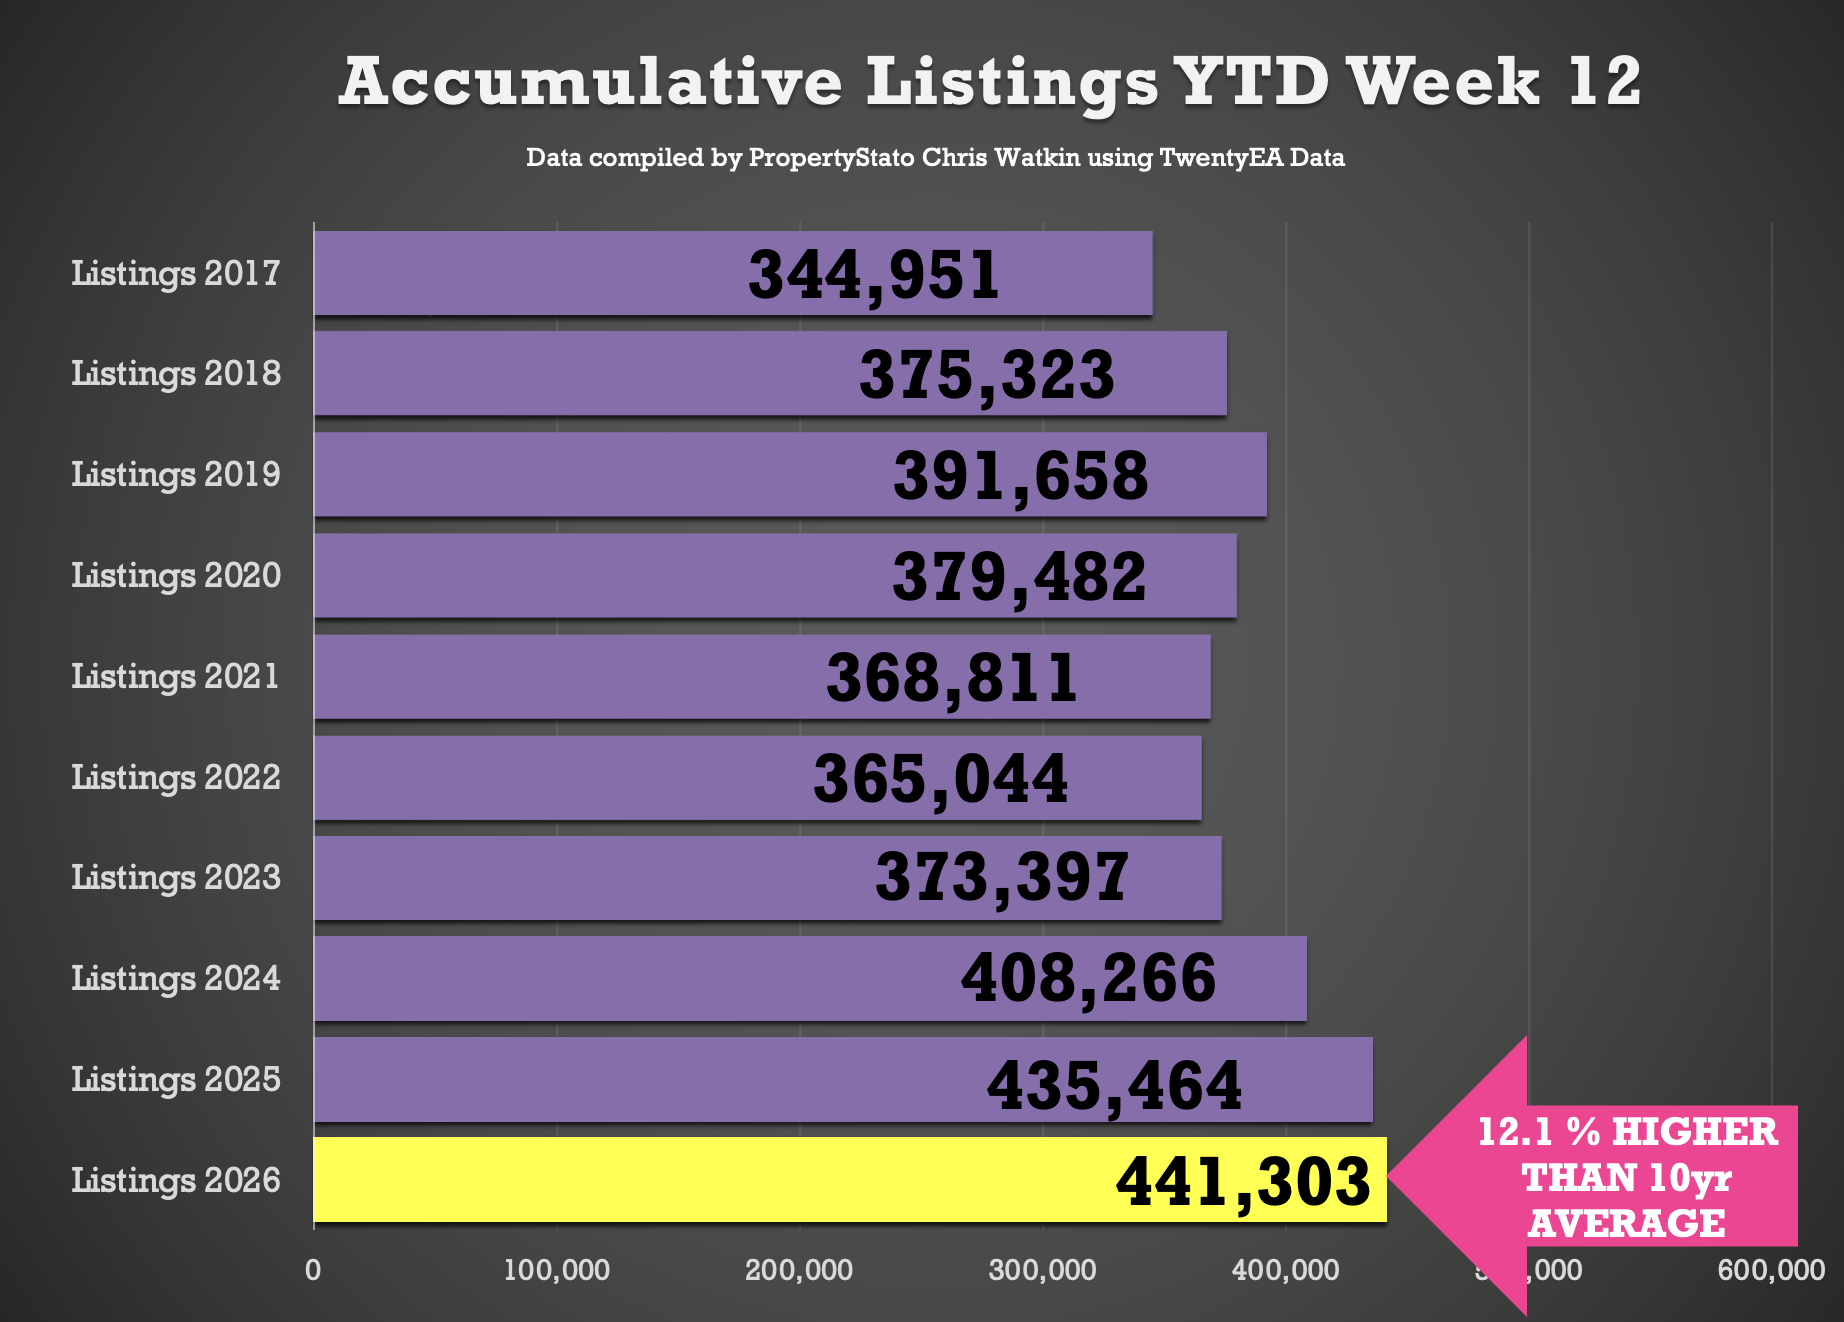
441k new properties have come onto the market YTD , 1.3% ahead of 2025, 8.1% above 2024, and 19.4% higher than the 2017–19 average.
🟧Gross Sales YTD
298k UK homes sold STC YTD , 5.4% lower than 2025, 7% higher than 2024, and 16.6% above pre Covid norms.
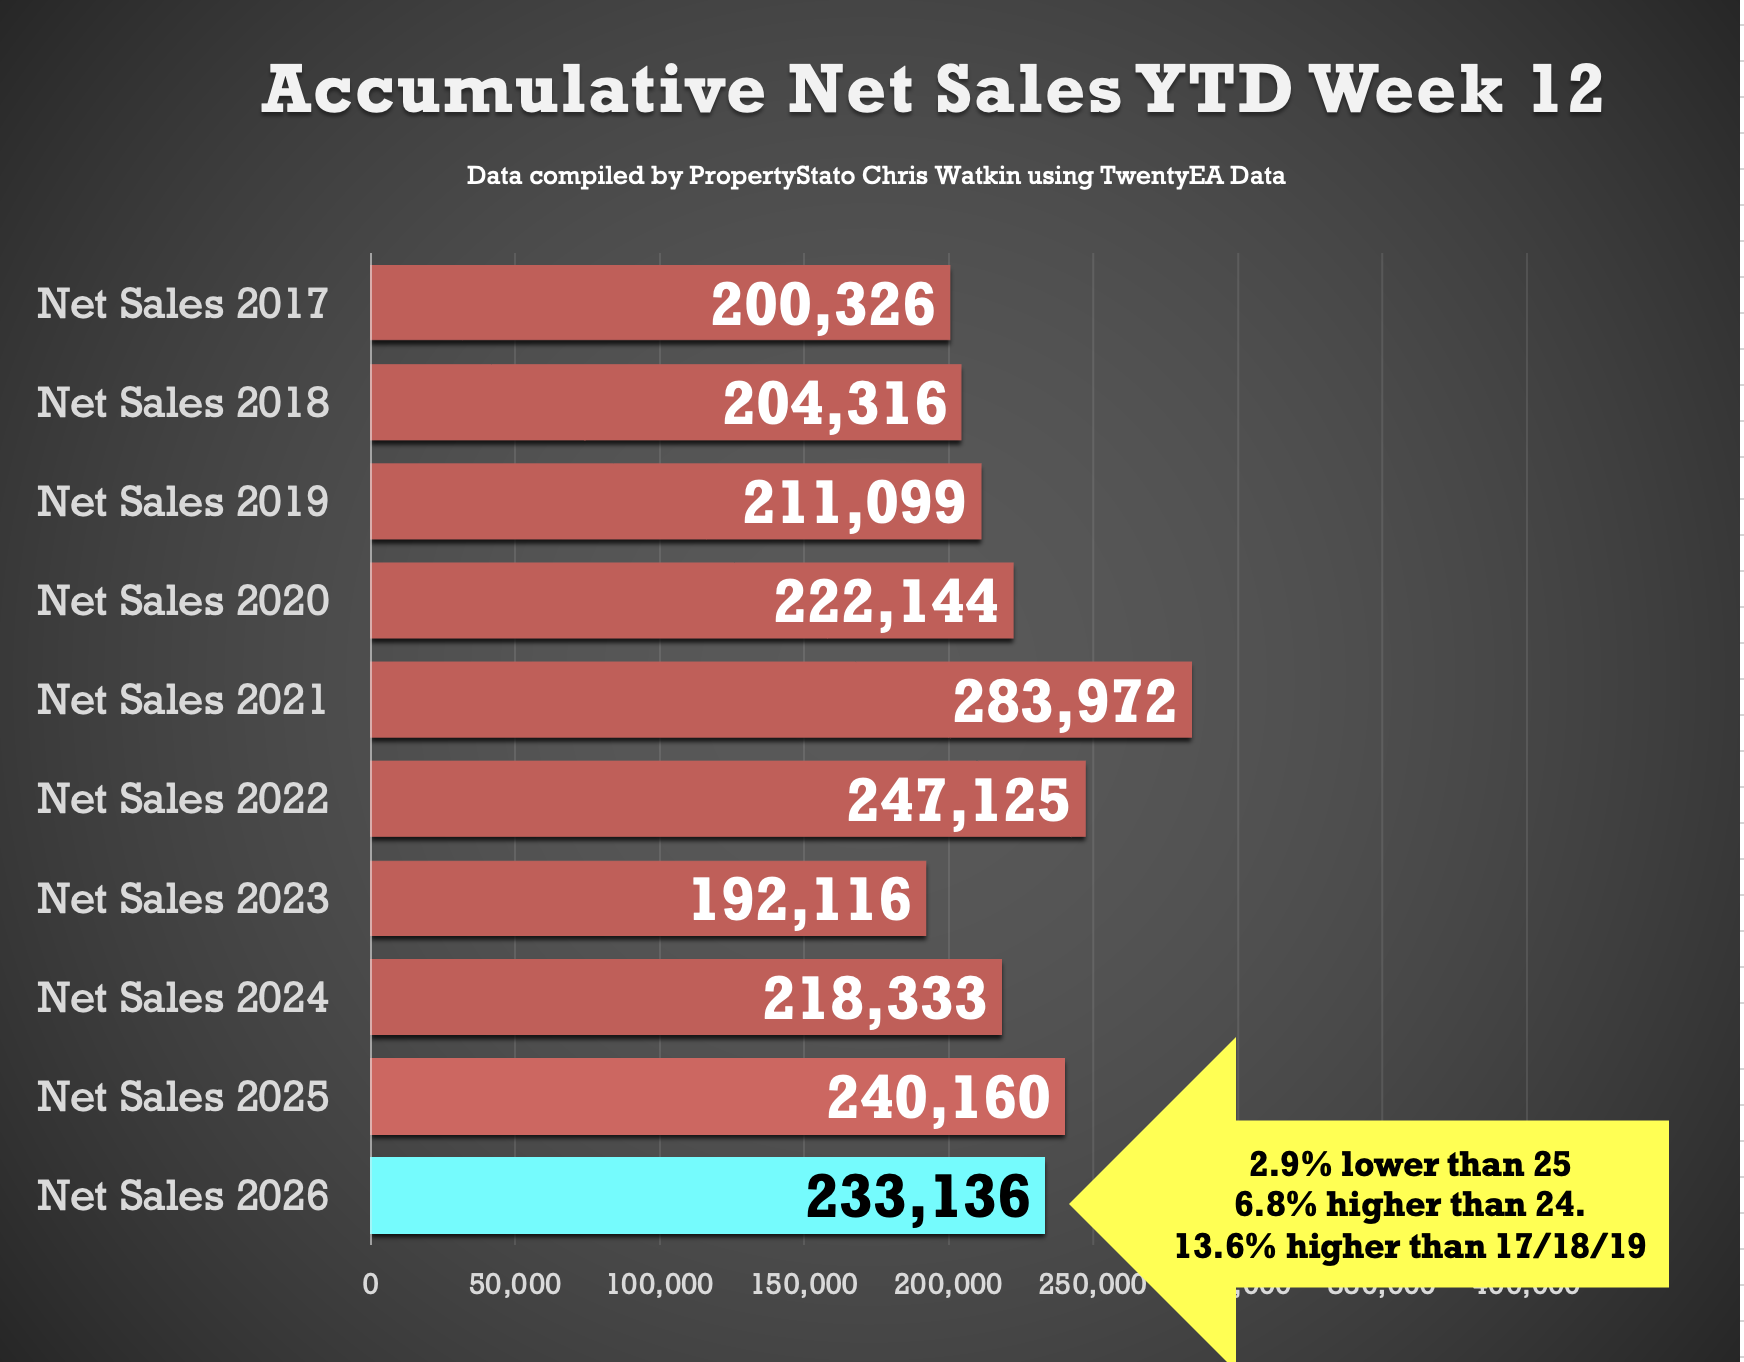
🟩 Net Sales YTD
233k UK net home sales YTD (Net Sales being Gross sales less Fall Thrus). 2.8% lower than 2025 (240k), 6.8% ahead of 2024 (218k), 21.4% ahead of 2023 (192k) and 13.6% above the 2017–19 average (205k).
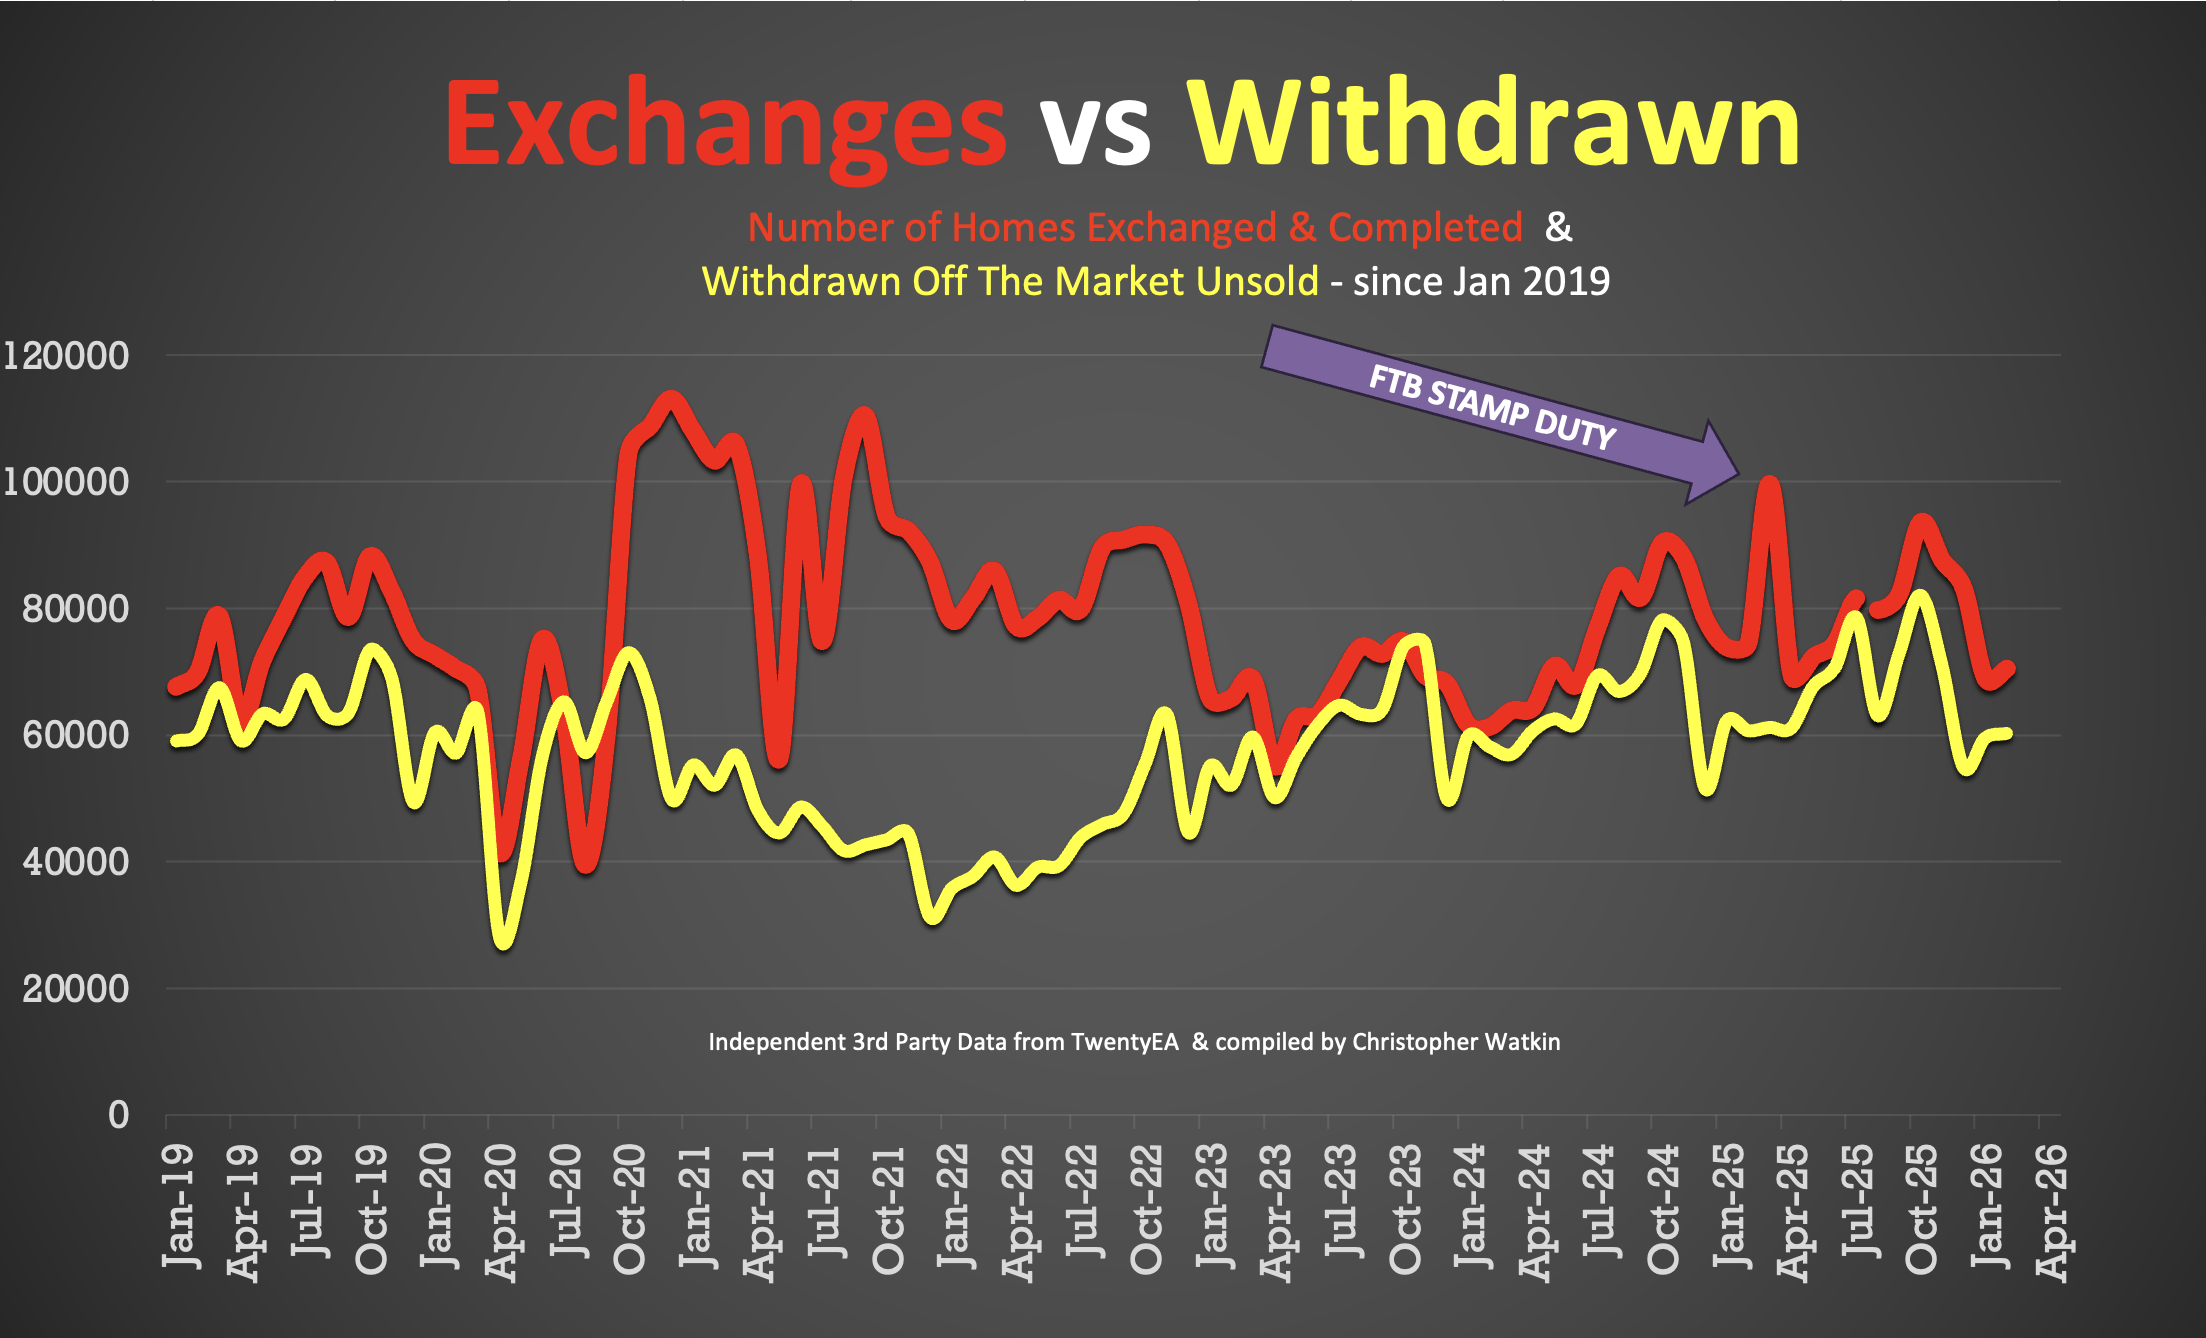
🟥 Exchanges YTD
139k UK Exchanges to the end of Feb 26
5.5% lower than end of Feb 2025, when it was 147k.
🟥 Overvaluing
46.1% of the homes that left UK Estate Agents books in February were withdrawn unsold. Main cause – blatant overvaluing supported by long sole agency agreements of 20+ weeks.
Detailed Breakdown …
✅ New Listings
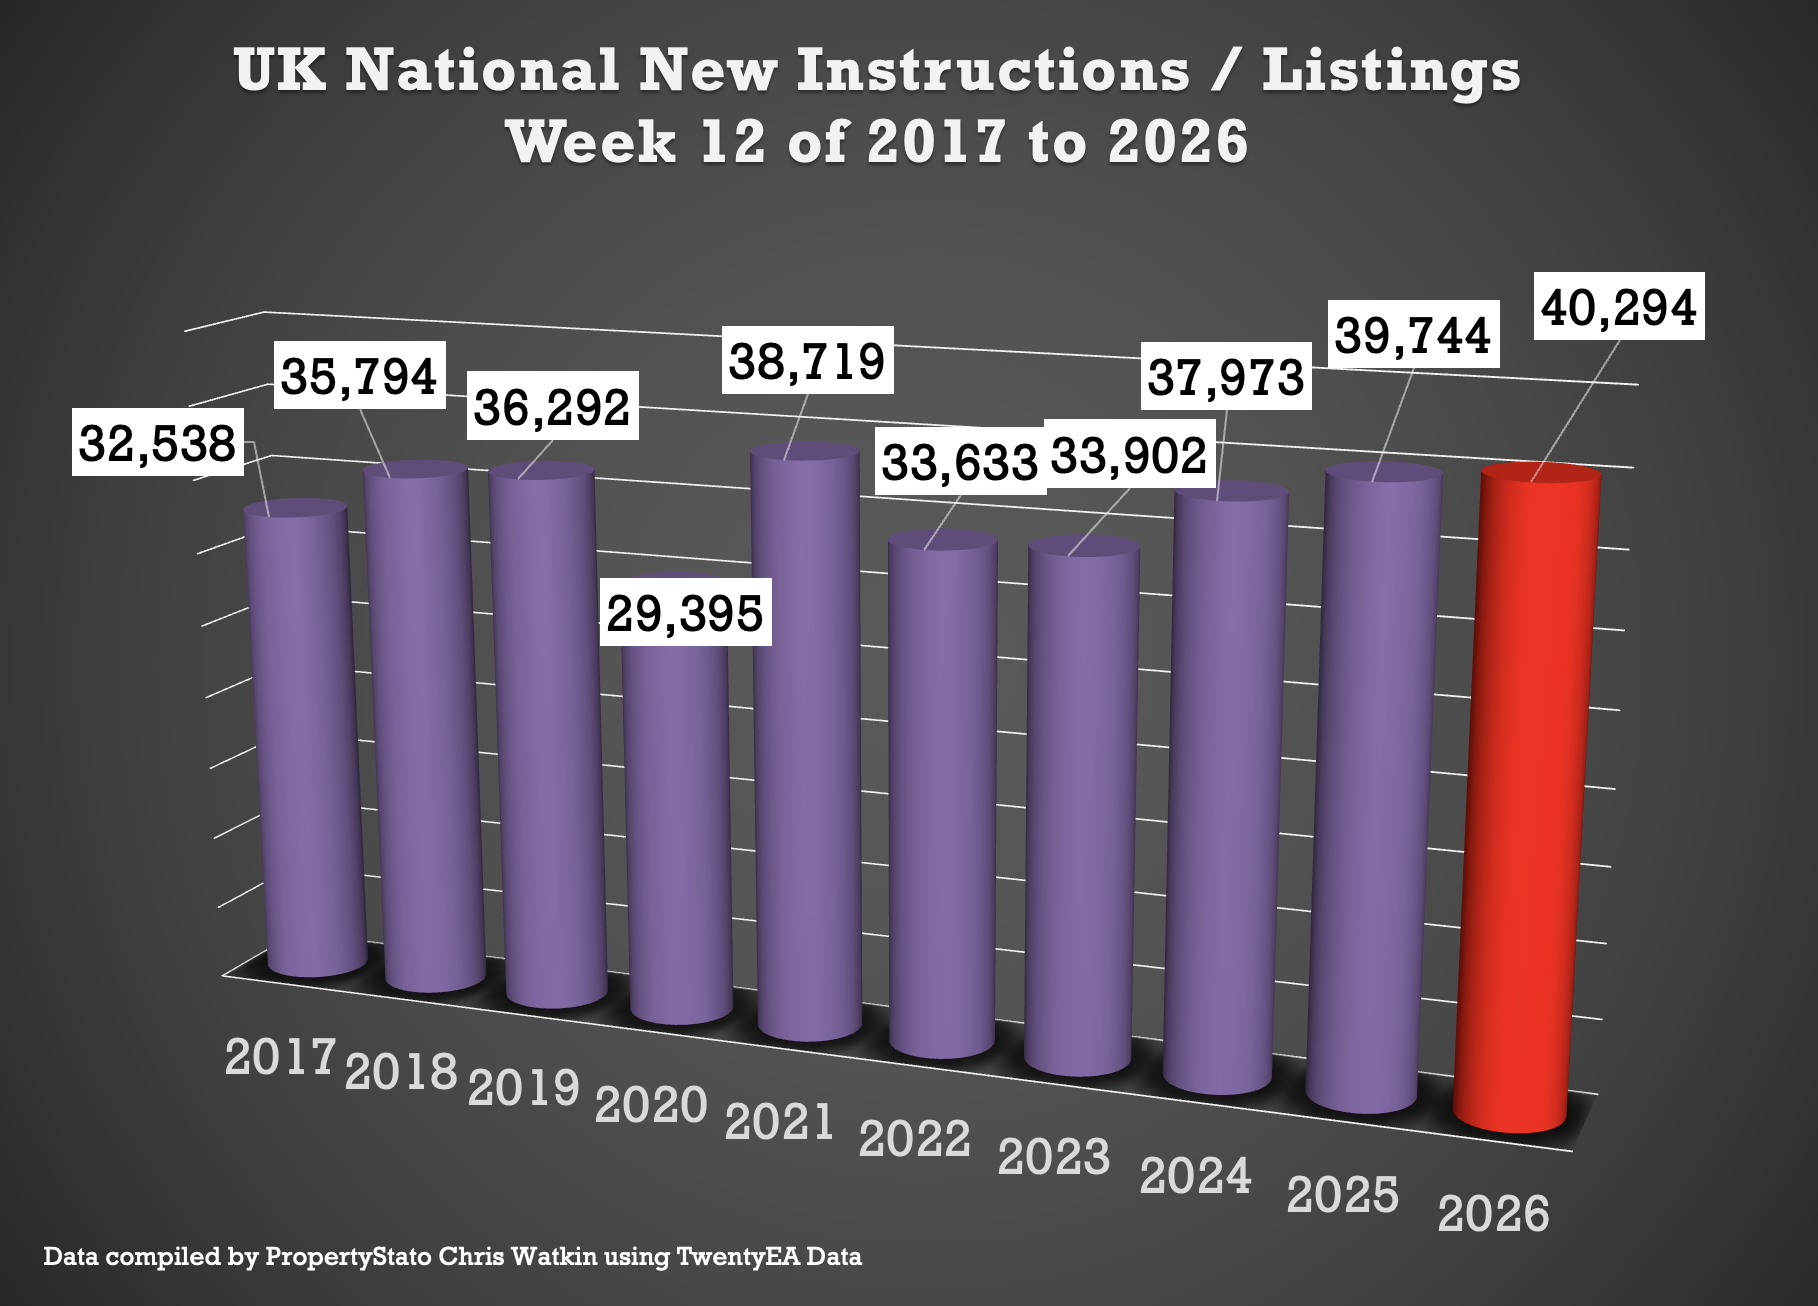
• 40.3k new properties came onto market this week, down marginally from 39.4k last week.
• 2025 weekly average: 30.6k.
• 10-year week 12 average : 35.8k.
• 2025 weekly average: 30.6k.
• 10-year week 12 average : 35.8k.
✅ Price Reductions
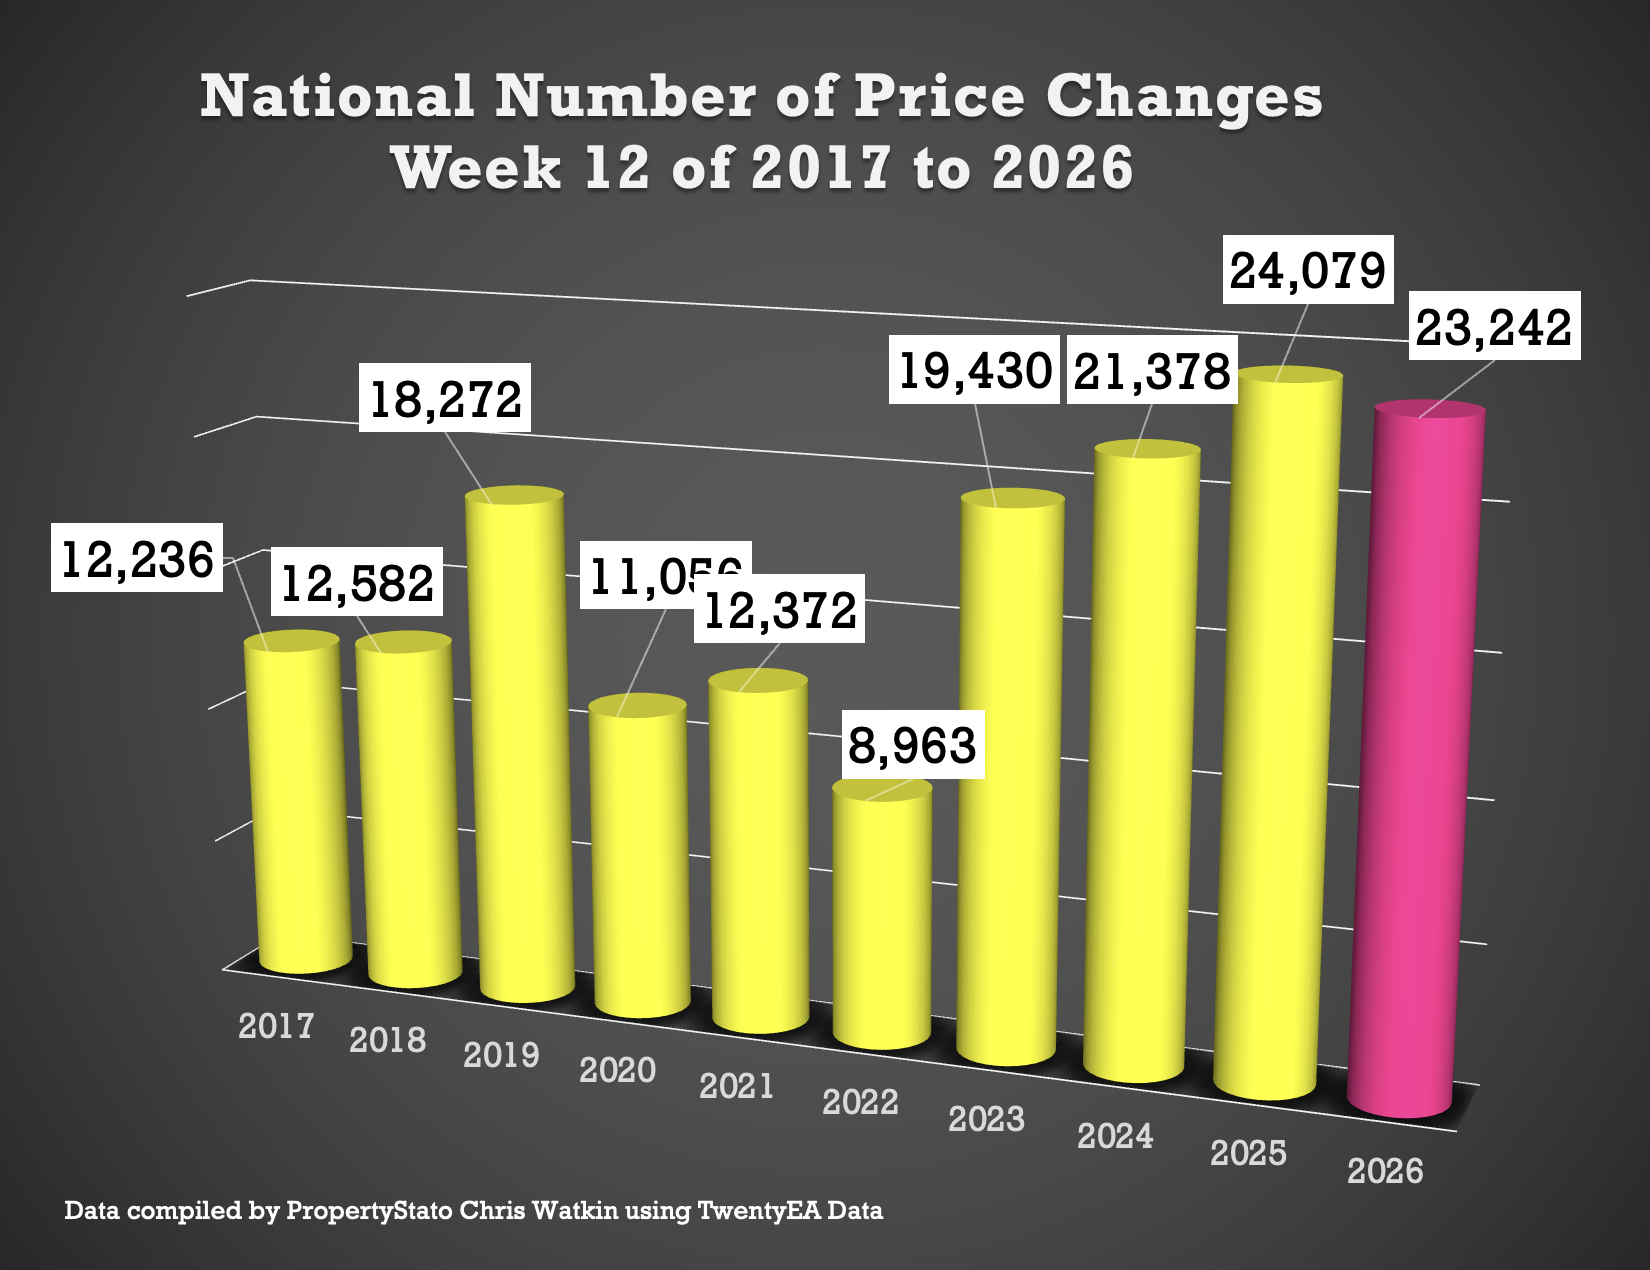
• 23.2k reductions this week, down from 23.6k last week
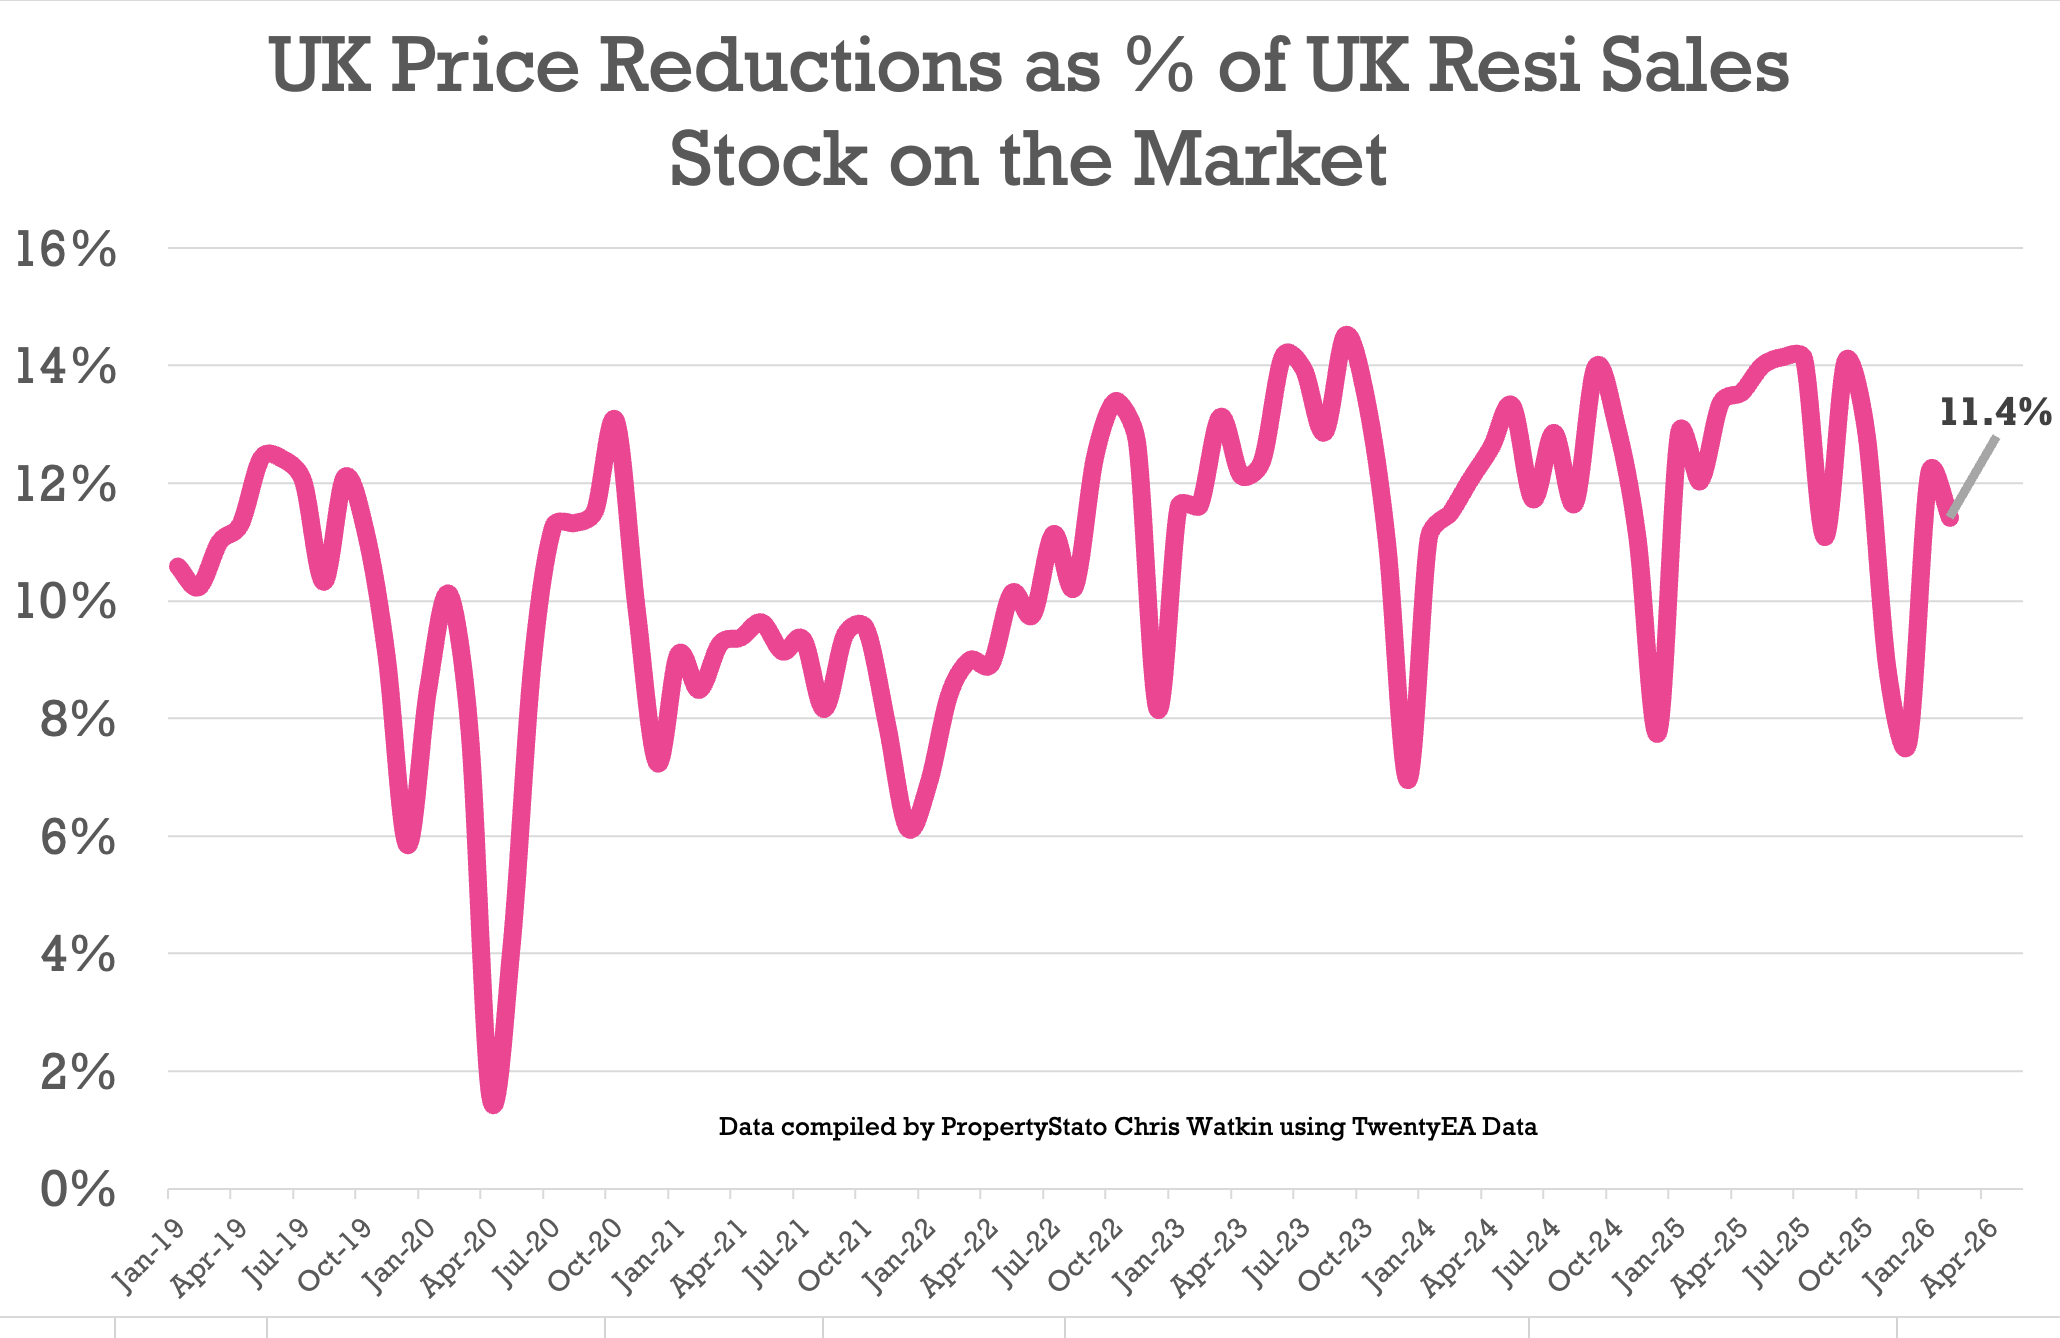
• 11.4% of resi homes for sale were reduced in February. Feb 25 – 12%. Feb 24 – 11.5% (March figures to follow next week)
• 2025 average was 12.8%, versus the 6-year long-term average of 10.7%.
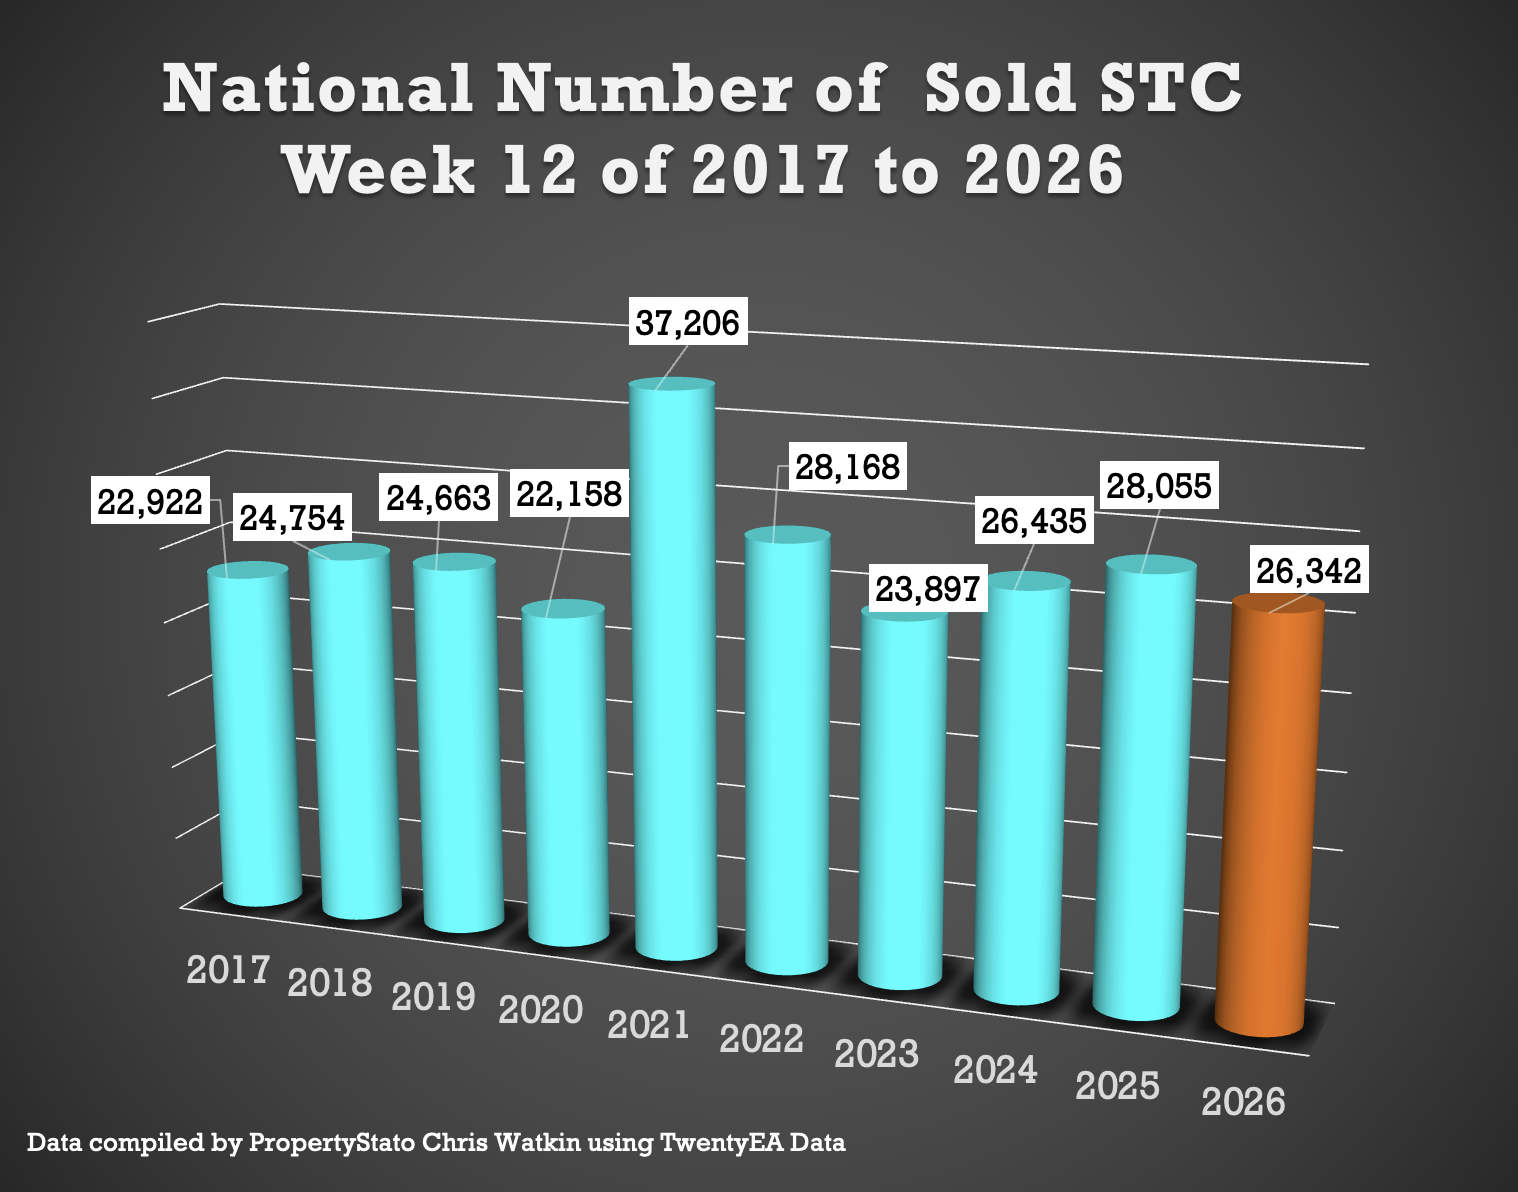
✅ Sales Agreed
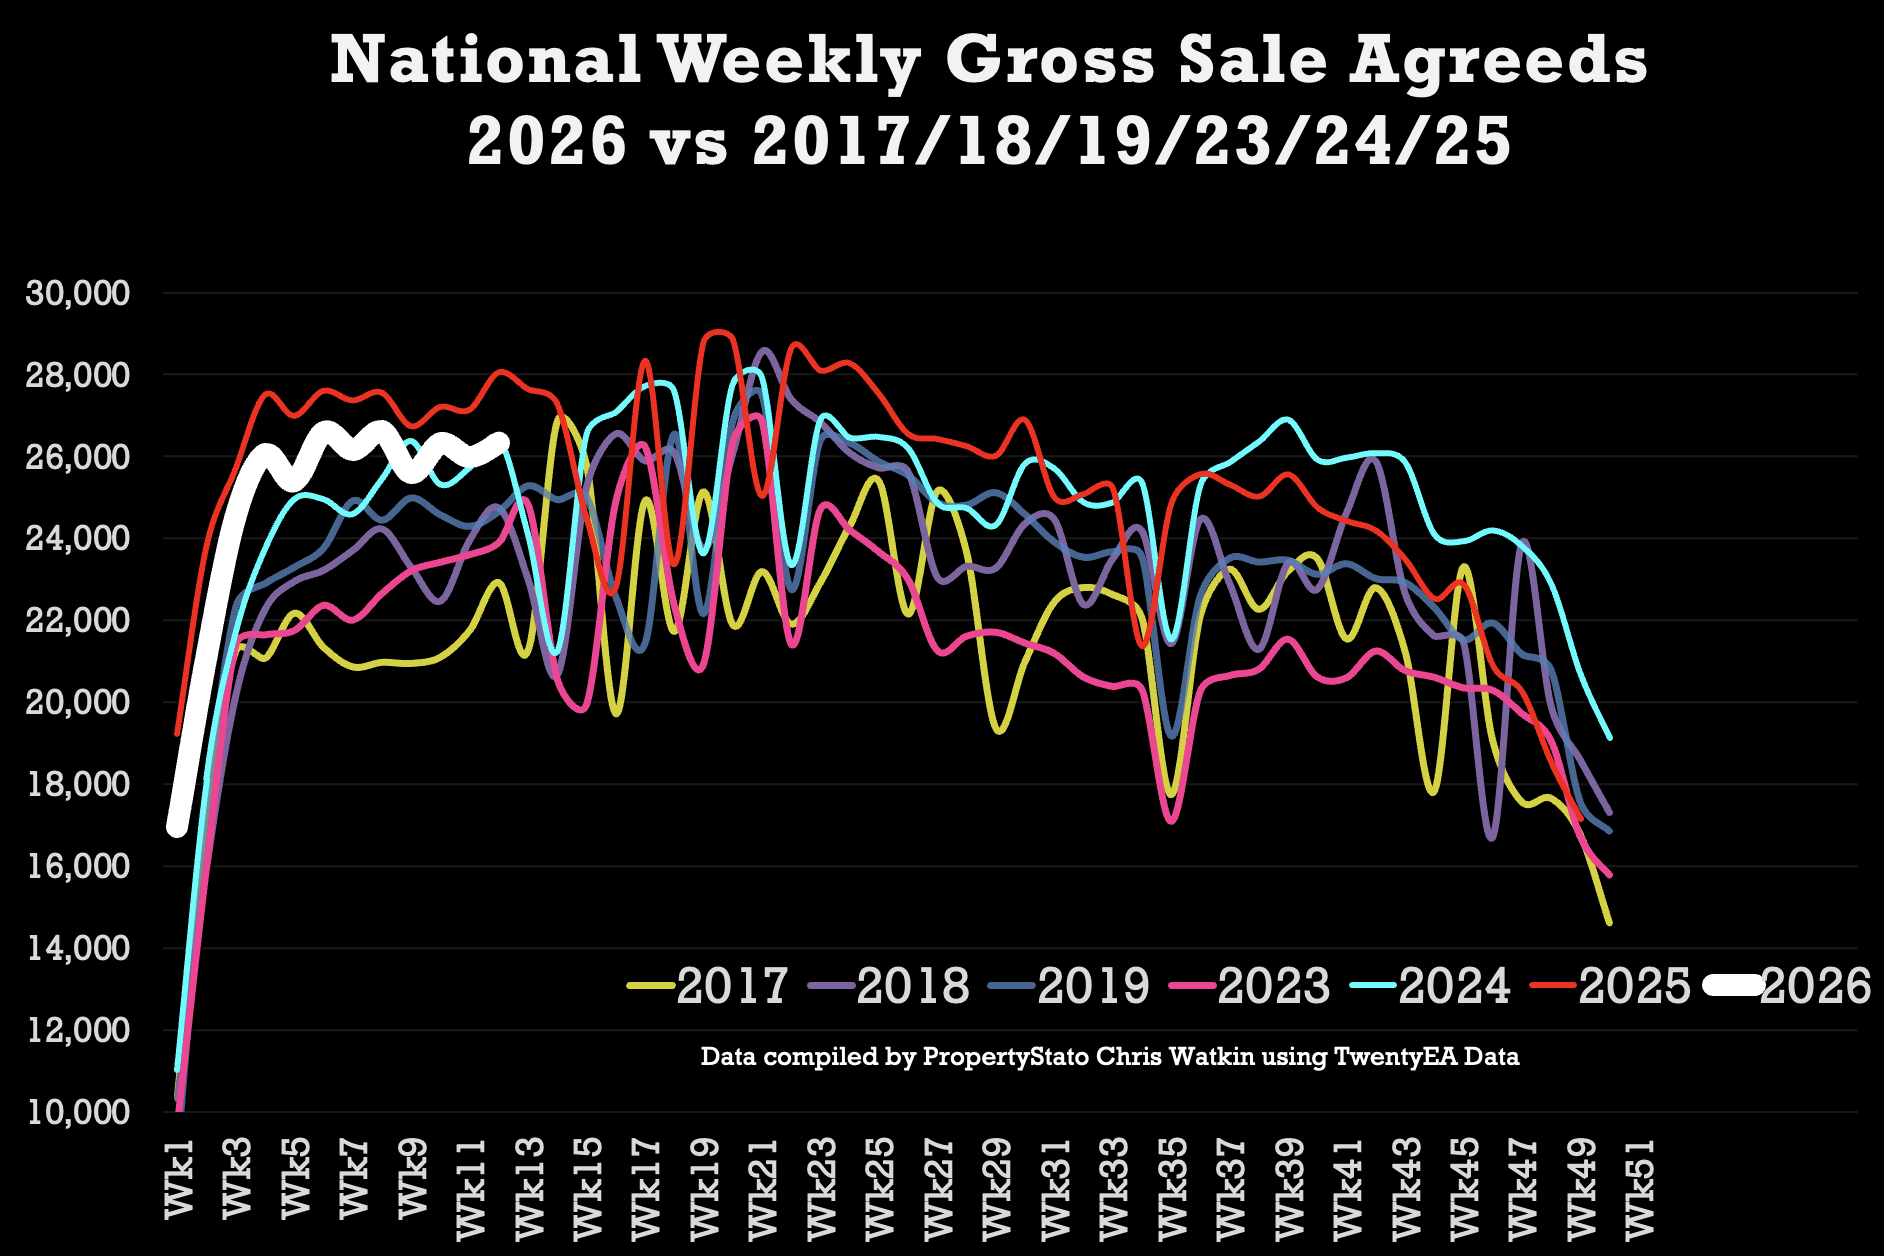
• 26.3k homes sold stc this week 12, up from 26k last week.
• Week 12 average (for last 10 years which includes the post pandemic boom) : 26.5k
• 2026 weekly average : 24.2k.
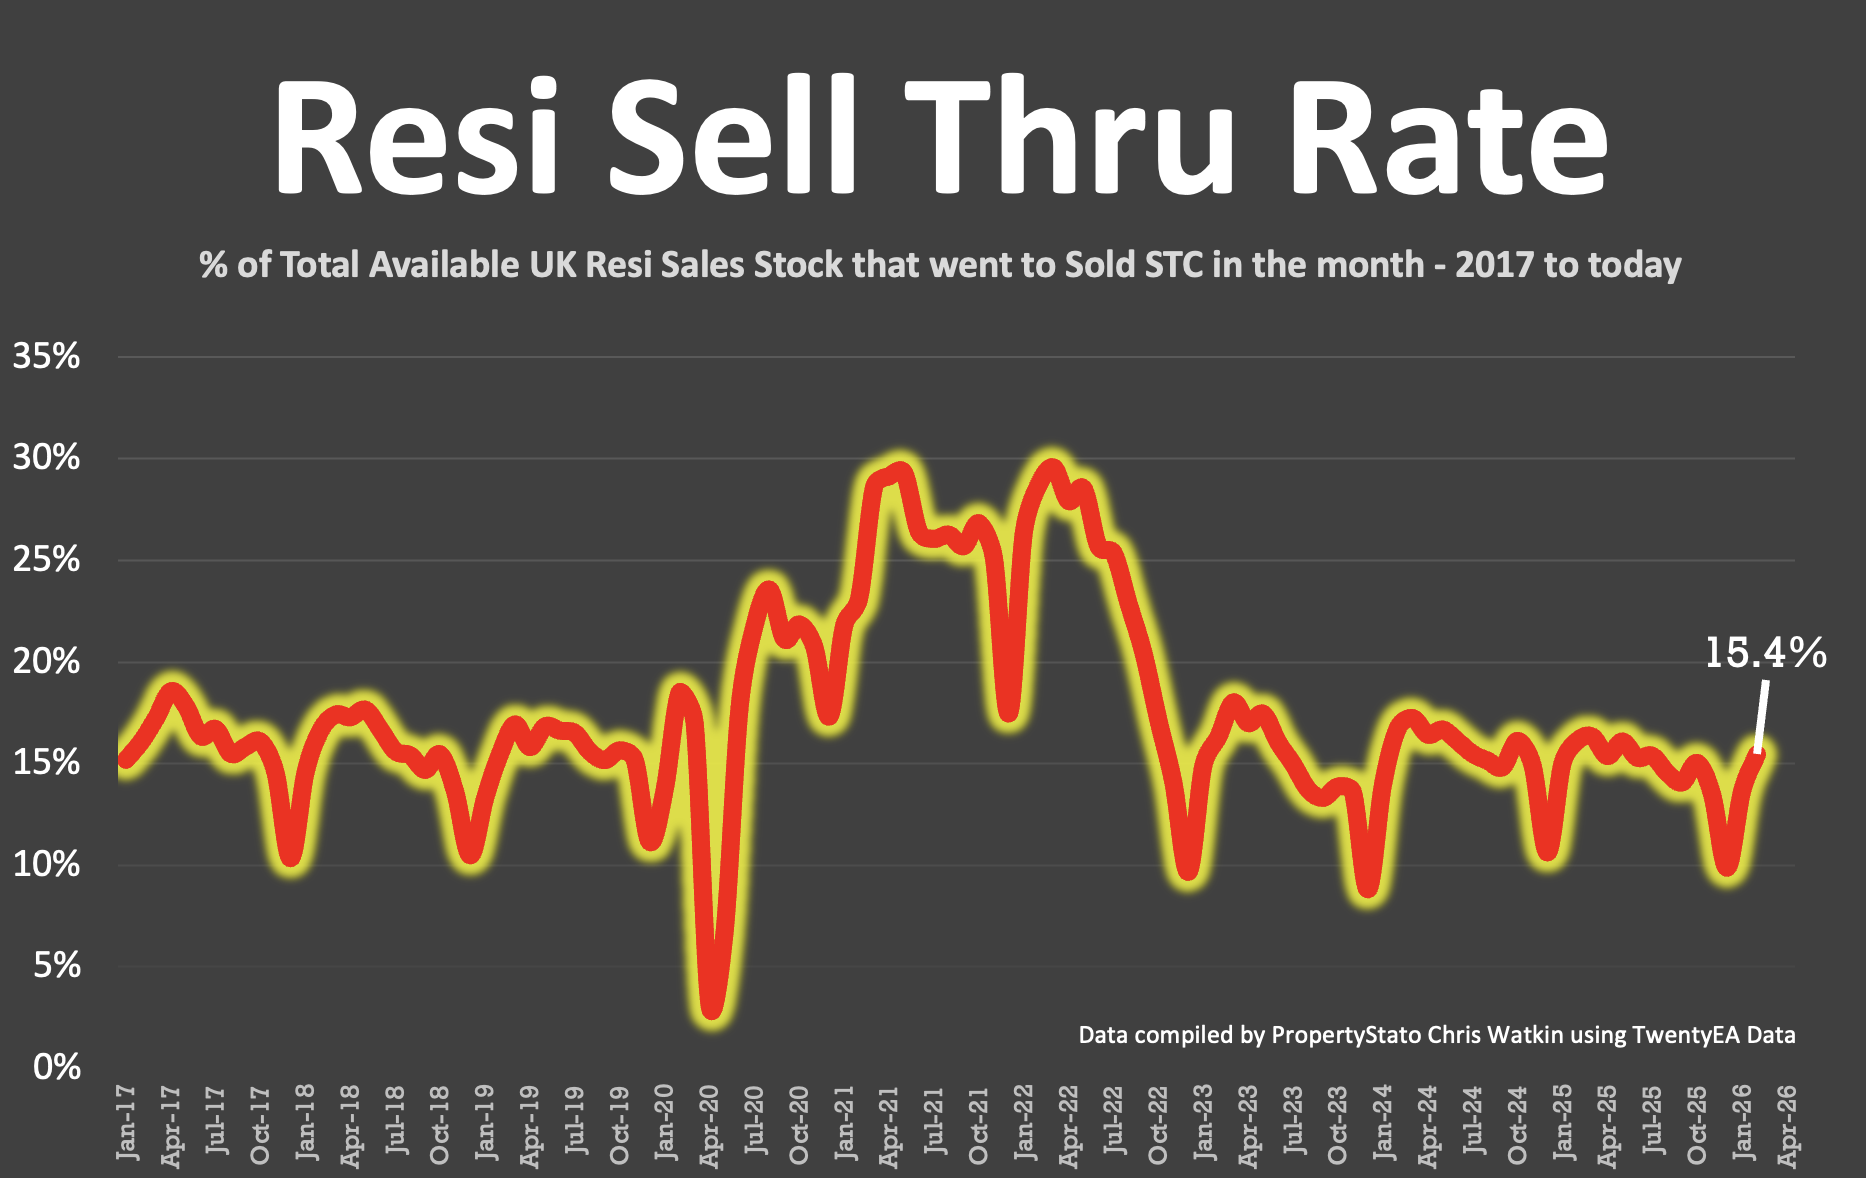
✅ Sell-Through Rate
• 15.4% of homes on agents’ books went SSTC in February ’26. (Feb ’25 – 16.1% / Feb ’24 – 16.7%) – March figures to follow next month.
• Pre-Covid average: 15.5%.
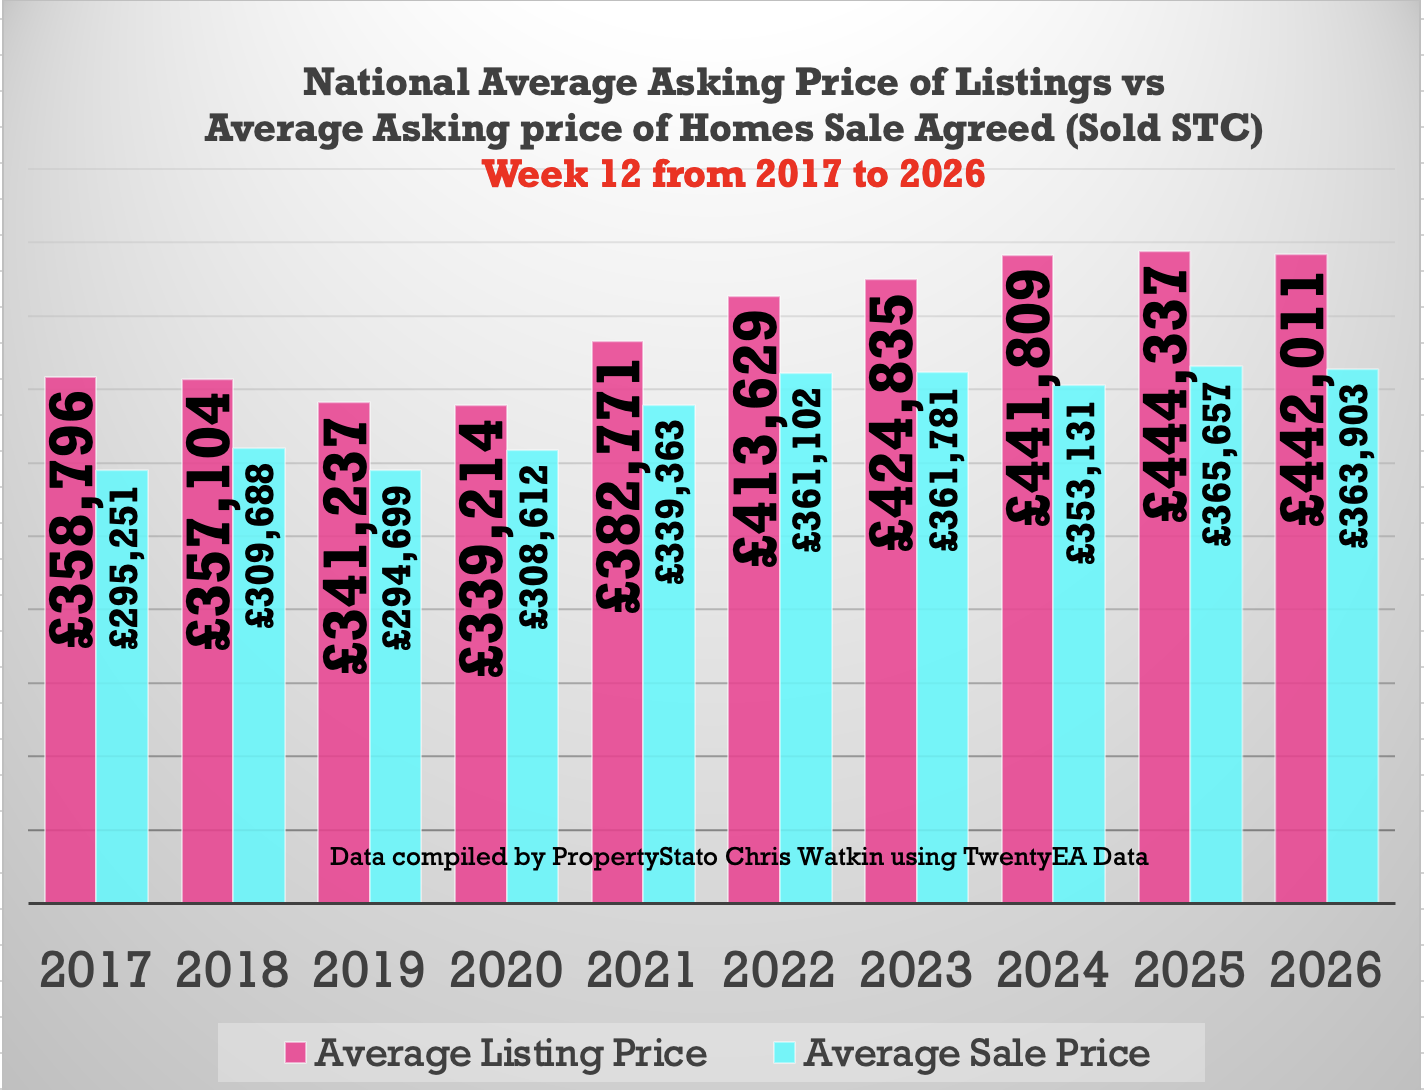
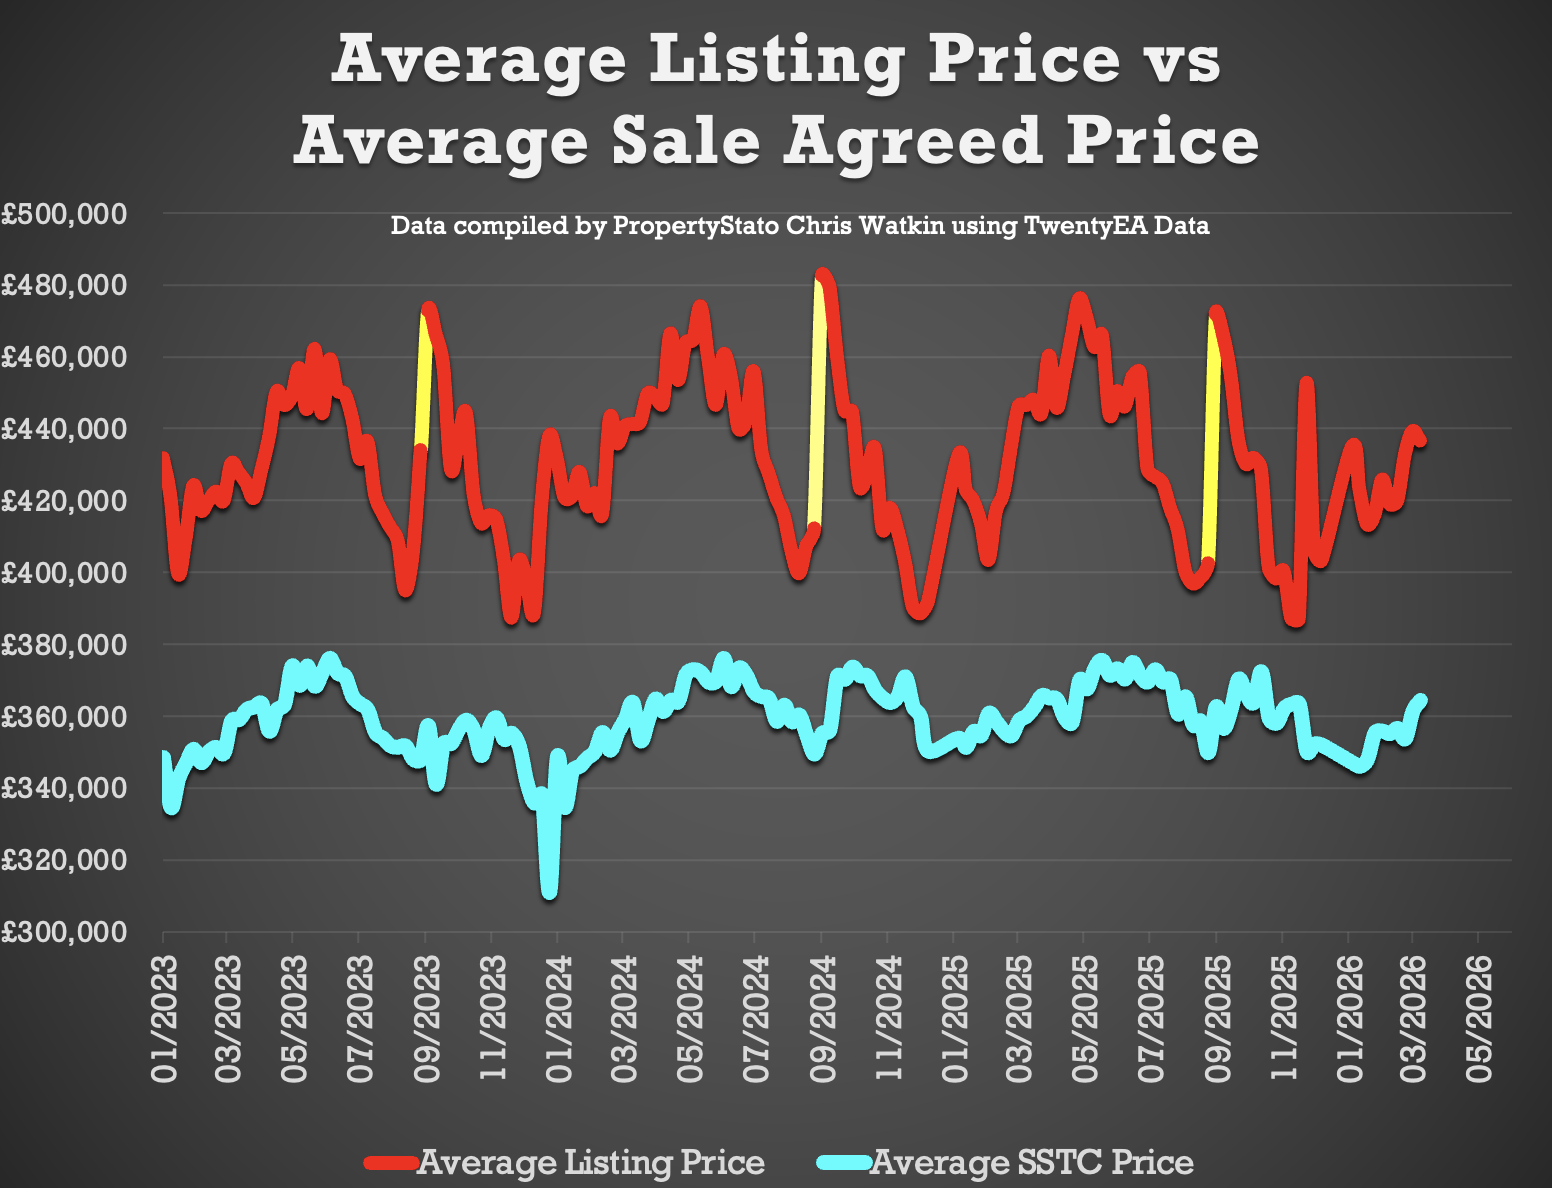
✅ Price Difference between Listings & Sales
• 21.5% difference (long term 10 year average is 16% to 17%). (£442k ave Listing Ave Asking price vs £364k Sale Agreed ave. Asking price).
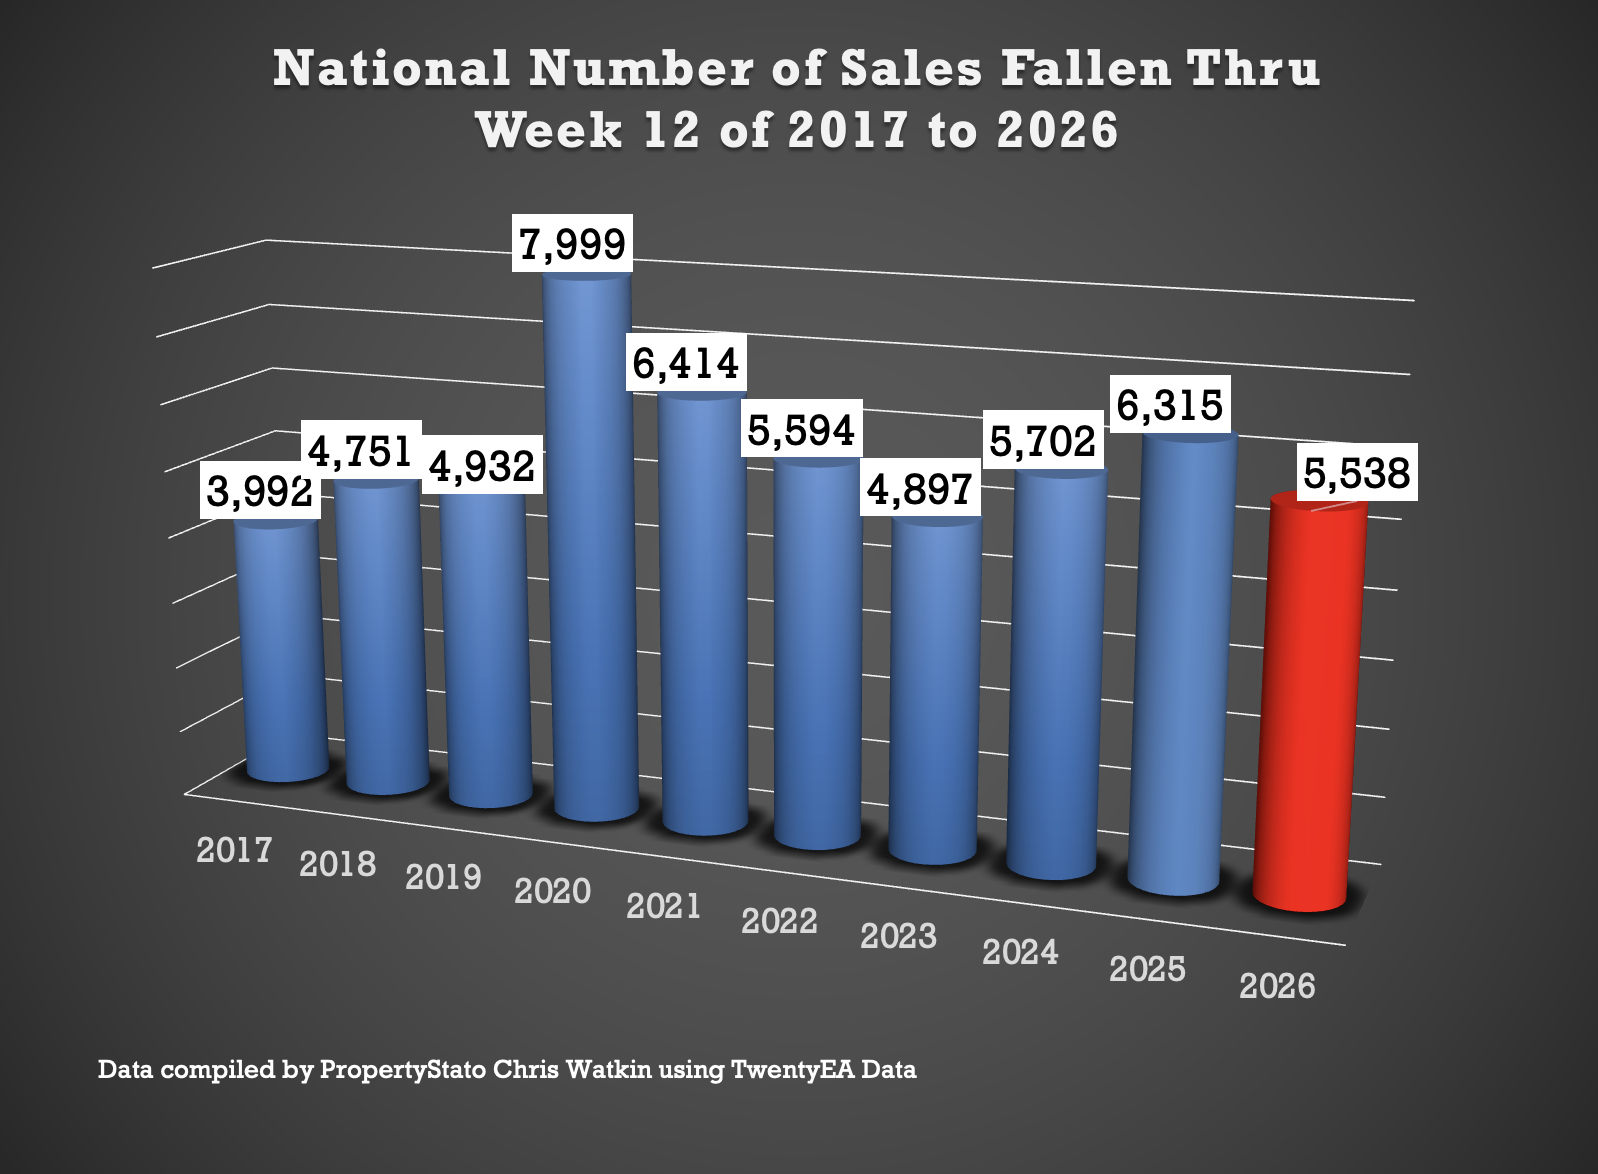
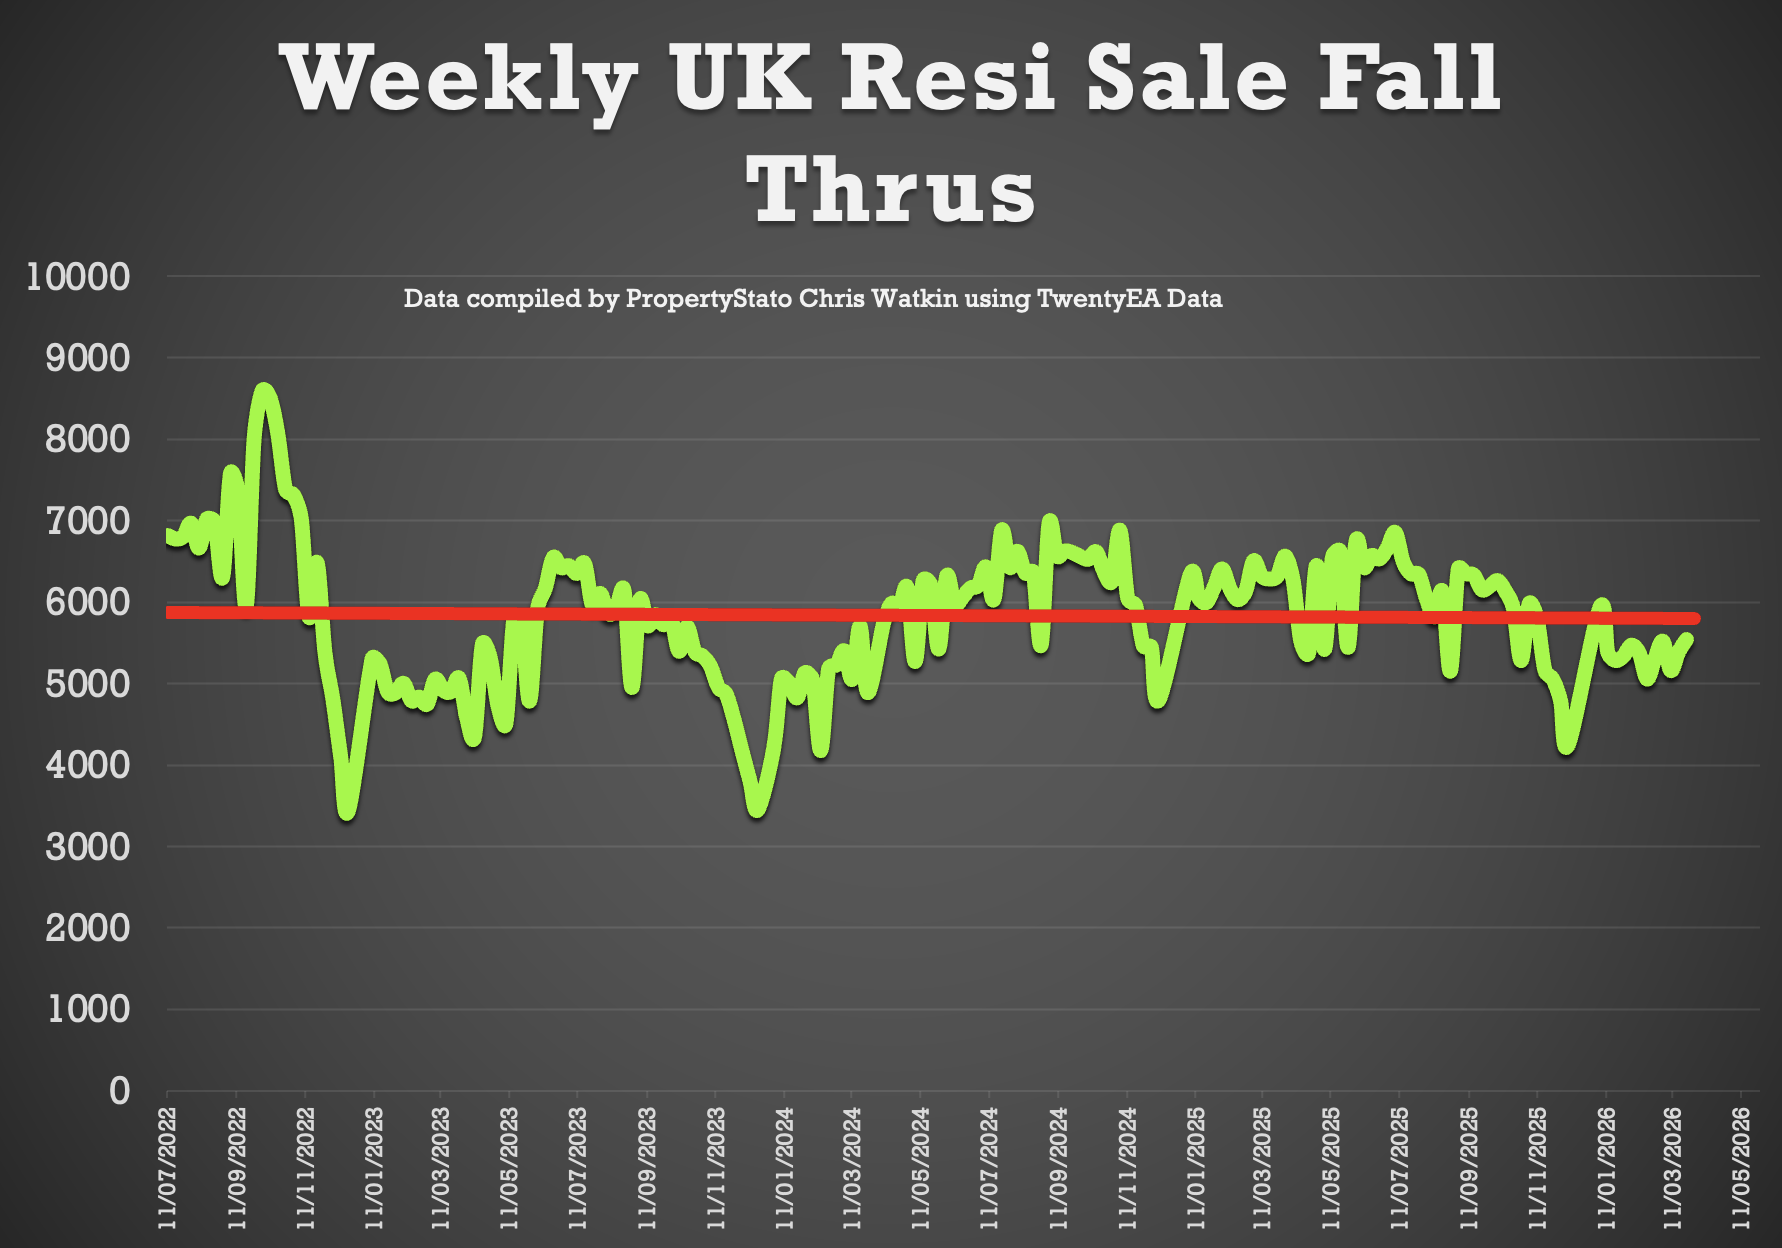
✅ Fall-Throughs
• 5,538 fall-throughs last week (pipeline of 434k home Sold STC).
• Weekly average for 2025: 6.1k.
• Fall-through rate (Fall thru expressed as a % of the Gross sales that week): 21%, down from 20.7% last week.
• Long-term average: 24.2% (post-Truss chaos saw levels exceed 40%).
• 4.9% of all the sales agreed in Estate Agent’s Sales pipelines fell thru in February 2026. 2025 average – 5.3% & 10 year average – 5.8%). March figures to follow next week.
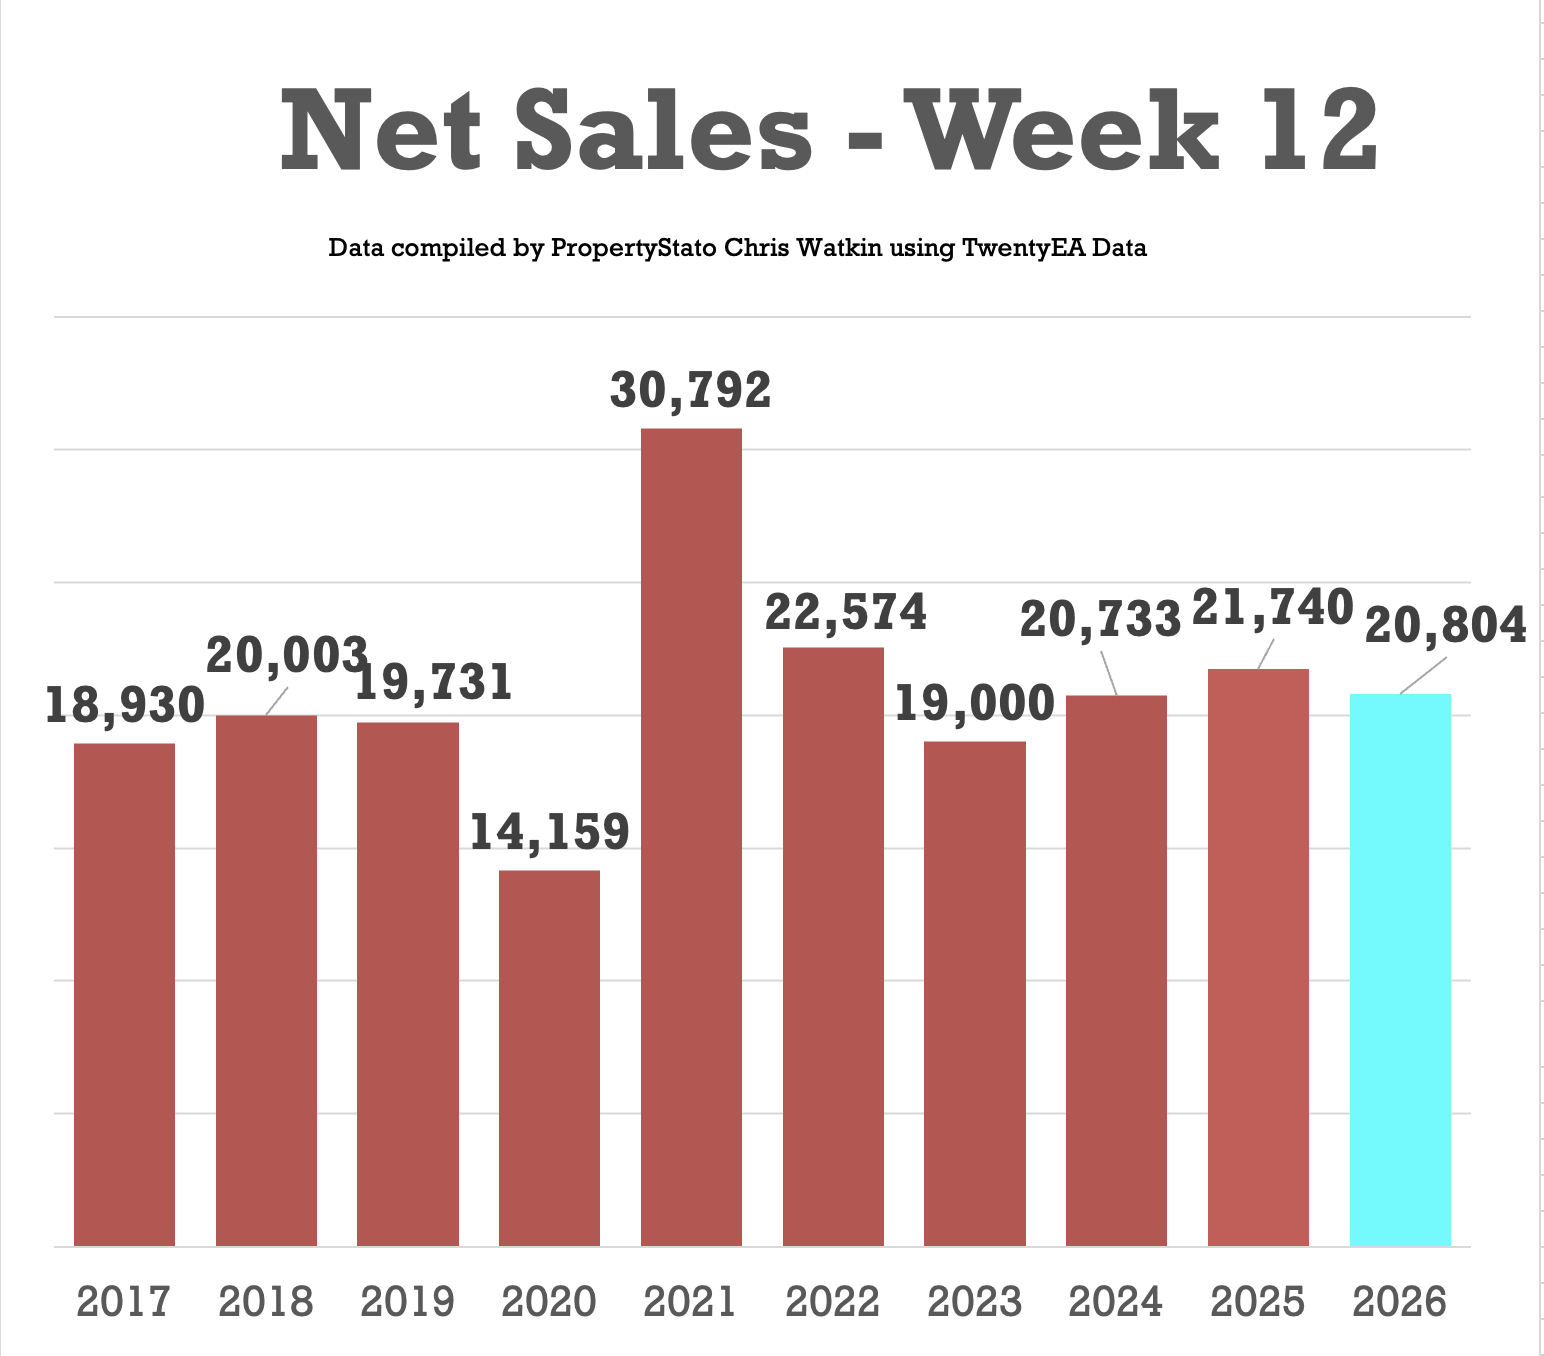
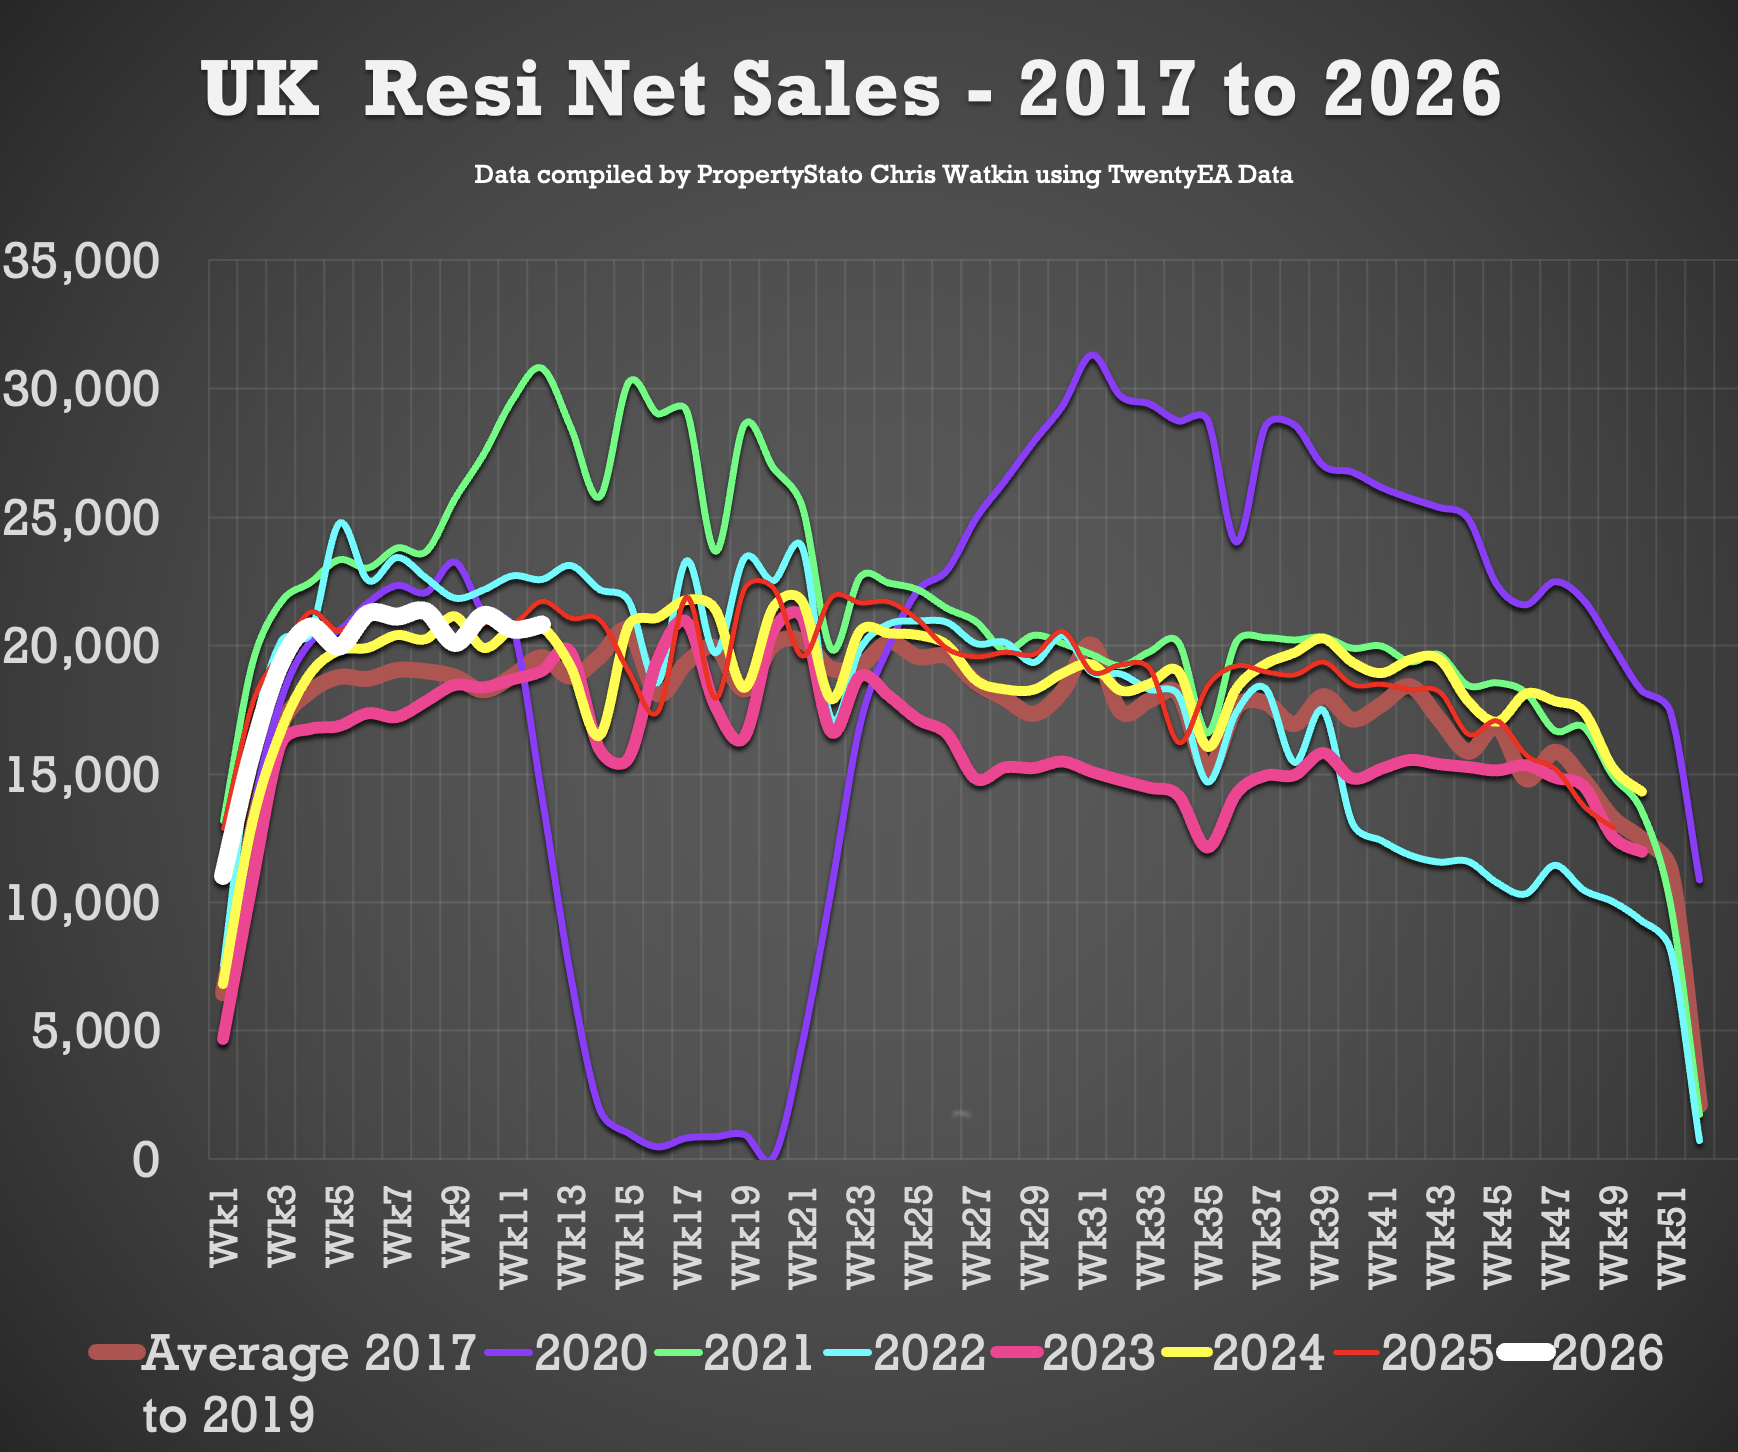
✅ Net Sales
• 20.8k Net Sales, up slightly from 20.6k last week
• Ten-year Week 12 average: 20.8k.
• Weekly average for 2026: 19.4k.
• Weekly average for the whole of 2025: 18.8k.
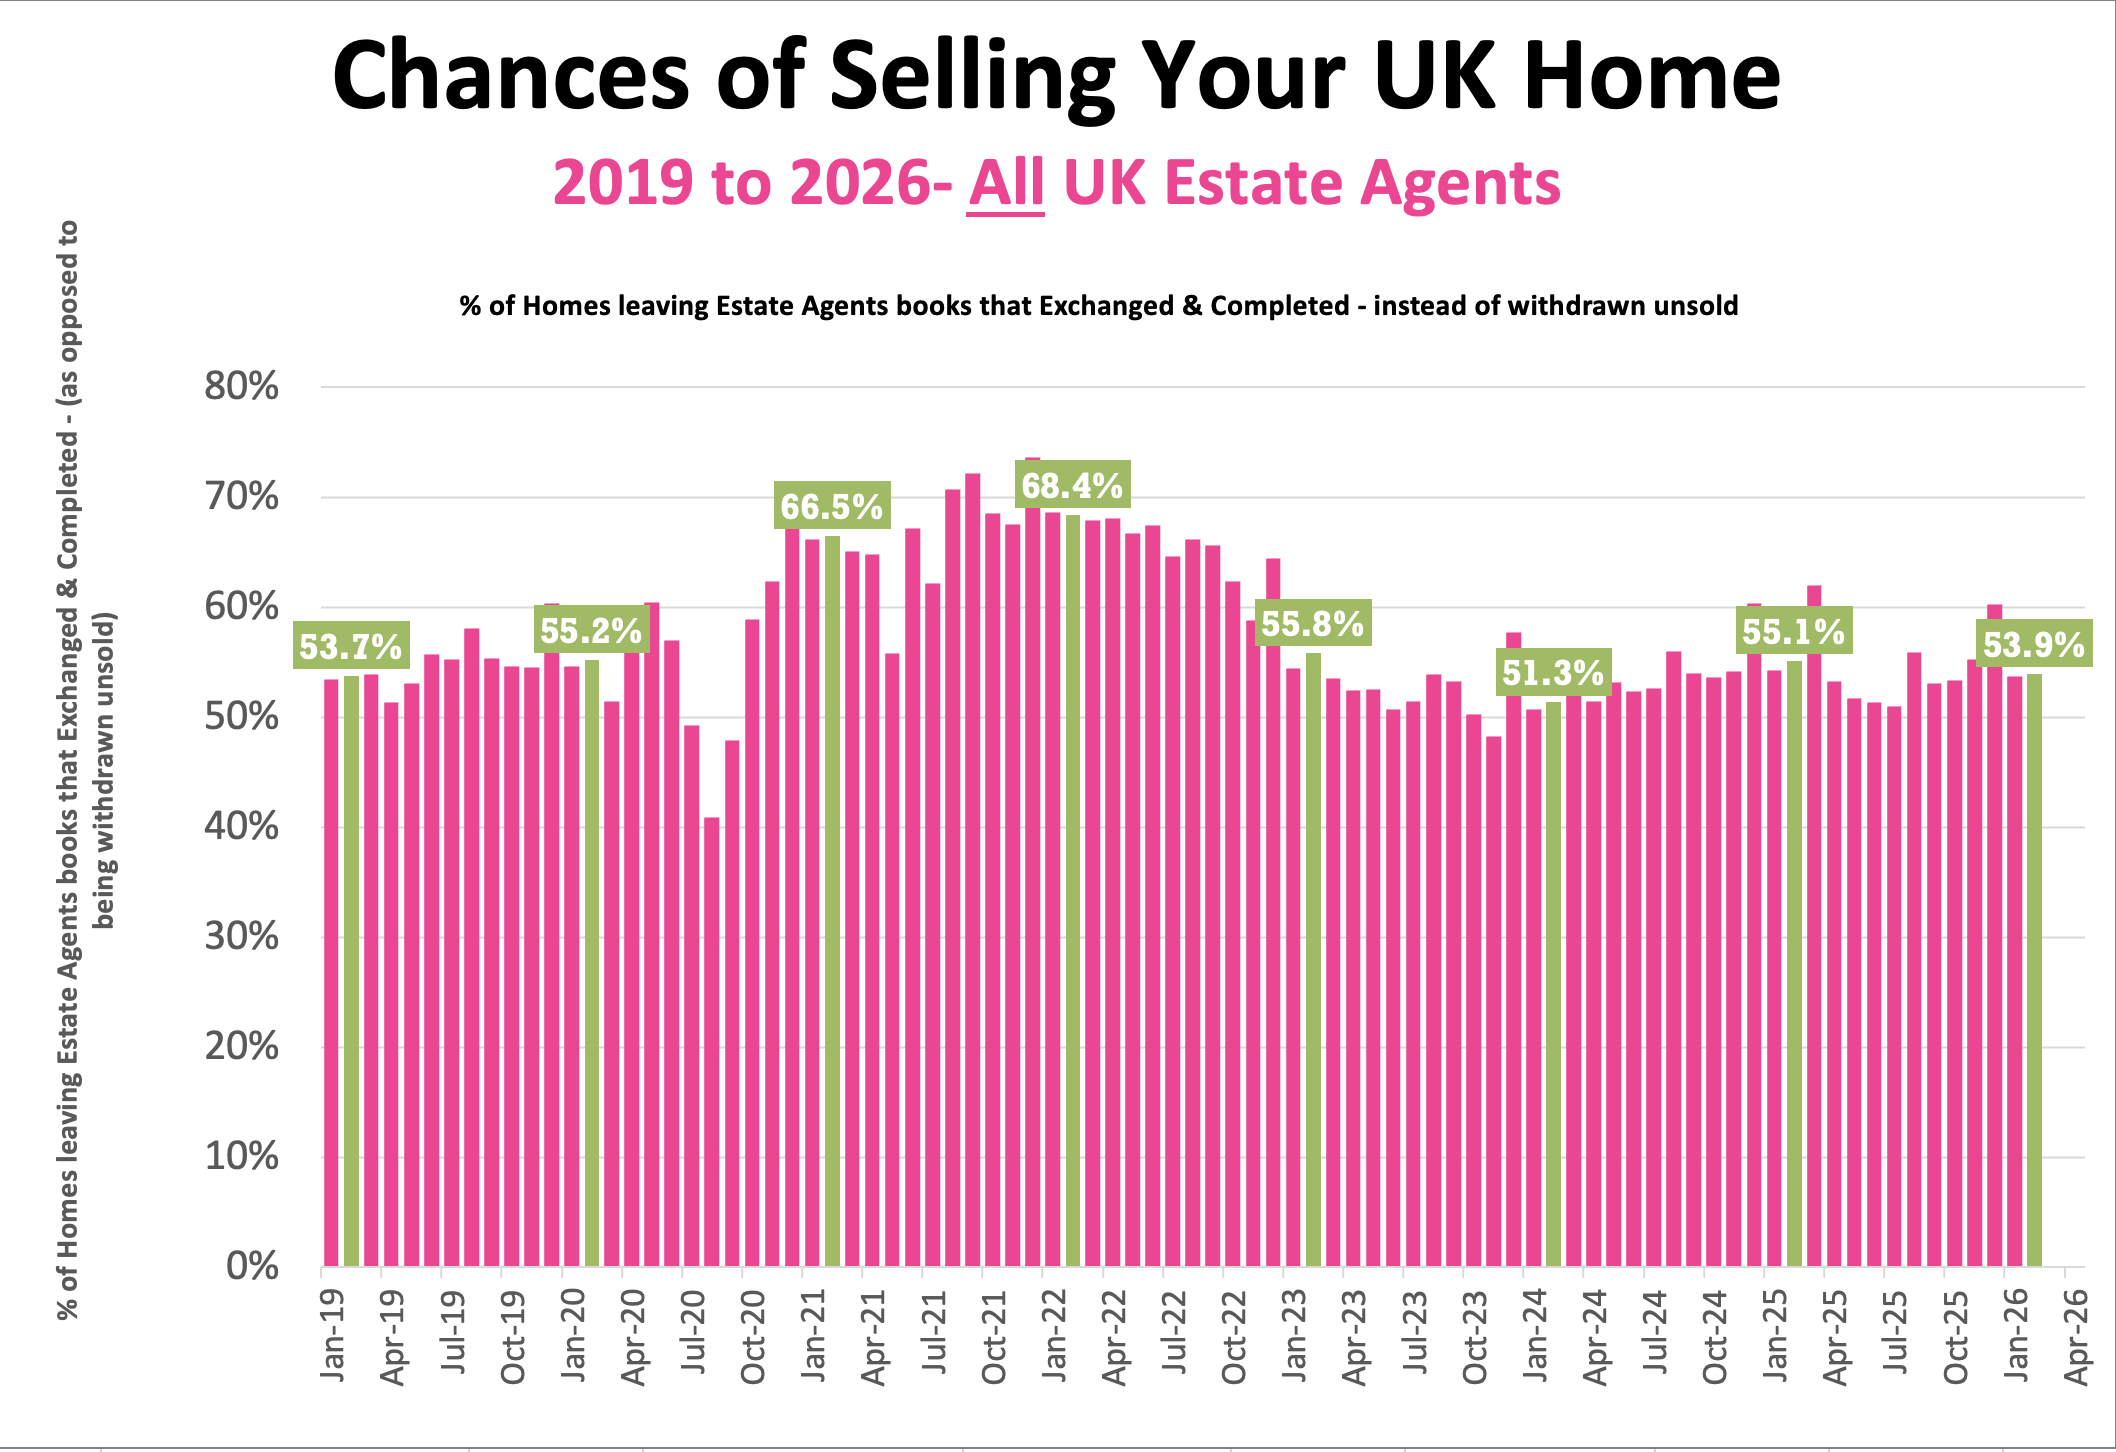
✅ Probability of Selling (% that Exchange vs withdrawal)
• Feb ’26 Stats : 53.9% of homes that left agents’ books exchanged & completed in Feb. (Note this figure will change throughout the month as more Feb stats come in). March figures to follow next week
• 57.6% is the 7 year average (which includes the crazy years post lockdown 18 months).
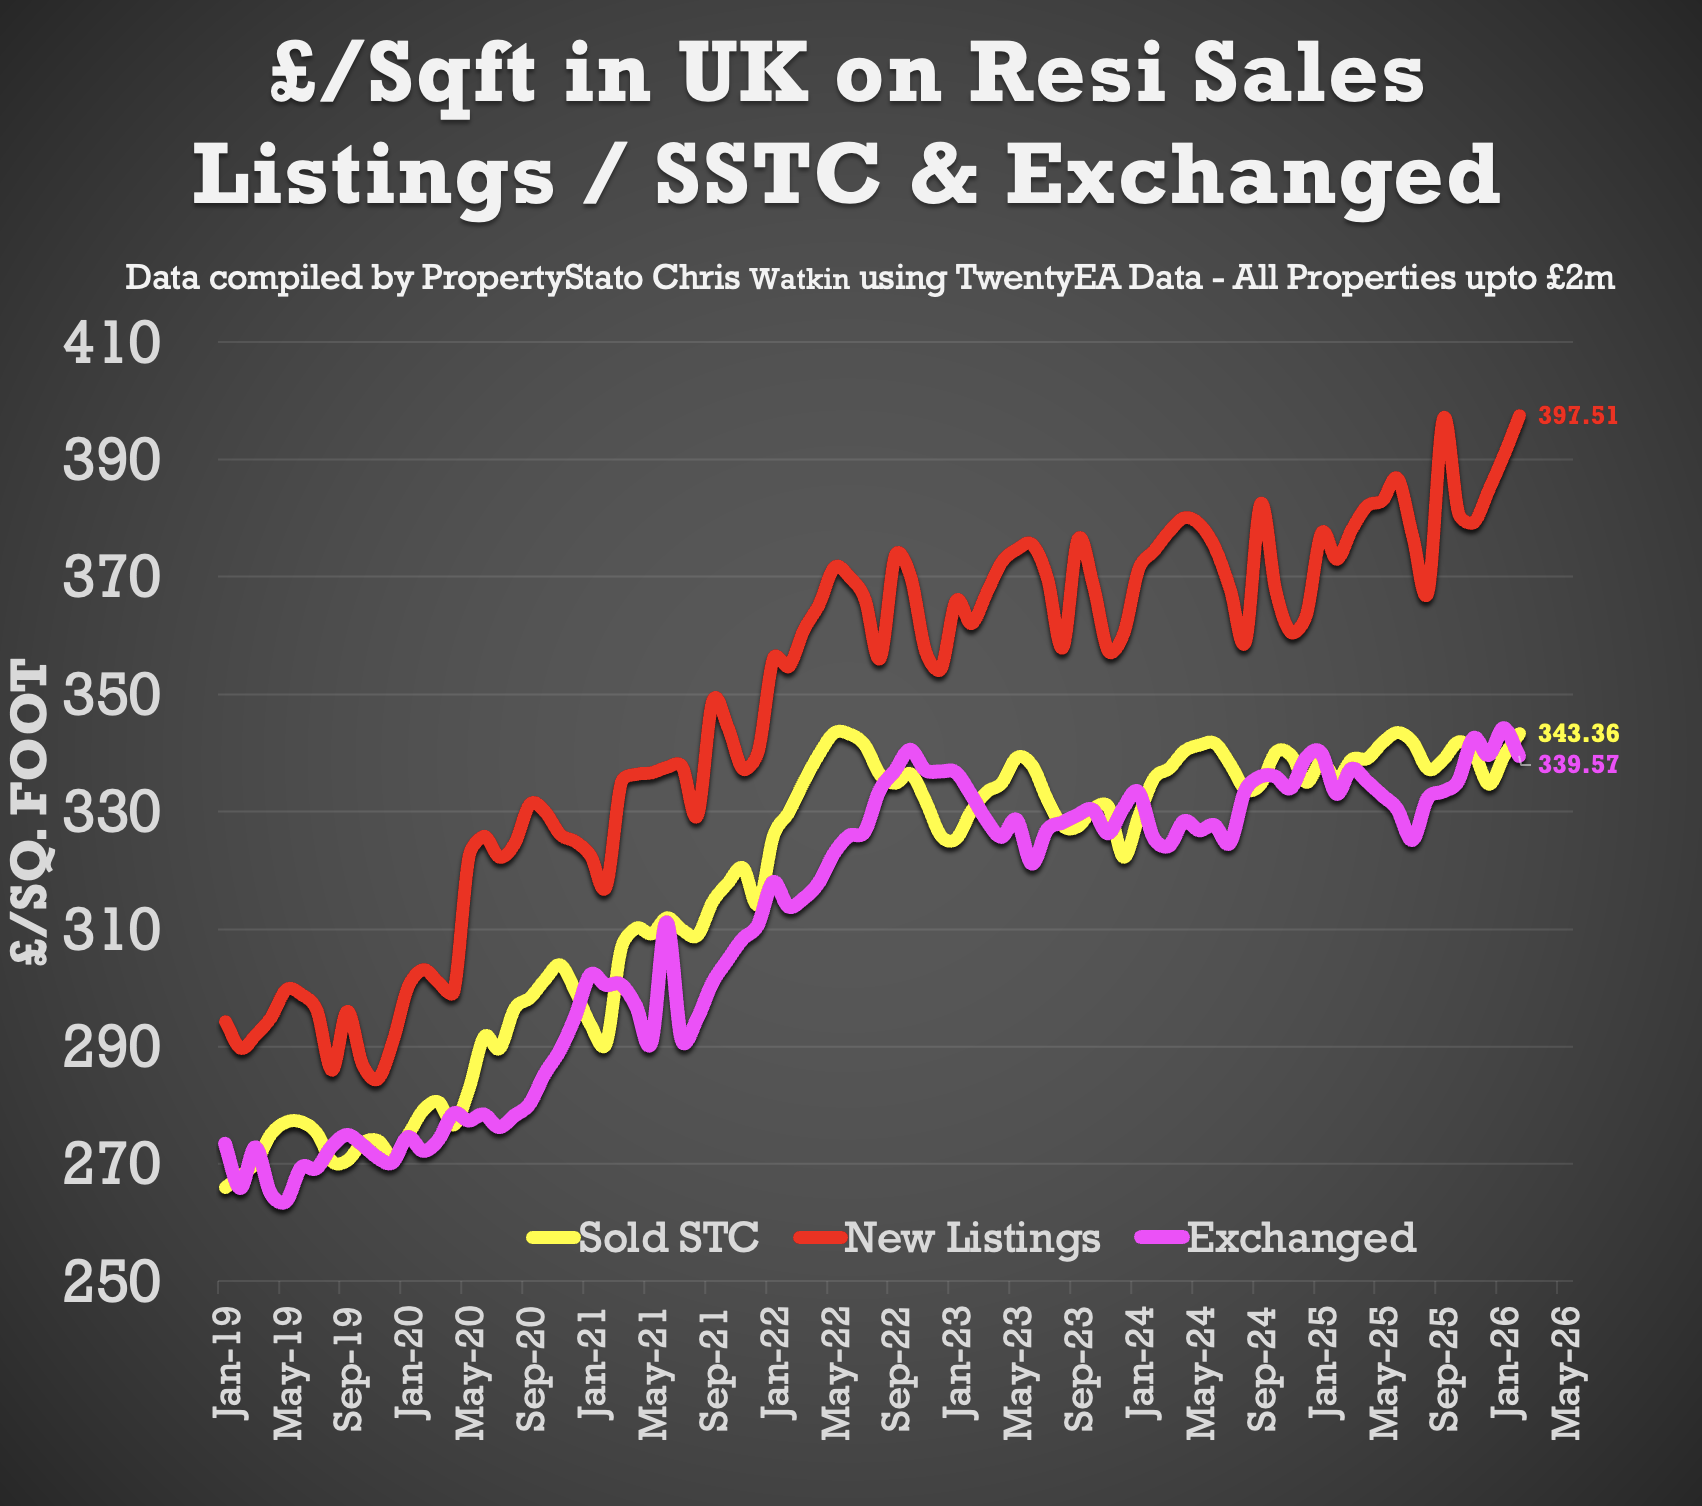
✅ House Prices (£/sq.ft)
• February ’26 agreed sales averaged £343.36 per sq.ft. 2.3% higher than 12 months ago (£335.63) and 18.2% than 5 years ago (£290.43). The £/sqft at sale agreed matches the HM Land Registry Index with a 98% accuracy, 5 months in advance. That is why it is so important.
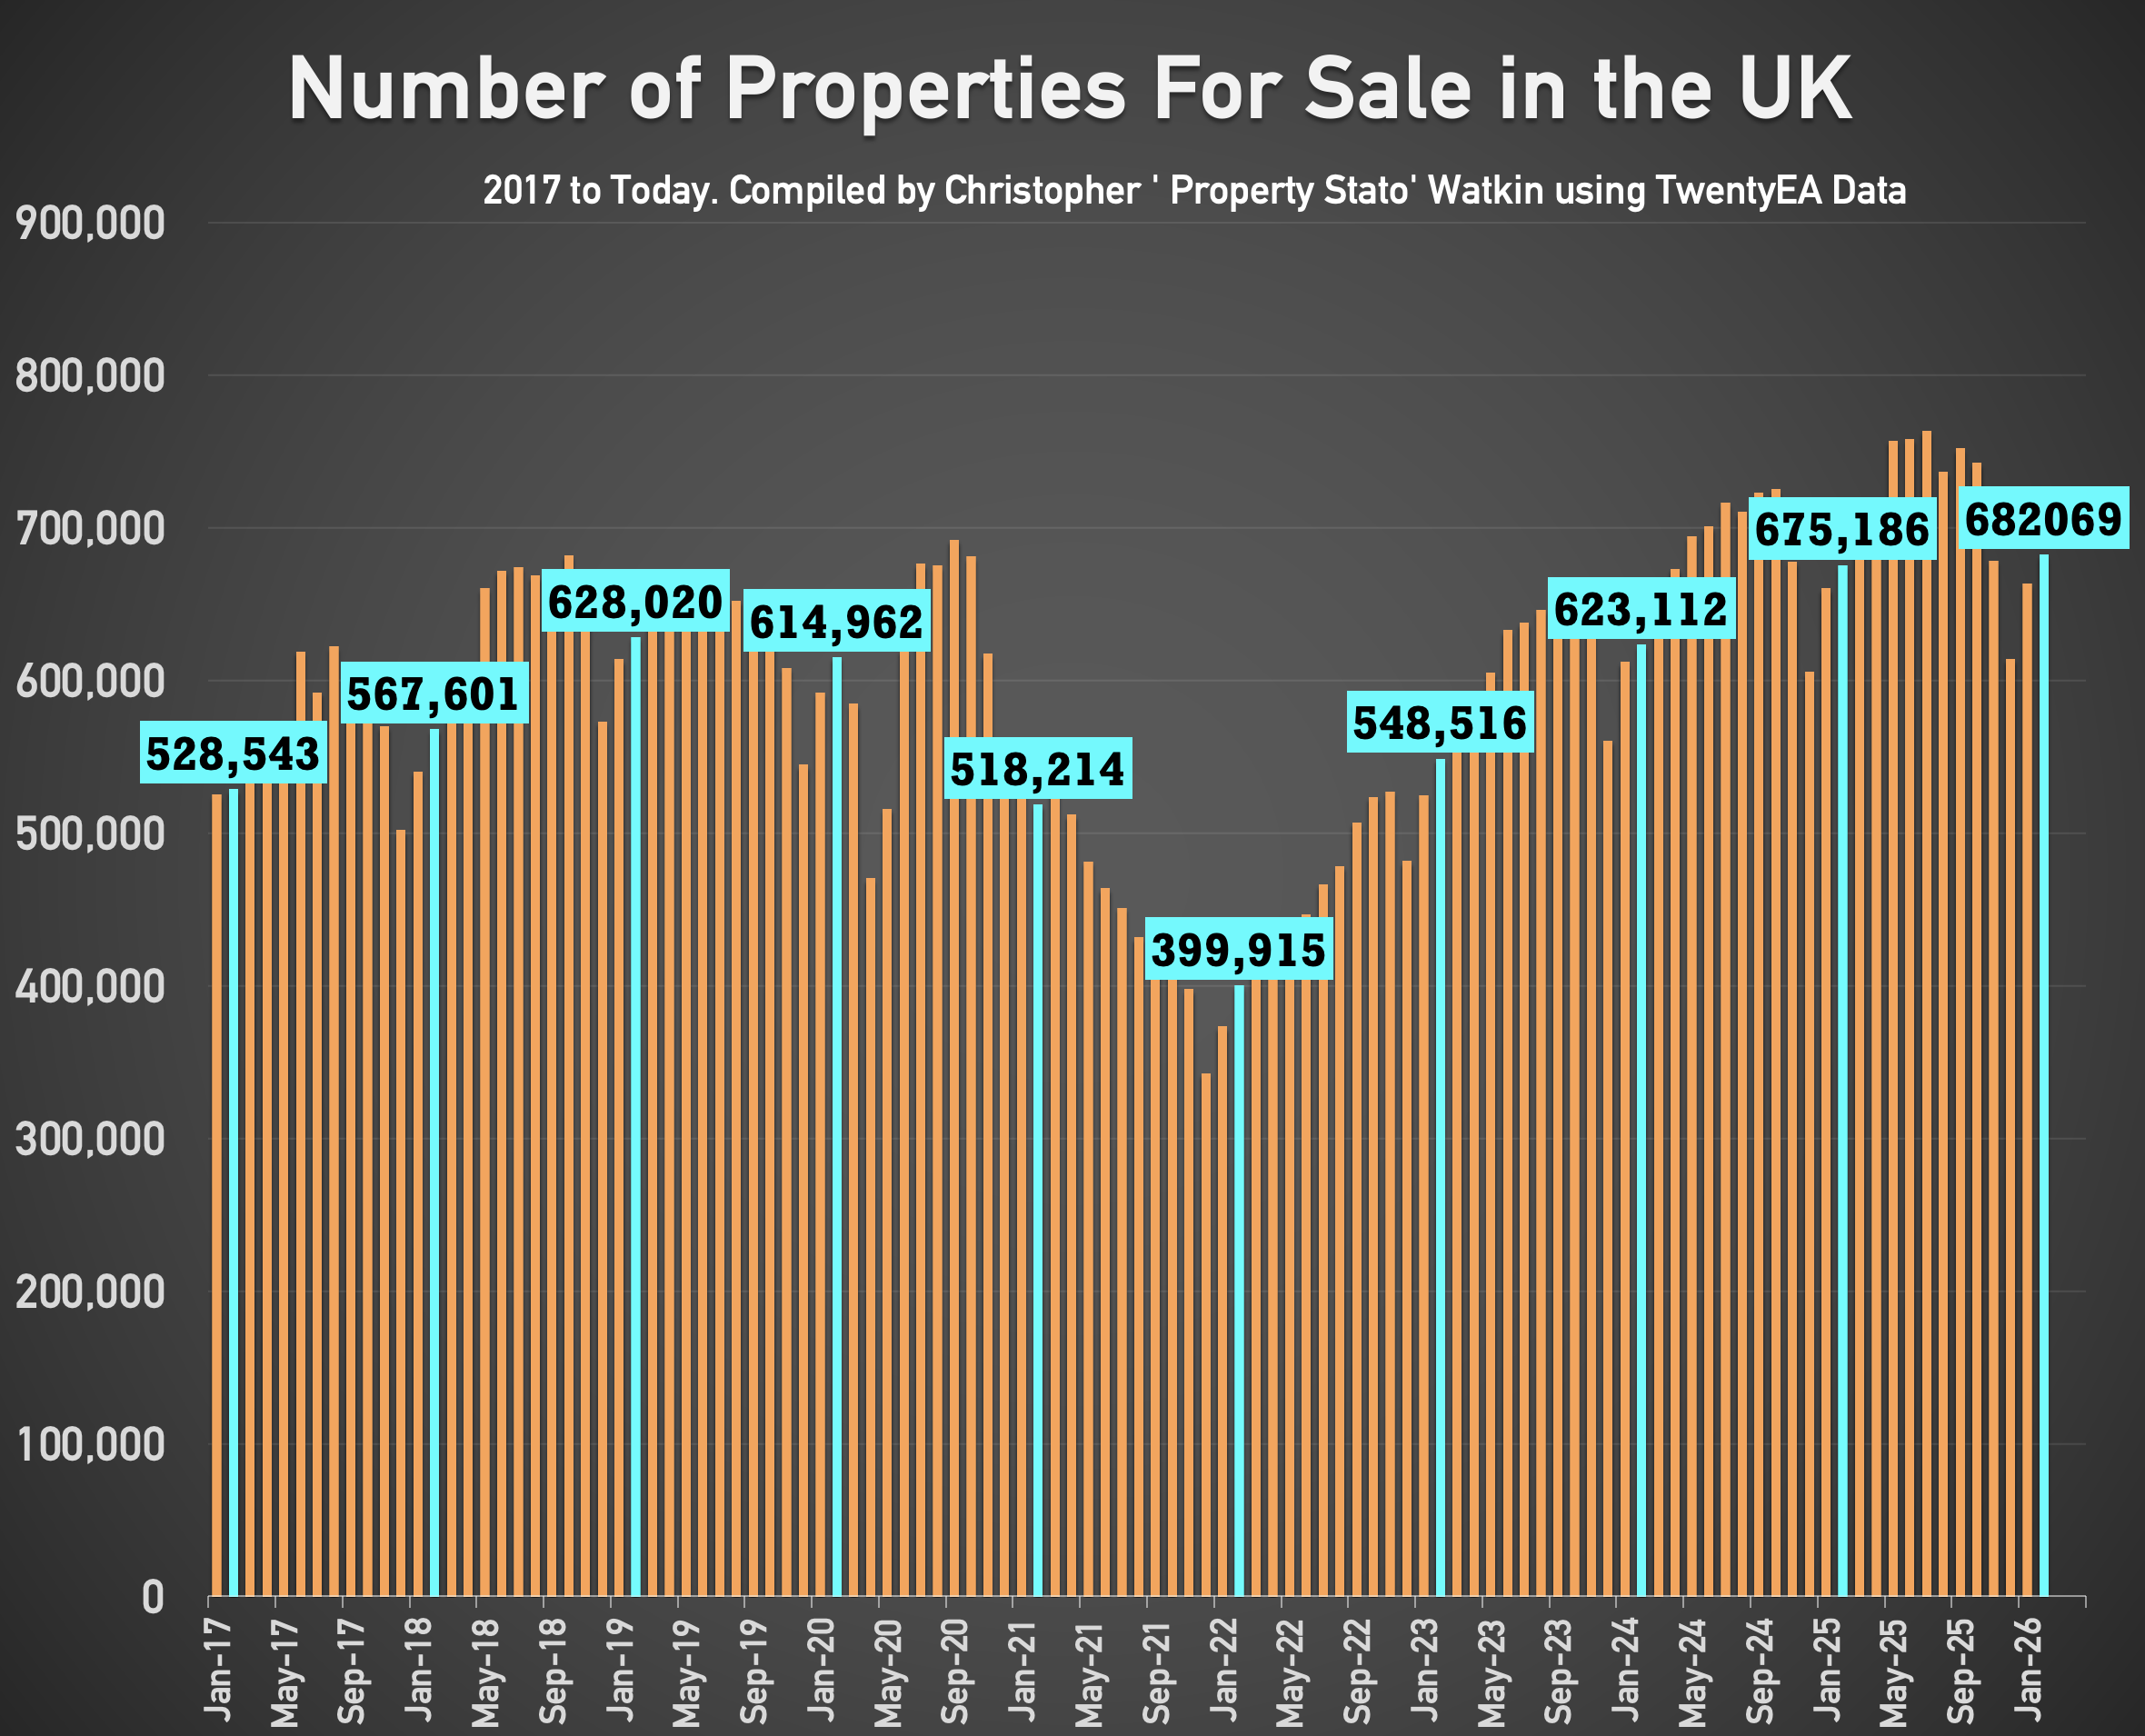
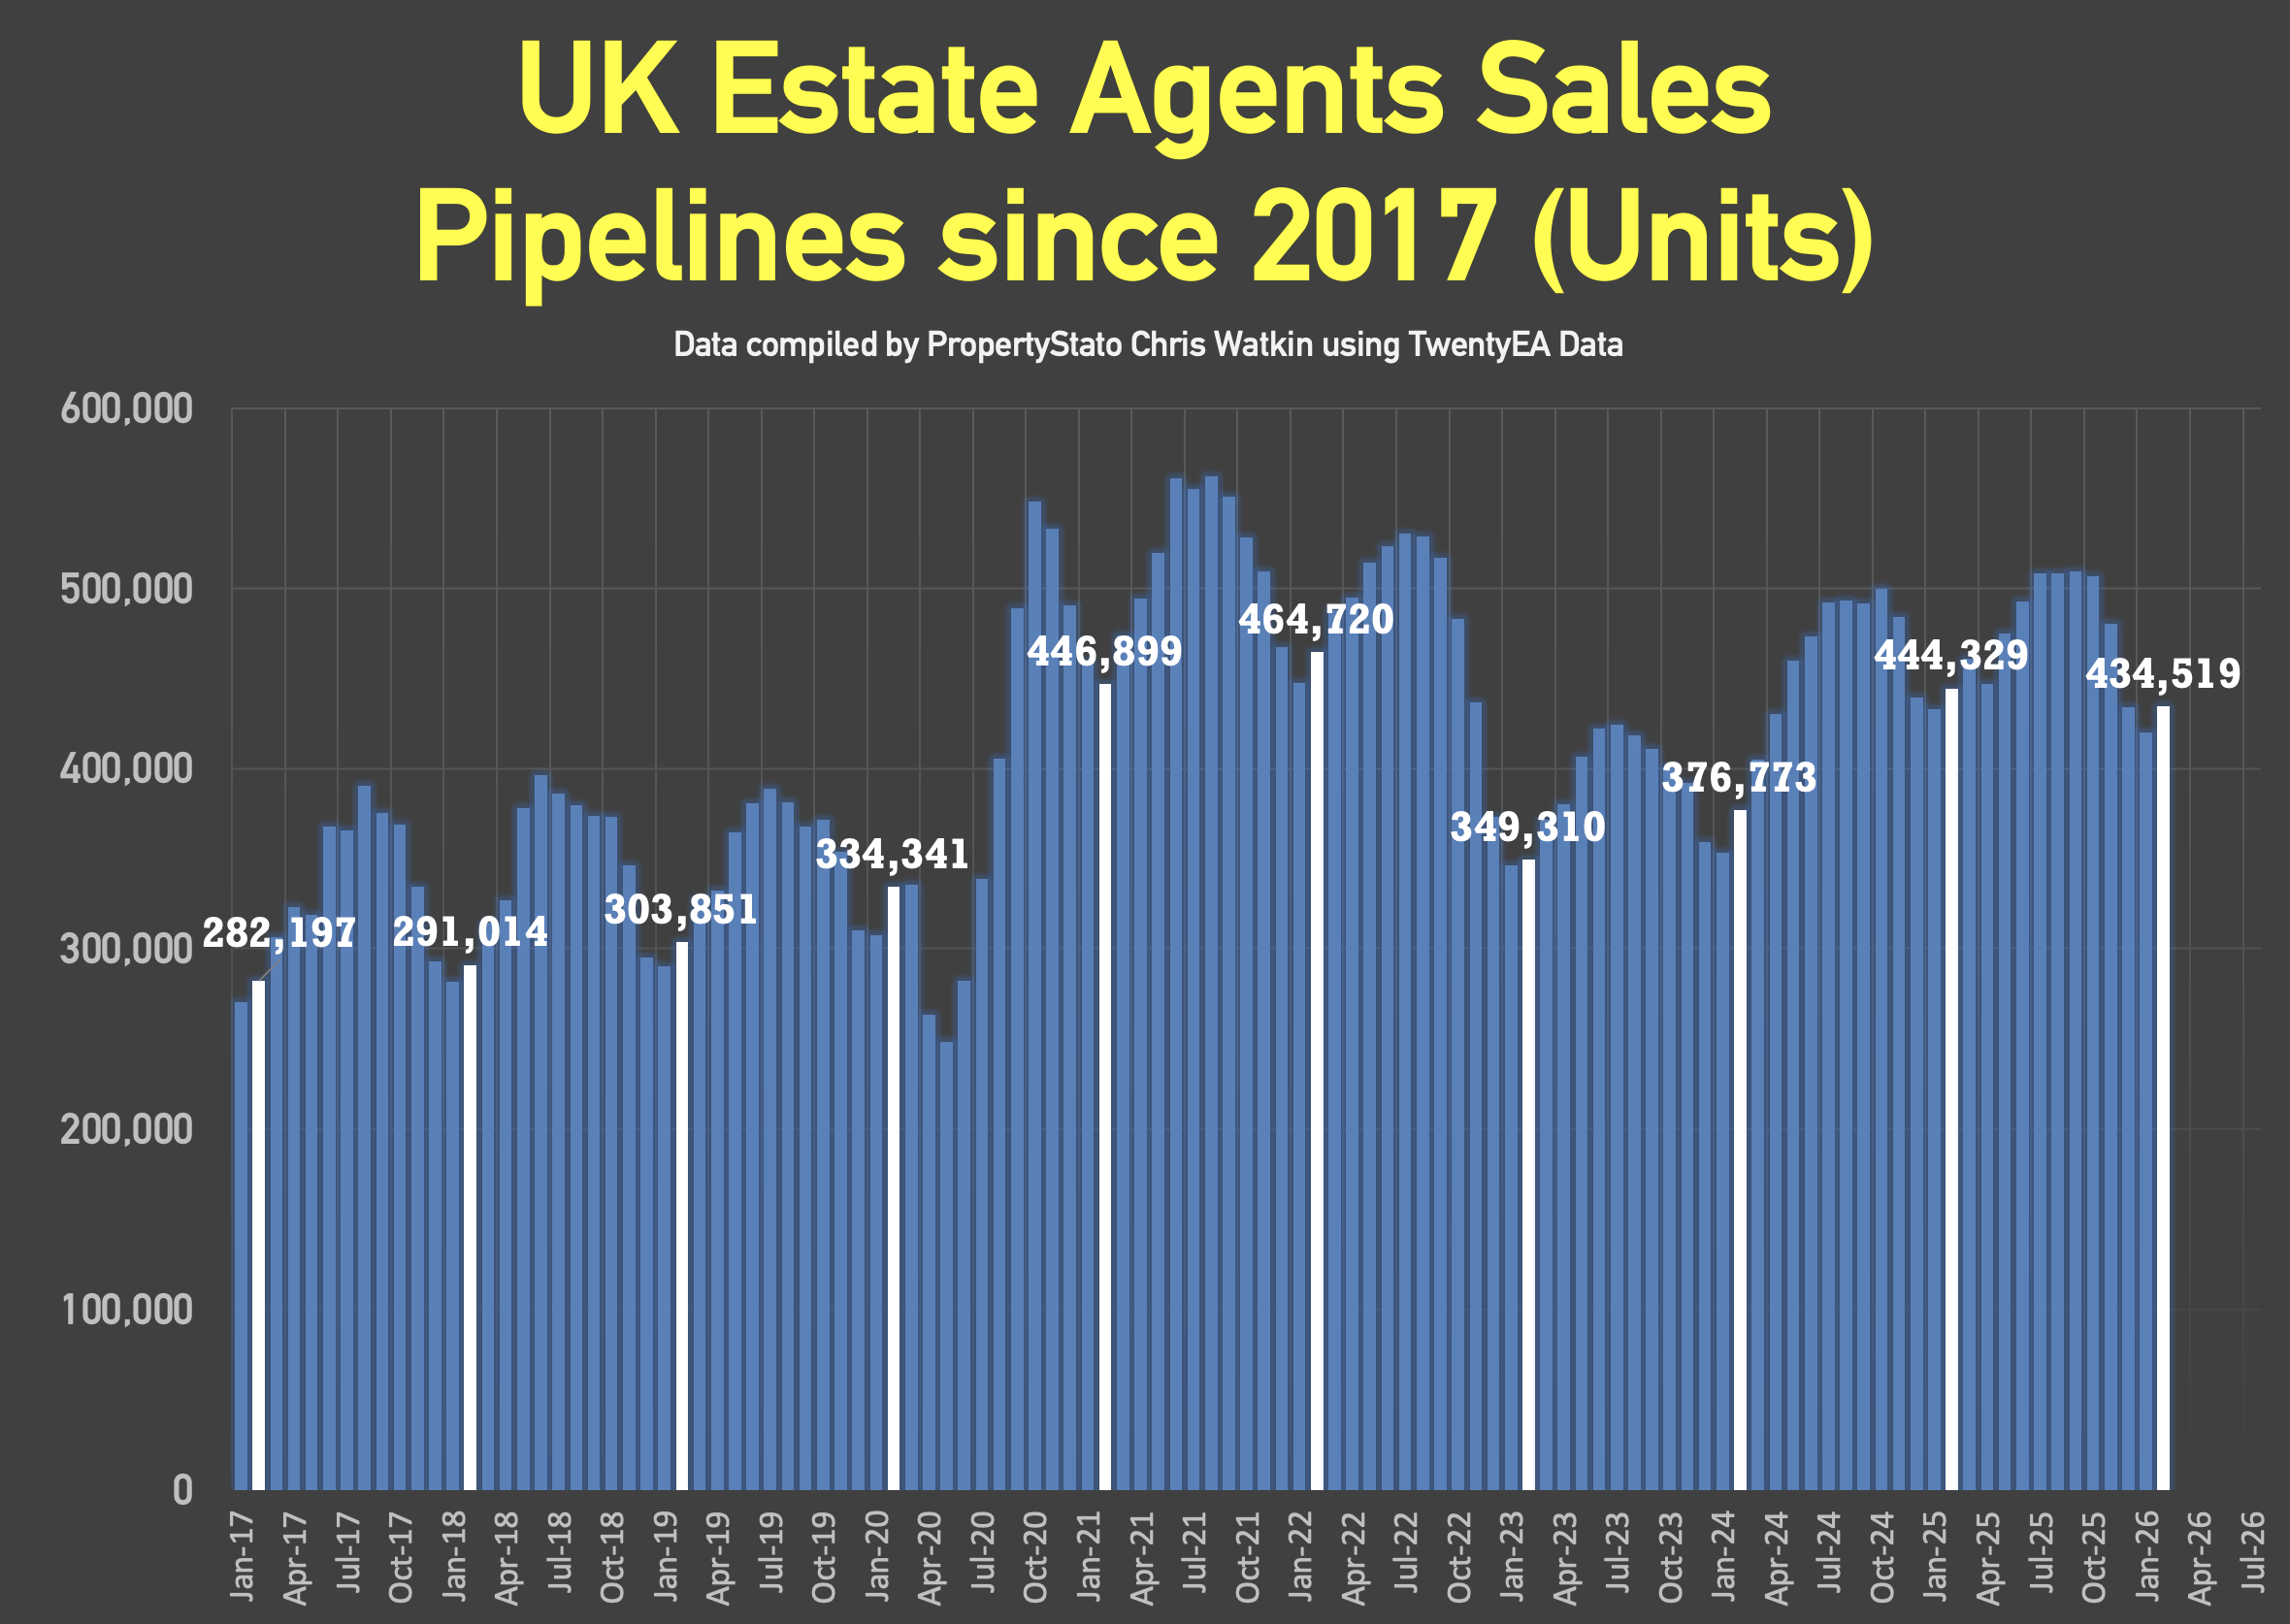
✅ Stock Levels
• 682k homes on the market on the 1st of March ’26. (675k – 1st March 25)
• 434k homes in agent’s sales pipeline on the 1st March 2026, slightly lower than 12 months ago on 1st March ’25 (444k).
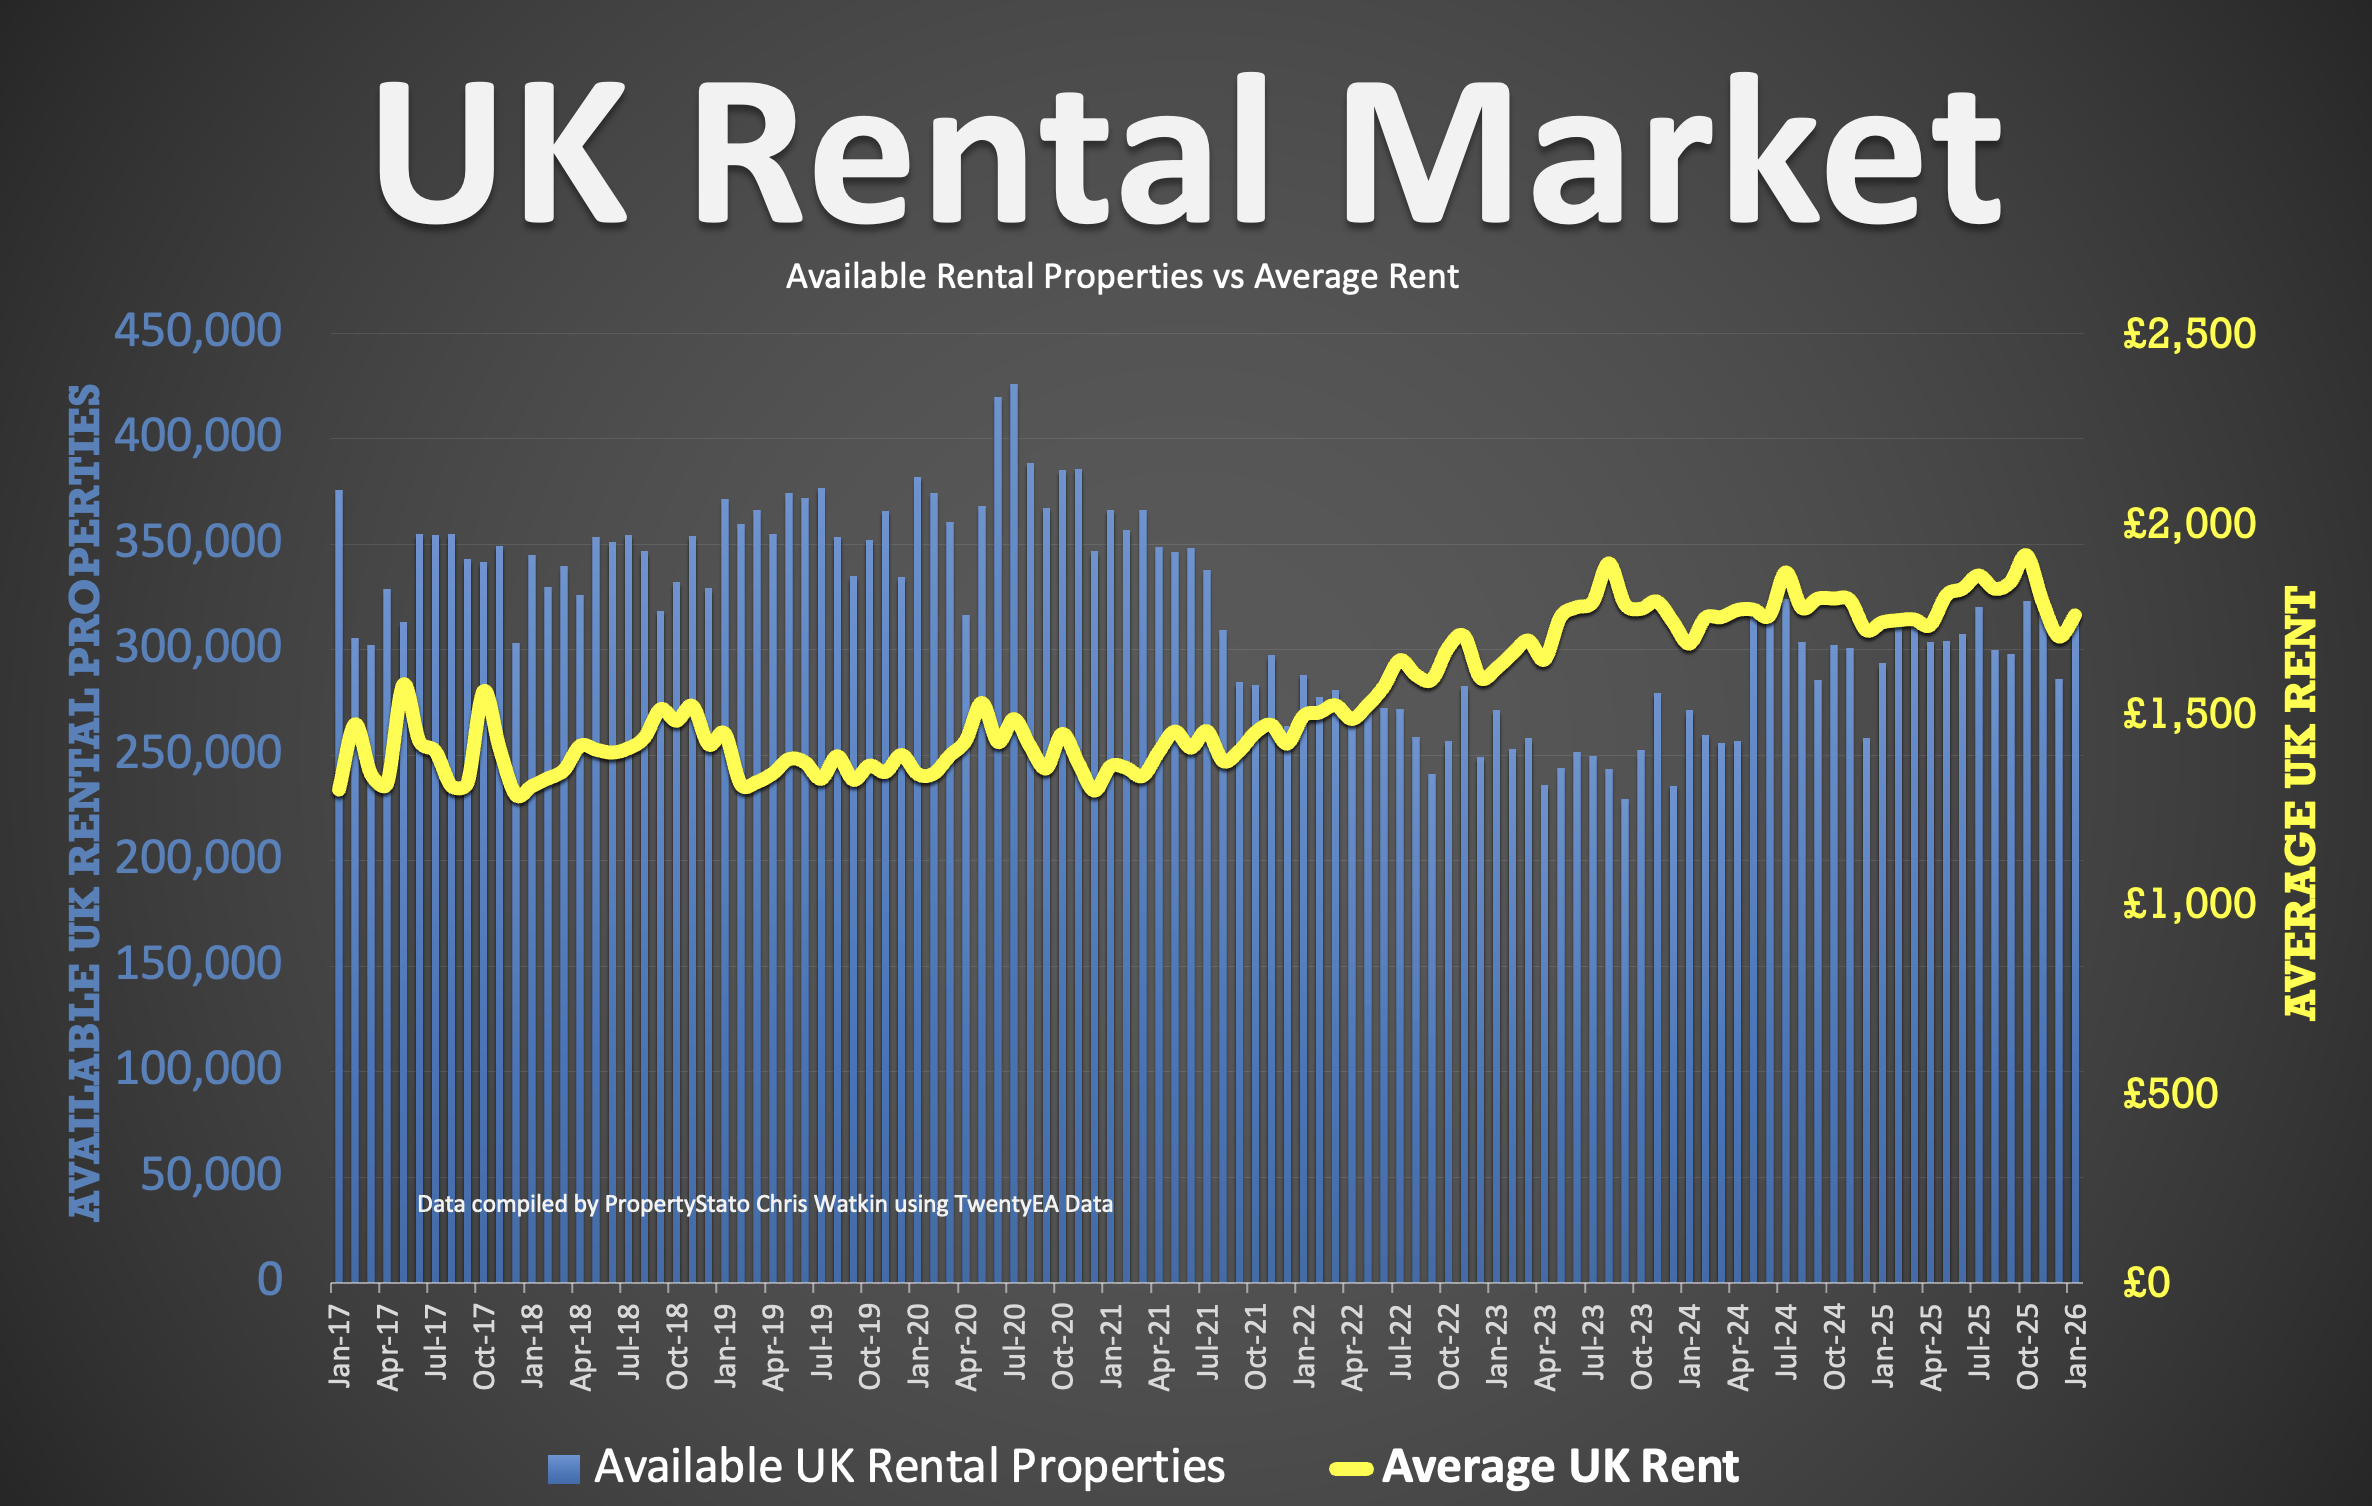
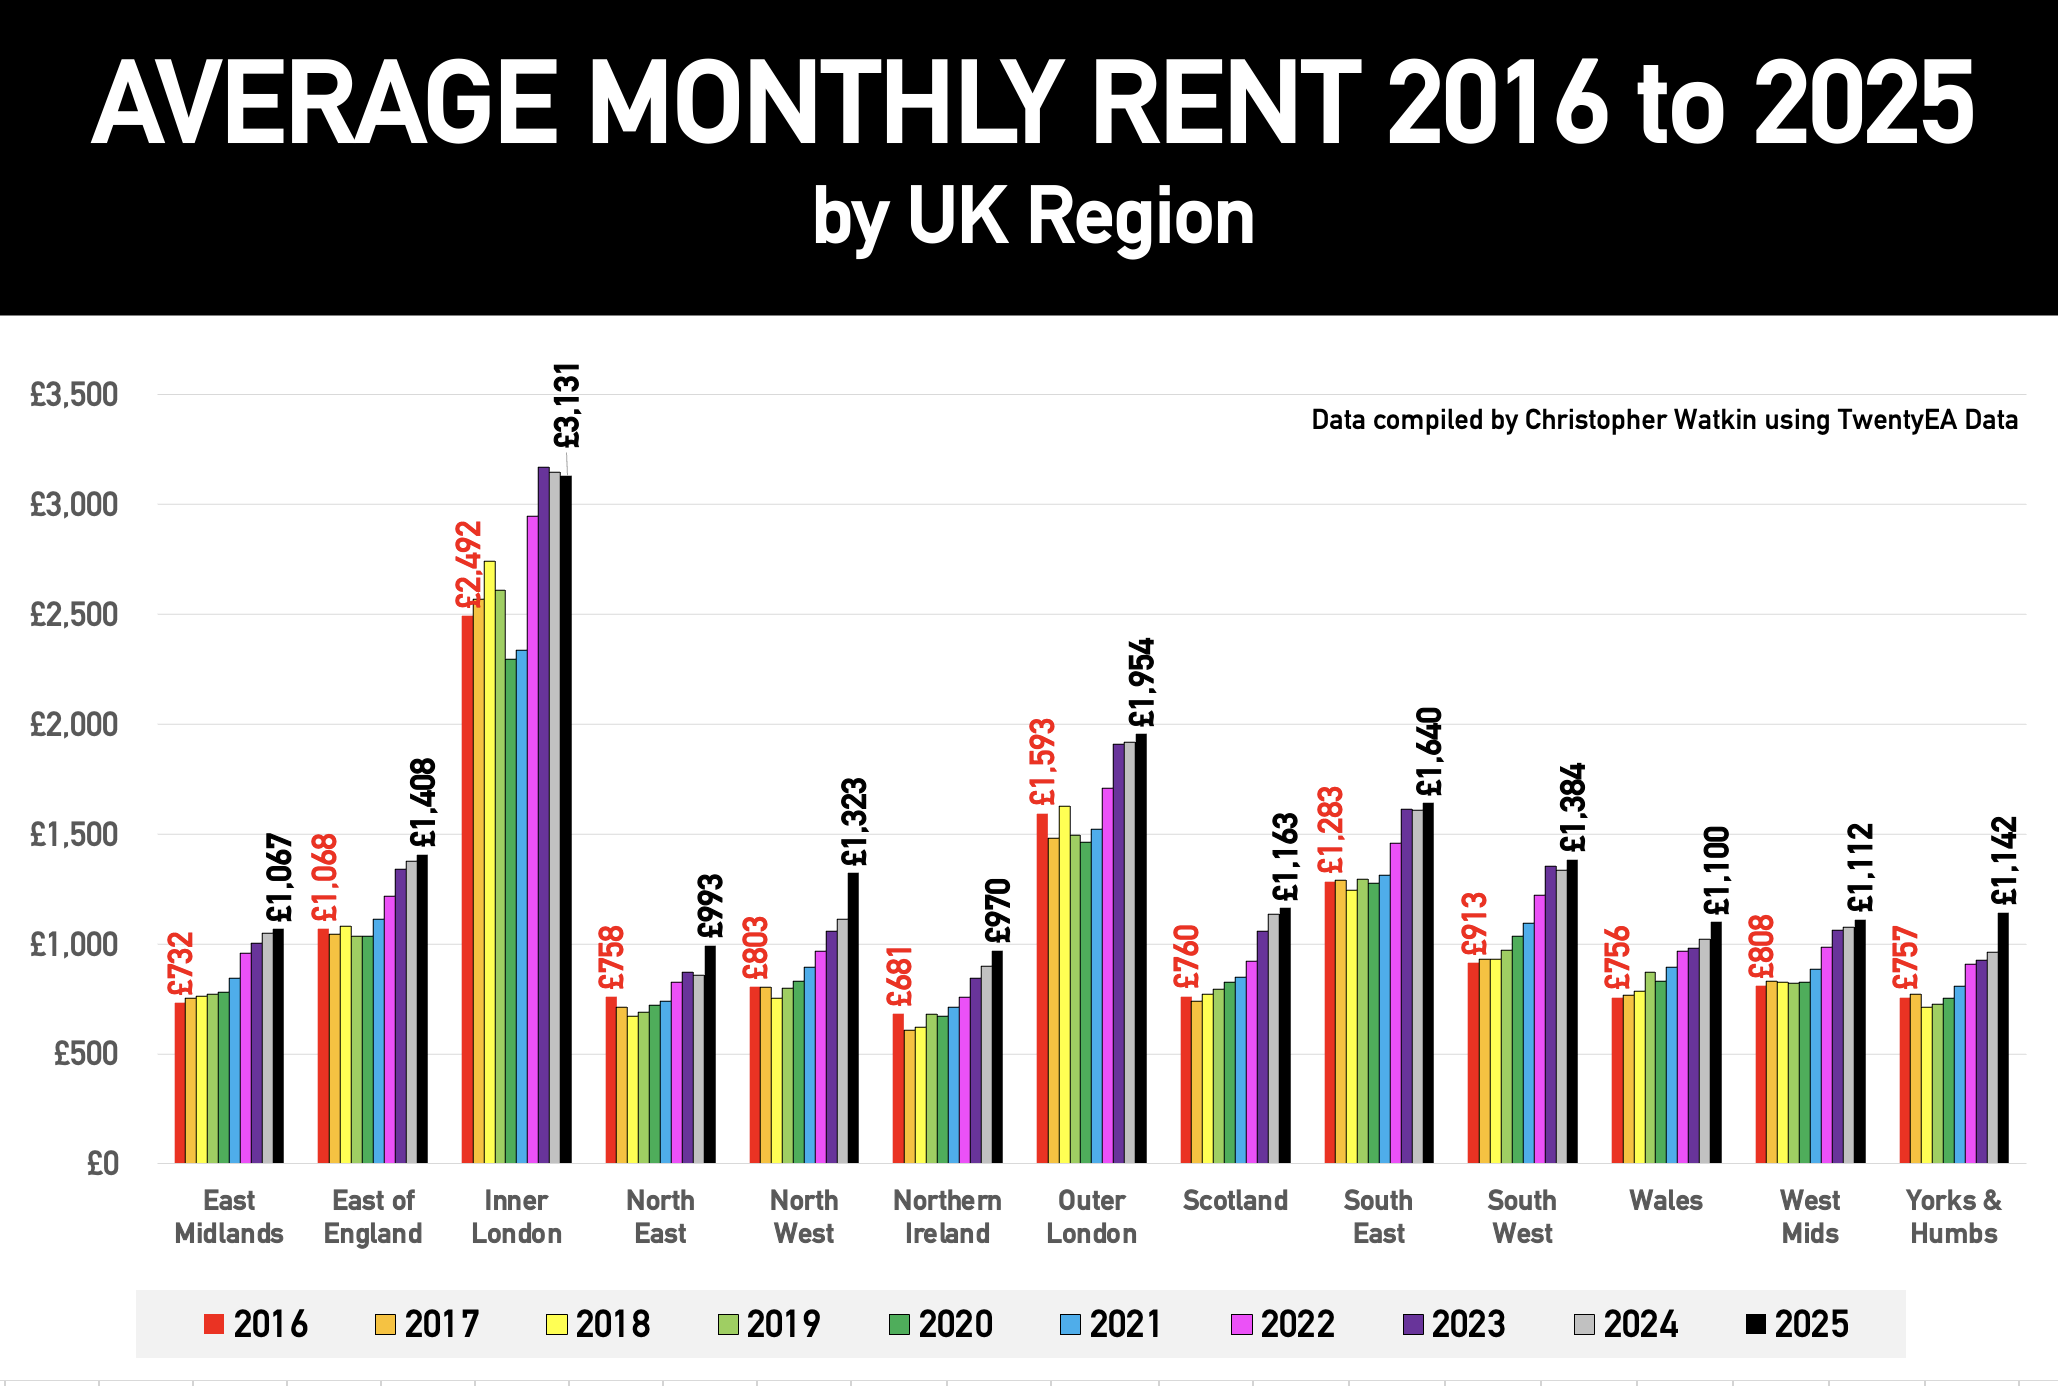
✅ UK Rental Data
• Average Rent in Feb 2026 – £1,711 pcm (£1,745 in Feb 25)
• 305k UK Rental Stock available to rent in Feb 26 (310k in Feb 2025).
(March figures to follow next week).
✅ Local Focus
Portsmouth

Comments are closed.