

 This week in the UK Property Market Stats Show (week ending 25th January 2026): I break down what’s really happening in the market with the brilliant Steph Vass from TAUK.
The year is off to a strong start, with sales agreed up 23.5% year-to-date compared with 2024 — though overvaluation remains a challenge in many areas.
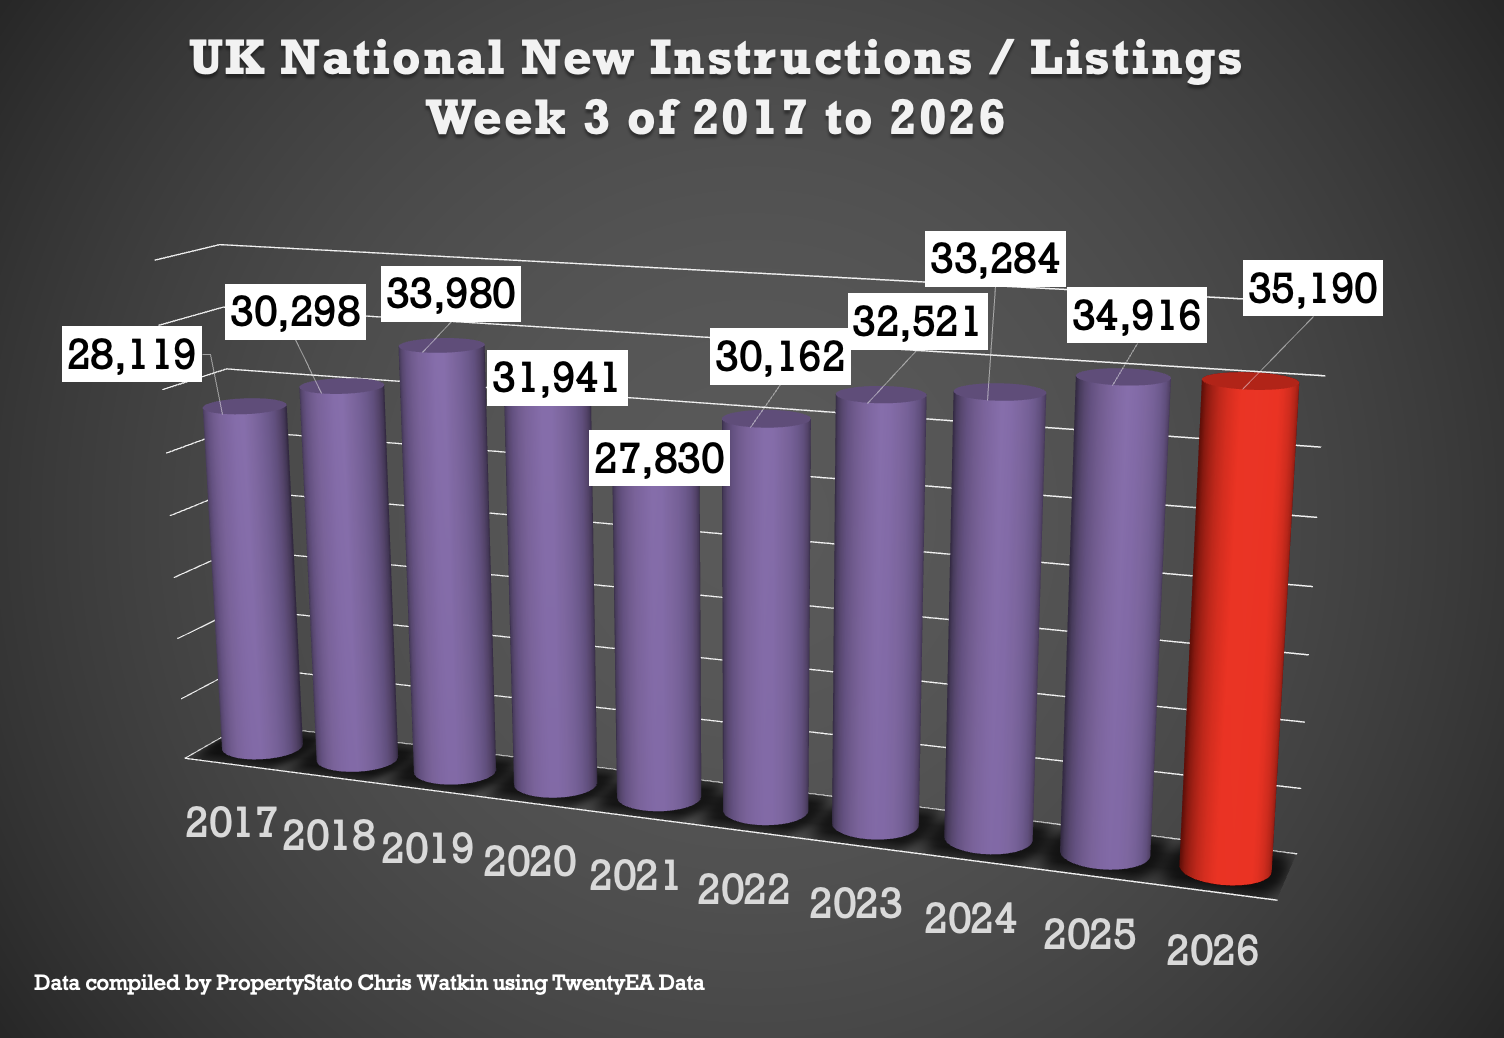
✅ New Listings
+ 35.2k new properties came to market this week in week 3, up as expected from 32.8k last week.
+ 2025 weekly average: 30.6k.
+ 10-year week 3 average : 31.8k
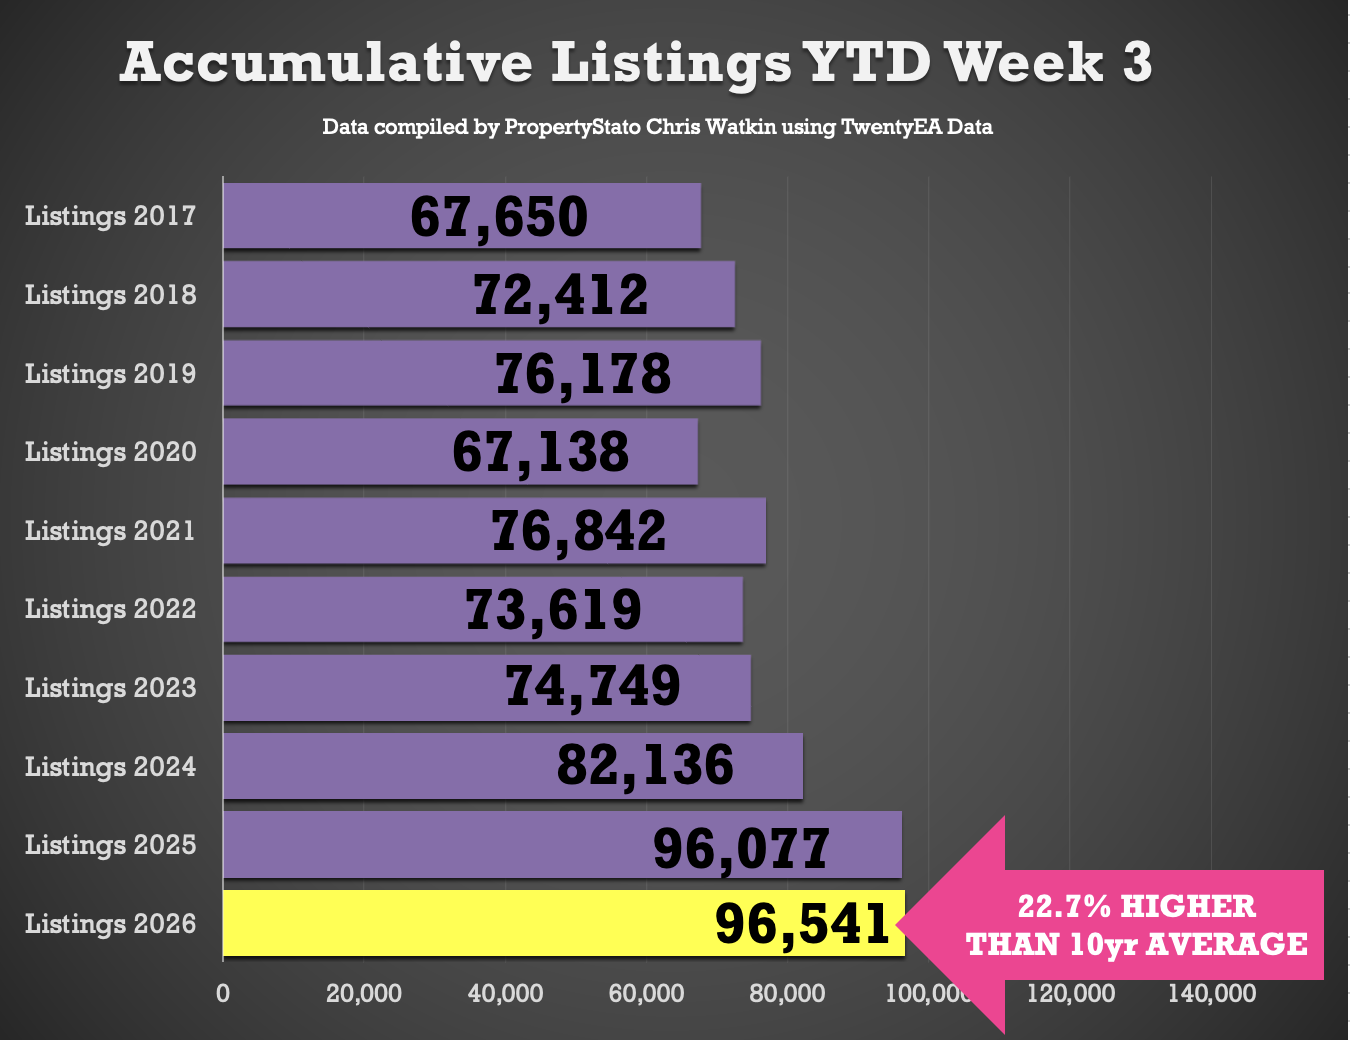
+ Year-to-date (YTD): 96.5k new listings, 0.5% above than 2025 YTD (96.1k), 17.5% above 2024 YTD (82.1k) and 34% above the 2017–19 average (72k).
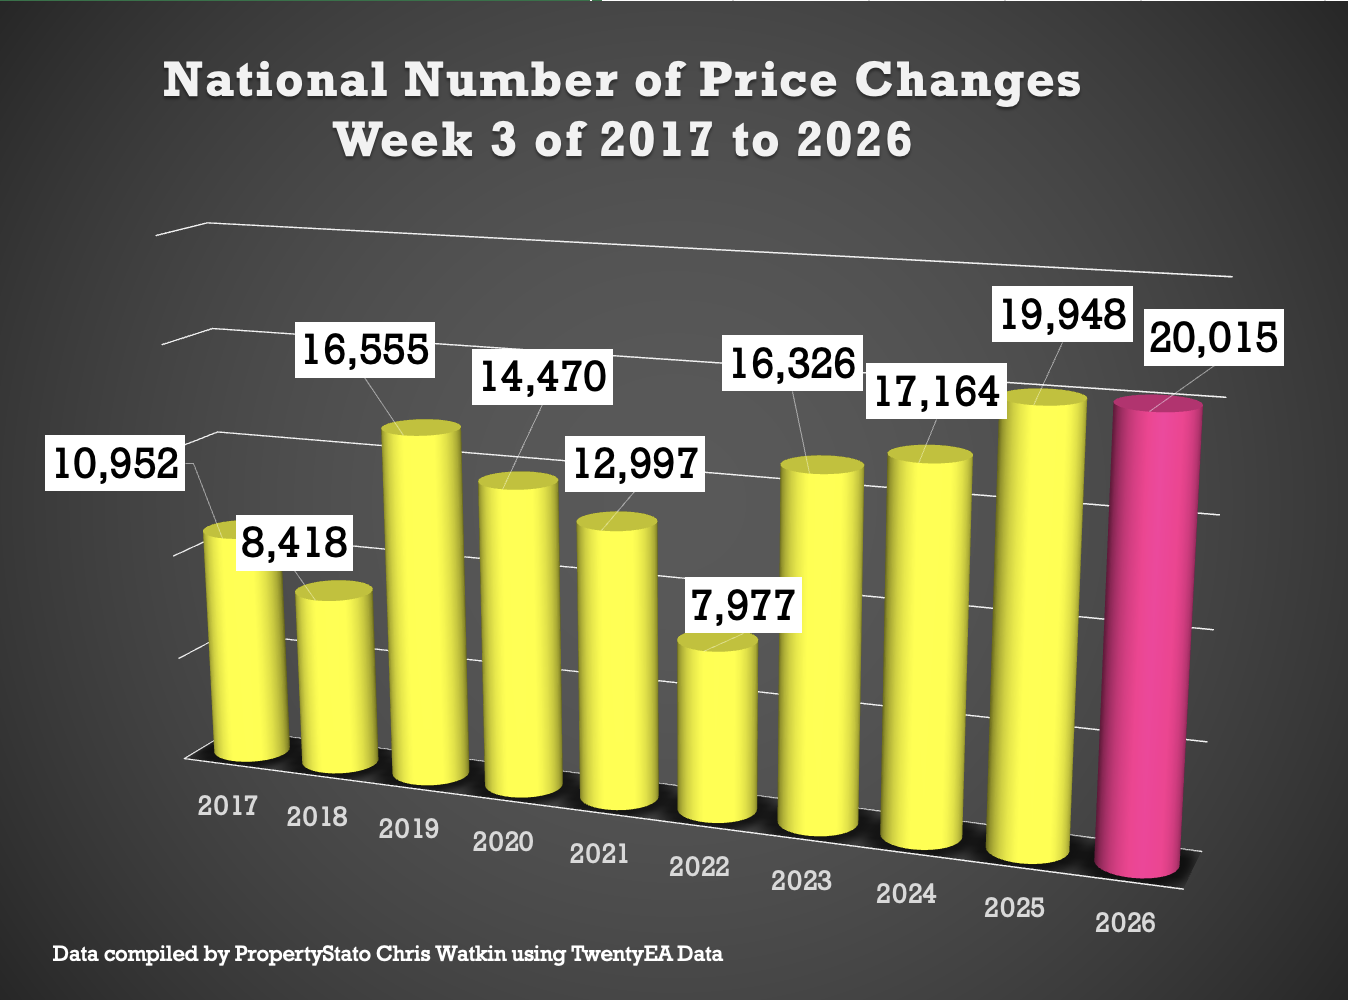
✅ Price Reductions
+ 20k reductions this week
+ 7.6% of resi homes for sale were reduced in December. Compared to Oct 12.8%, Sept 14.1%, August 11.1%, July 14.1% in July and 14% in June.
+ 2025 average was 12.8%, versus the five-year long-term average of 10.74%.
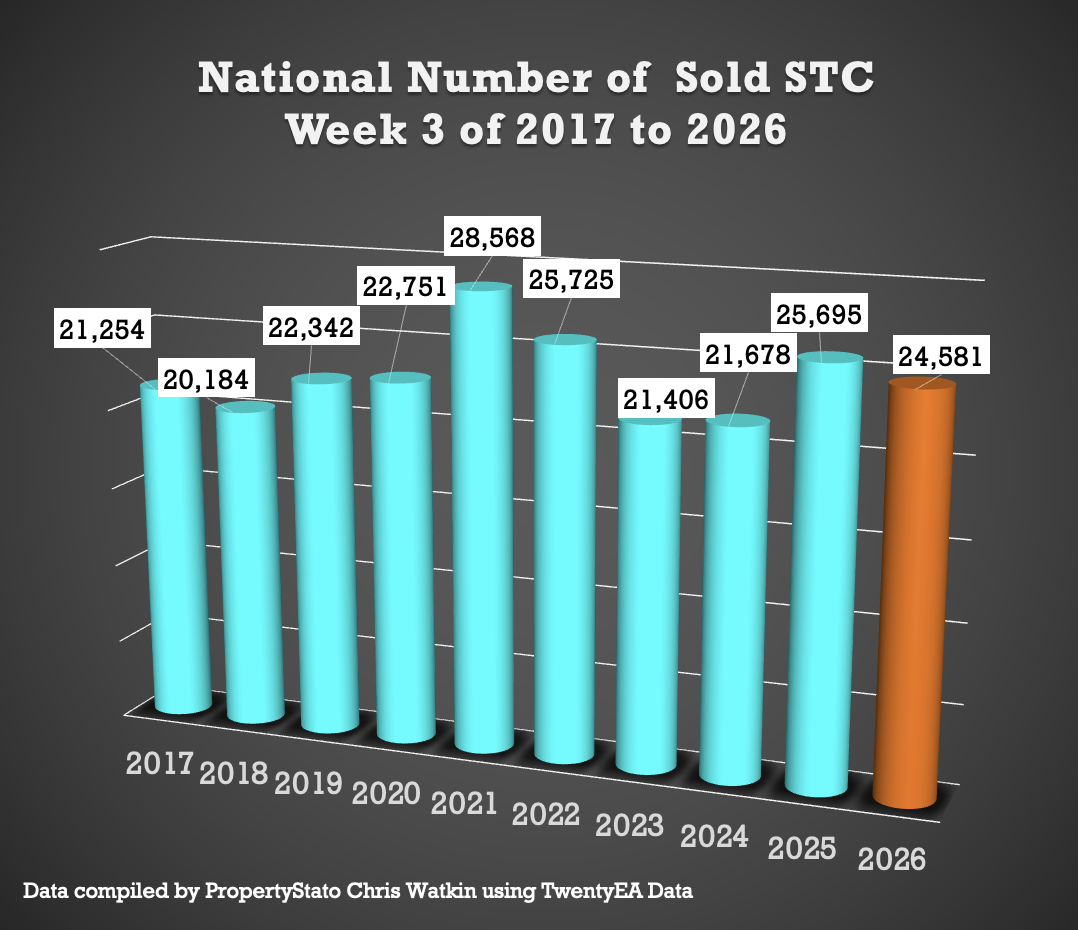
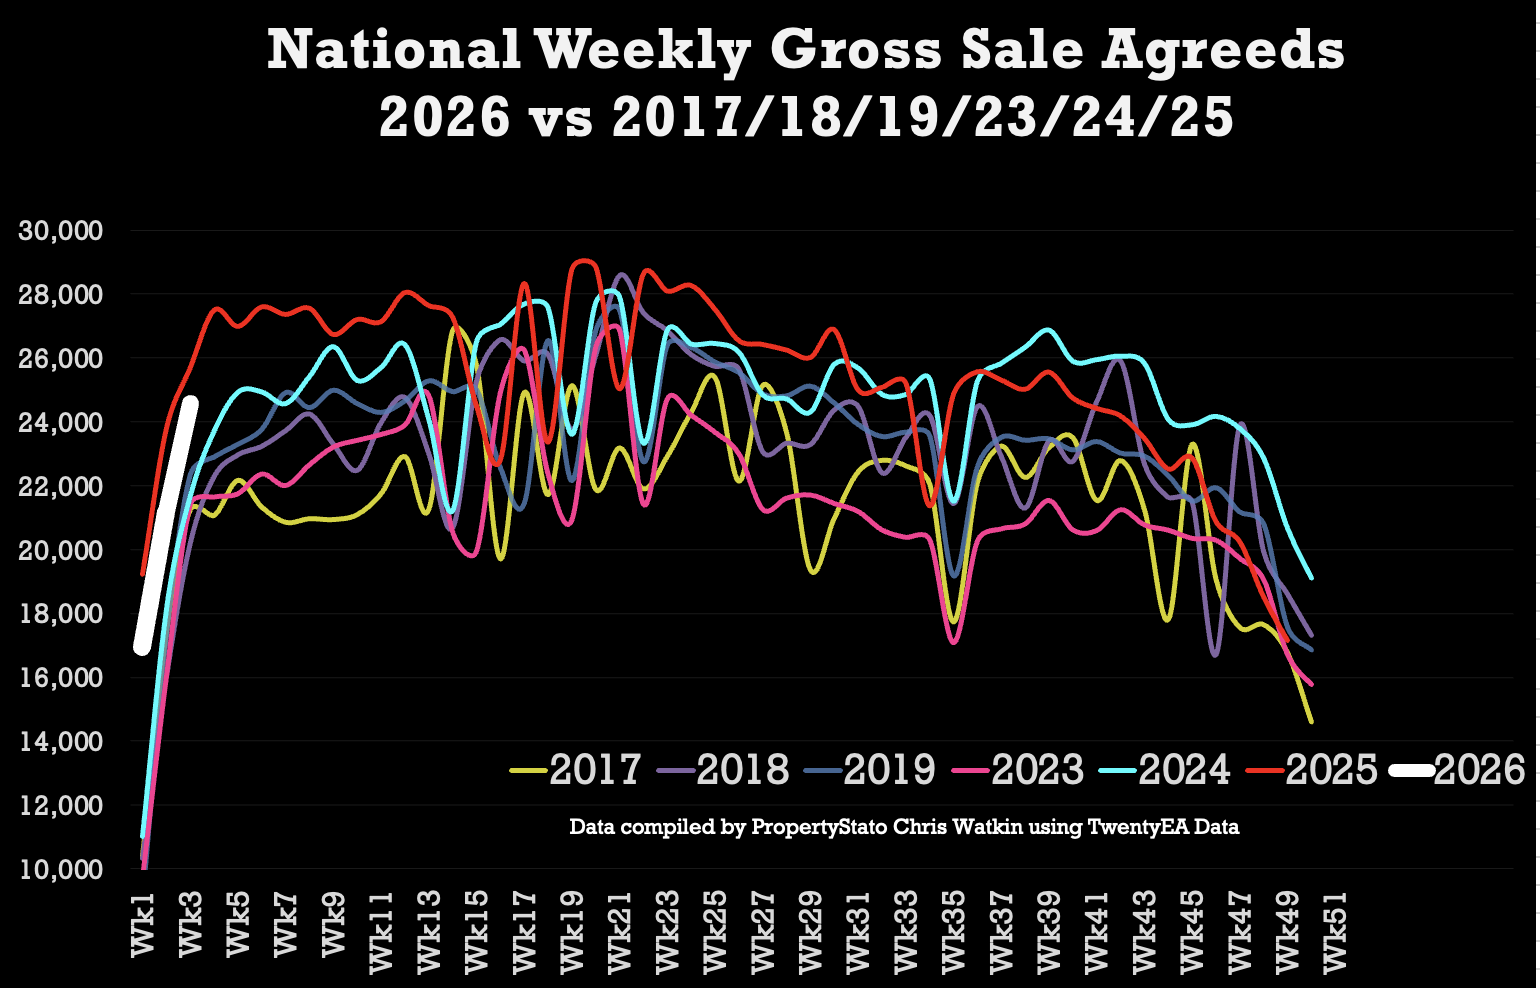
✅ Sales Agreed
+ 24.6k homes sold stc this week 3, up expectedly from 21.2k last week.
+ Week 3 average (for last 10 years) : 23.4k
+ 2026 weekly average : 19.1k.
+ YTD: 62.7k gross sales, which is 8.7% behind Week 3 YTD of 2025 (68.7k), yet 23.5% ahead of wk.3 2024 (50.8k) and 30.6% above the 2017–19 average (48k).
+ Thoughts – January 2025 was an exceptional month as we had the stamp duty deadline for April 2025 – here it was a good sales month. To be ahead of 2024 and pre Covid years by such a amount is good to see.
✅ Price Diff between Listings & Sales
+ Average Asking Price of listings last week £413k
+ Average asking price of Sales Agreed (SSTC)last week was £348k
+ A 18.8% difference (long term 9 year average is 16% to 17%).
✅ Sell-Through Rate
+ 9.9% of homes on agents’ books went SSTC in December ’25. Down as expected from 13.5% in November, 15% in October, 14.1% in Sept, 14.5% in Aug, 15.4% in July, 15.3% in June, and 16.1% in May.
+ Pre-Covid average: 15.5%.
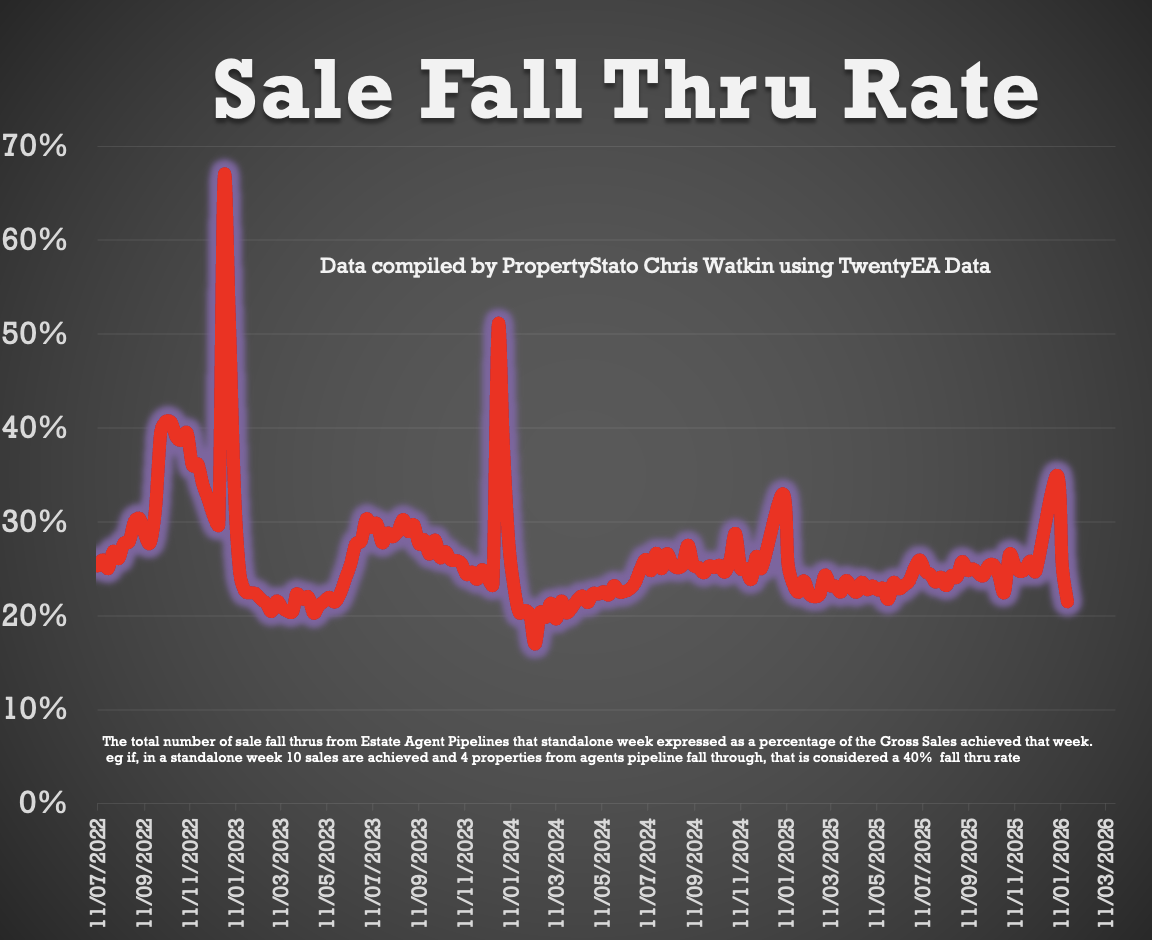
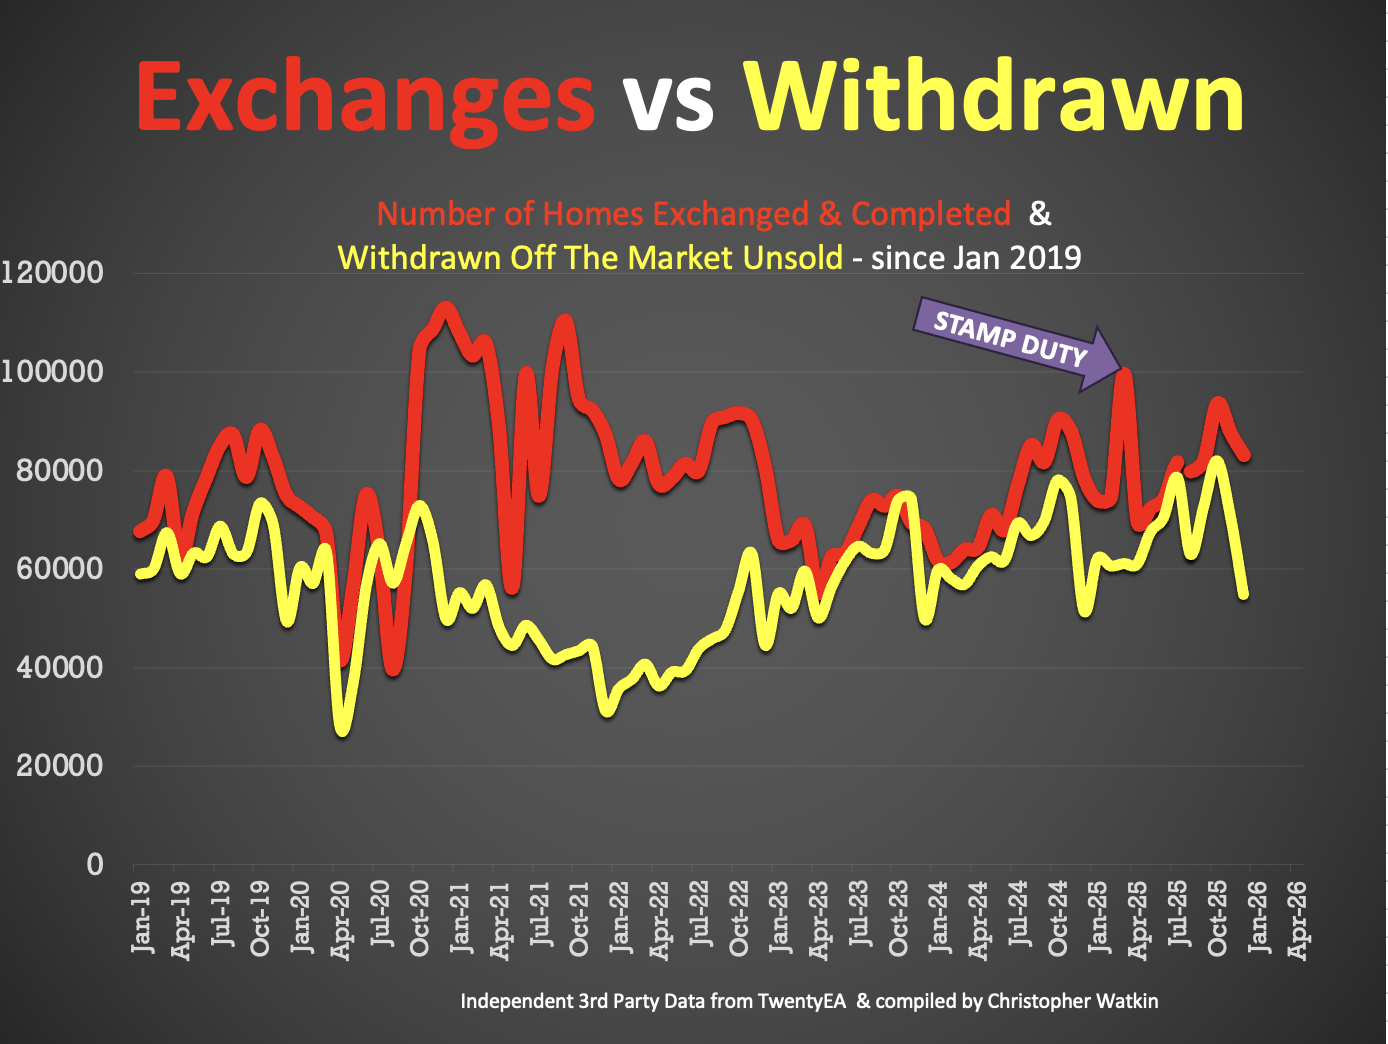
✅ Fall-Throughs
+ 4,783 fall-throughs last week (pipeline of 482k home Sold STC).
+ Weekly average for 2025: 6,100.
+ Fall-through rate: 21.48%, slightly up from 24.9% last week.
+ Long-term average: 24.2% (post-Truss chaos saw levels exceed 40%).
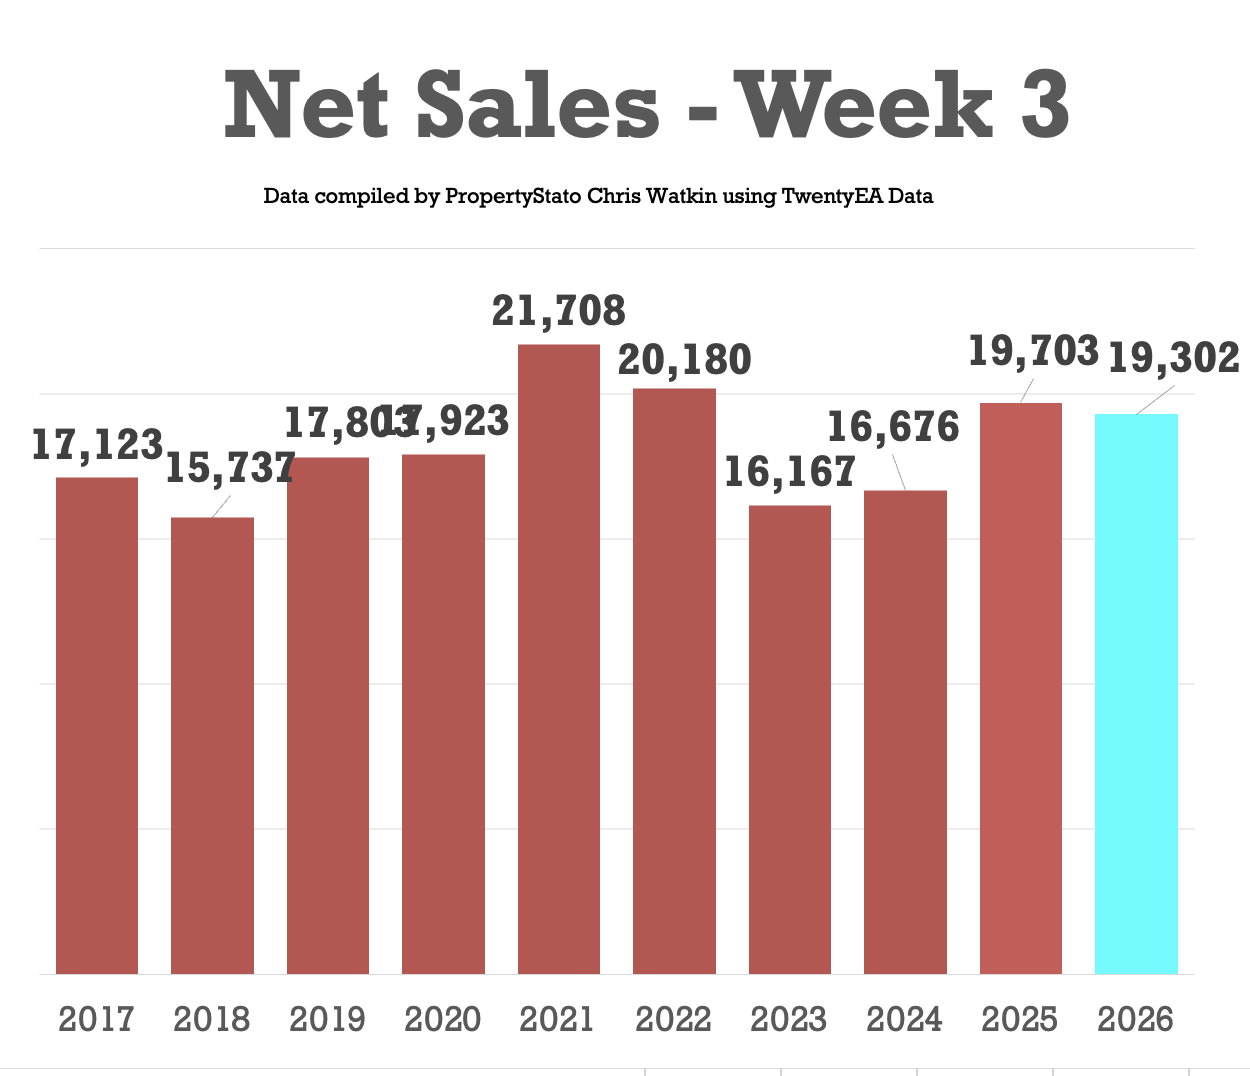
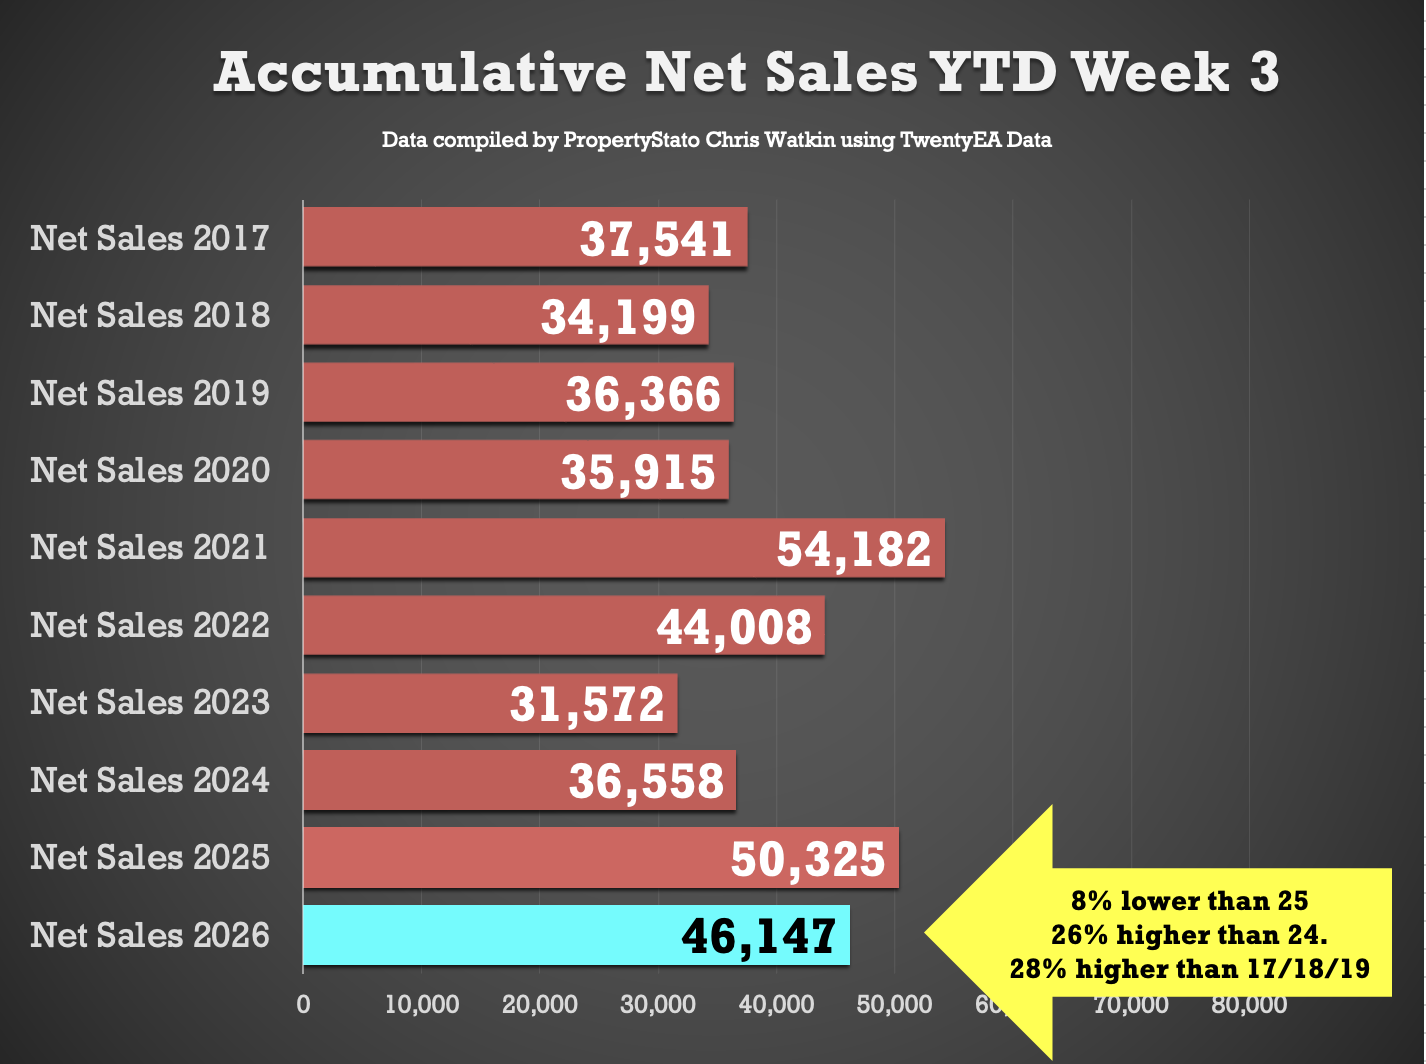
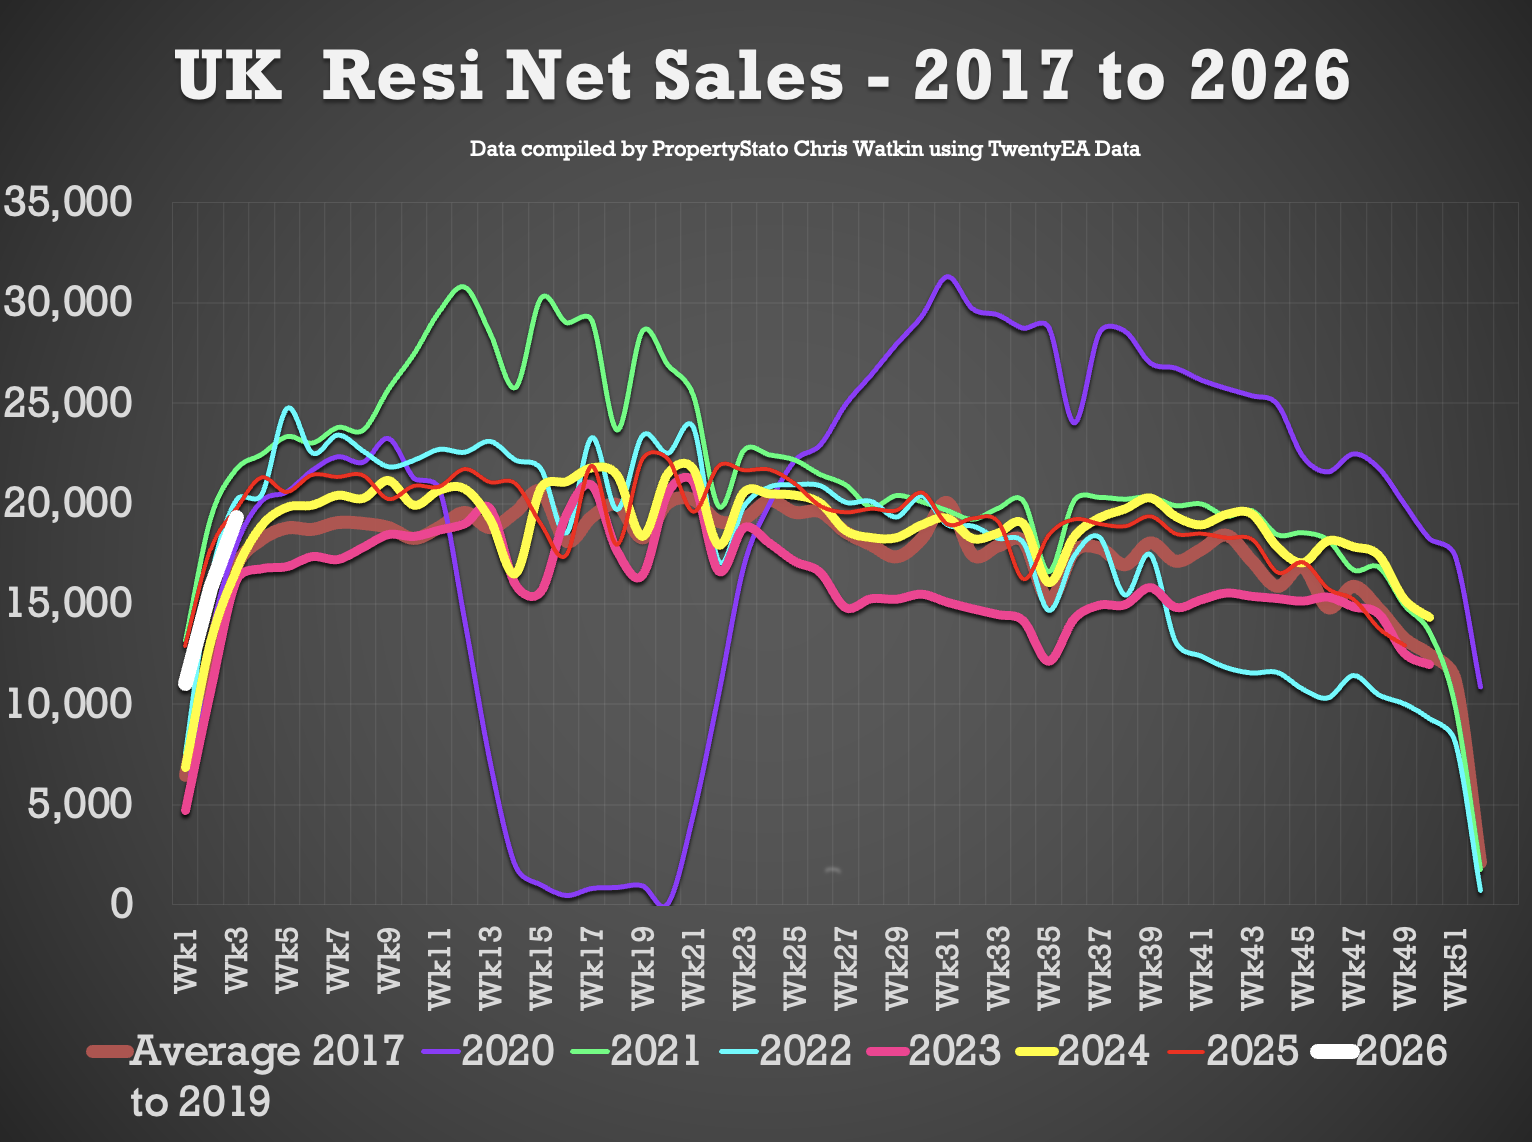
✅ Net Sales
+ Huge jump in net sales from last week. 19.3k, up from 15.8k last week.
+ Ten-year Week 3 average: 18.2k.
+ Weekly average for 2026: 15.4k.
+ Weekly average for the whole of 2025: 19.2k.
+ YTD: 46.1k, which is 8.3% behind Wk.3 of 2025 (30.6k), 35% ahead of wk2 2024 (19.9k) and 40% ahead of wk2 2017–19 (19.1k).
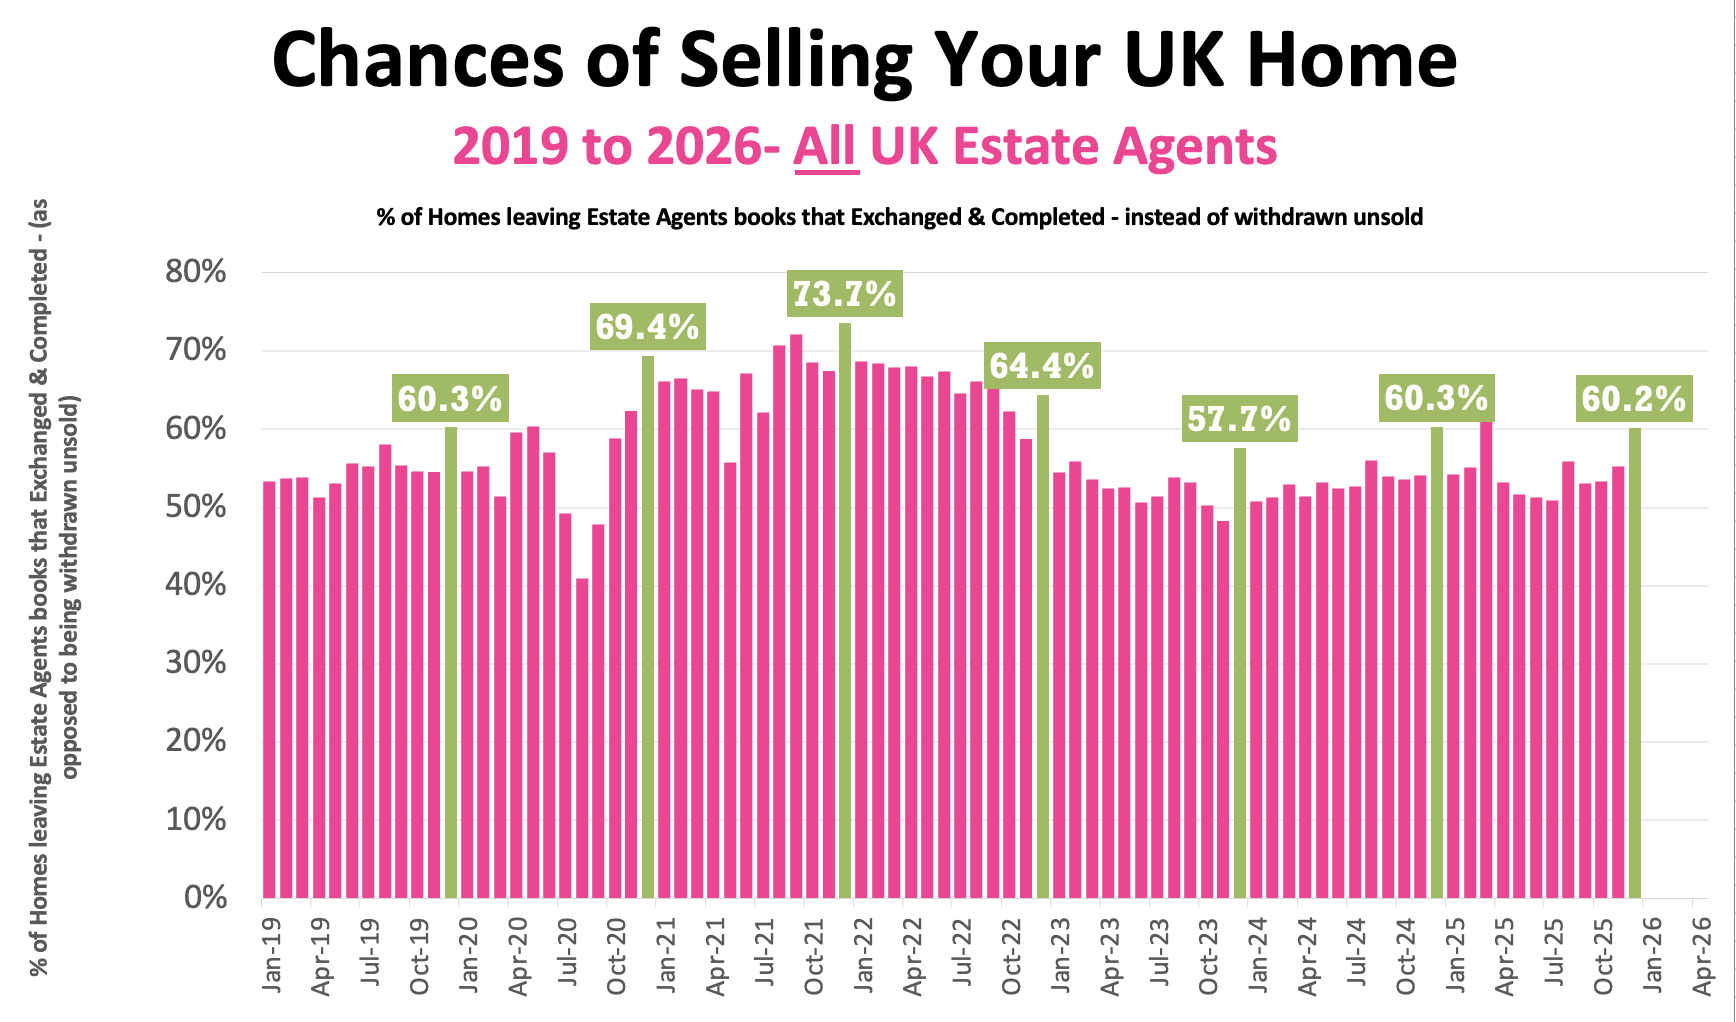
✅ Probability of Selling (% that Exchange vs withdrawal)
+ December Stats : 60.2% of homes that left agents’ books exchanged & completed in December. (Note this figure will change throughout the month as more December stats come in).
+ November 55.2% / October 53.3% / September: 53.1% / August :55.8% / July: 50.9% / June: 51.3% / May: 51.7% / April: 53.2%.
+ Dec 24: 60.3% / Dec 23: 57.7% / Dec 22: 64.4% / Dec 21: 73.7%.
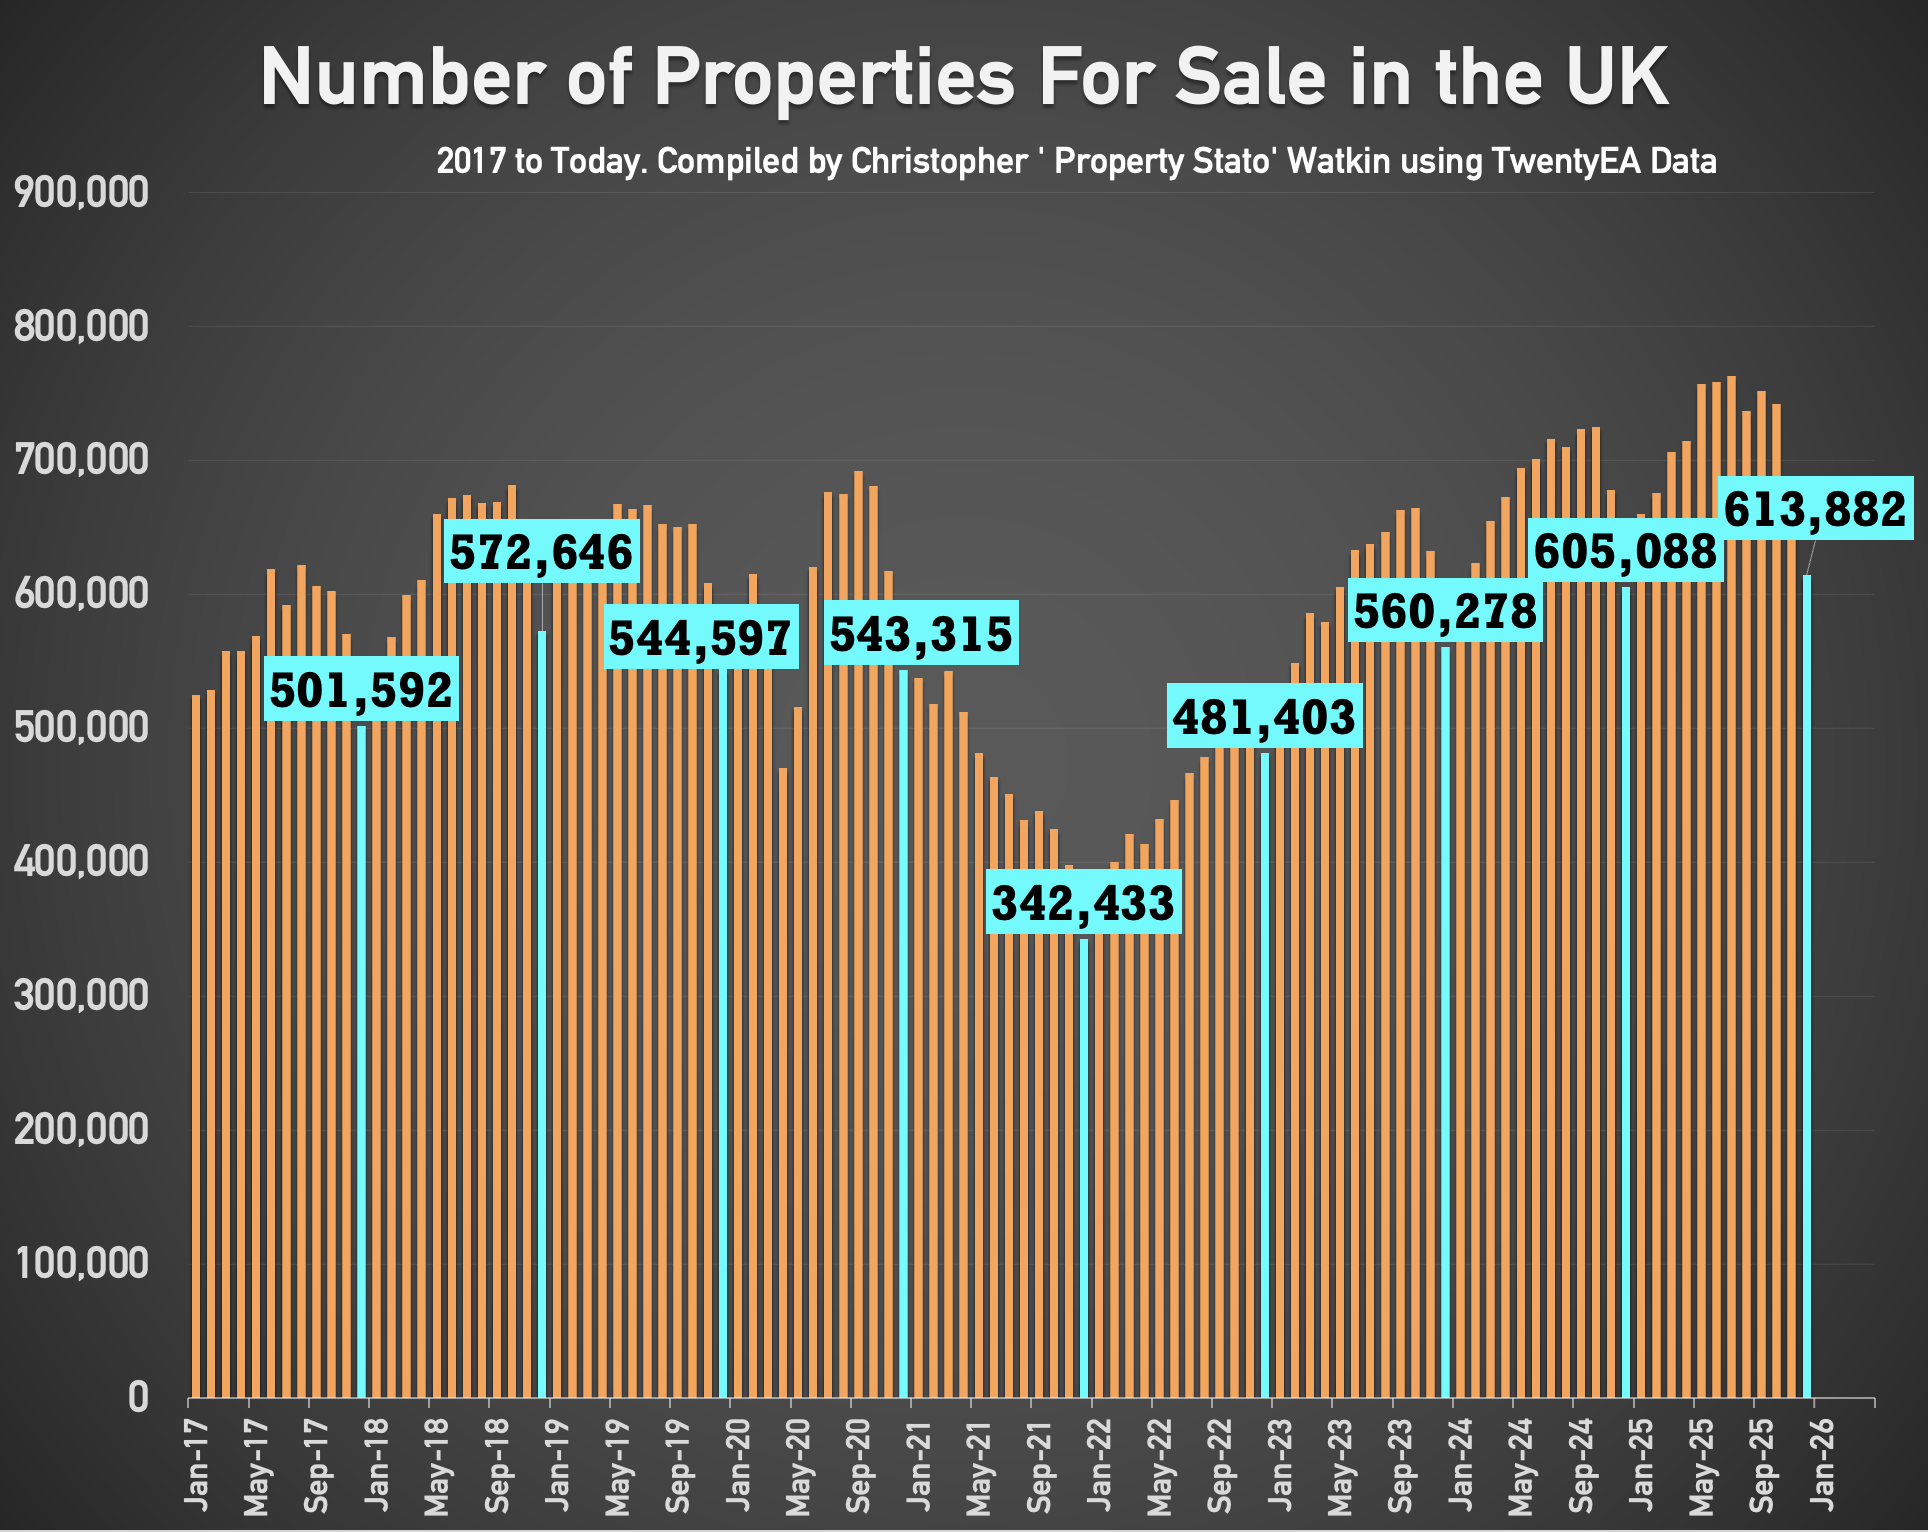
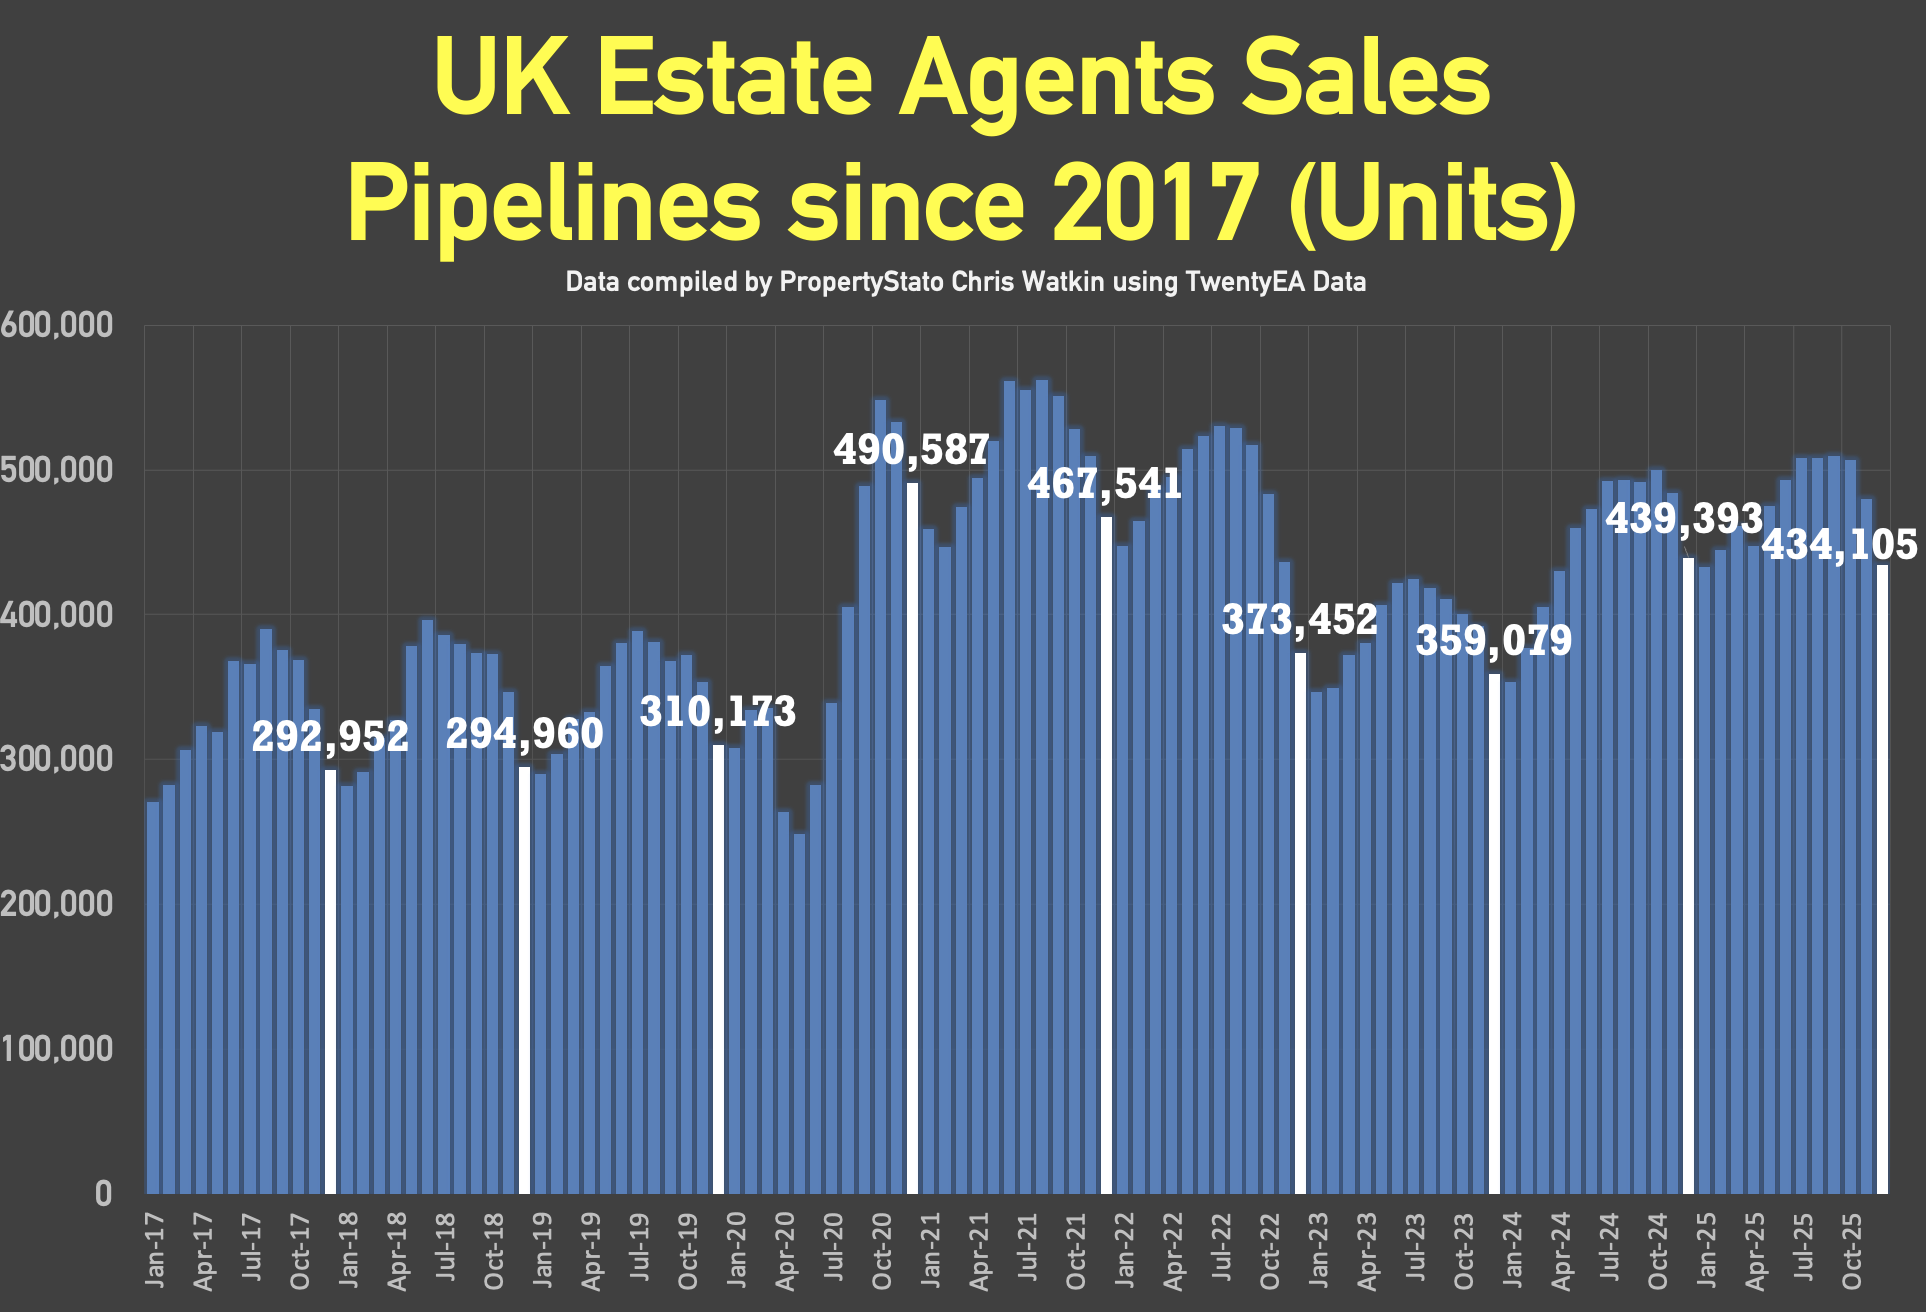
✅ Stock Levels
+ 613k homes on the market on the 1st of January ’26 , down from 678k on 1st of December ’25 . (605k on the market on 1st Jan ’25 for comparison)
+ 434k homes in agent’s sales pipeline on the 1st Jan 2026, almost identical than 12 months ago on 1st Jan ’25 (439k).
✅ House Prices (£/sq.ft)
+ December 2025 agreed sales averaged £337.09 per sq.ft. 0.6% higher than 12 months ago (£335.04) and 12.6% than 5 years ago (£299.30). The £/sqft at sale agreed matches the HM Land Registry Index with a 98% accuracy, 5 months in advance. That is why it is so important.
✅ UK Rental Market Overview
+ Average Rent in December 2025 – £1,702 pcm – compared to £1,719 pcm in Dec 2024 and £1,301 pcm in Dec 2017.
+ Available Rental Properties in December ’25 – 285k compared to 321k in November ’25. (Dec ’24 – 258k and Dec ’23 – 235k).

LISTINGS: STRONG
96,500 New Listings (YTD)
+0.5% vs 2025
+17.5% vs 2024
+34% vs 17–19 Avg
GROSS SALES: HEALTHY
62,700 Sold STC (YTD)
+23.5% vs 2024
+30.6% vs Pre-Covid
NET SALES: ACCELERATING
46,100 Net Sales (YTD)
+35% vs 2024
+40% vs 17–19 Avg
You must be logged in to like or dislike this comments.
Click to login
Don't have an account? Click here to register