

 In the first show of 2026, I take a look at the UK property market in the UK Property Market Stats Show for the week ending Sunday 18 January 2026 (week two), alongside the brilliant Ben Madden, founder of Digital Sparks and chair of Fine & Country NAC.
✅ New Listings
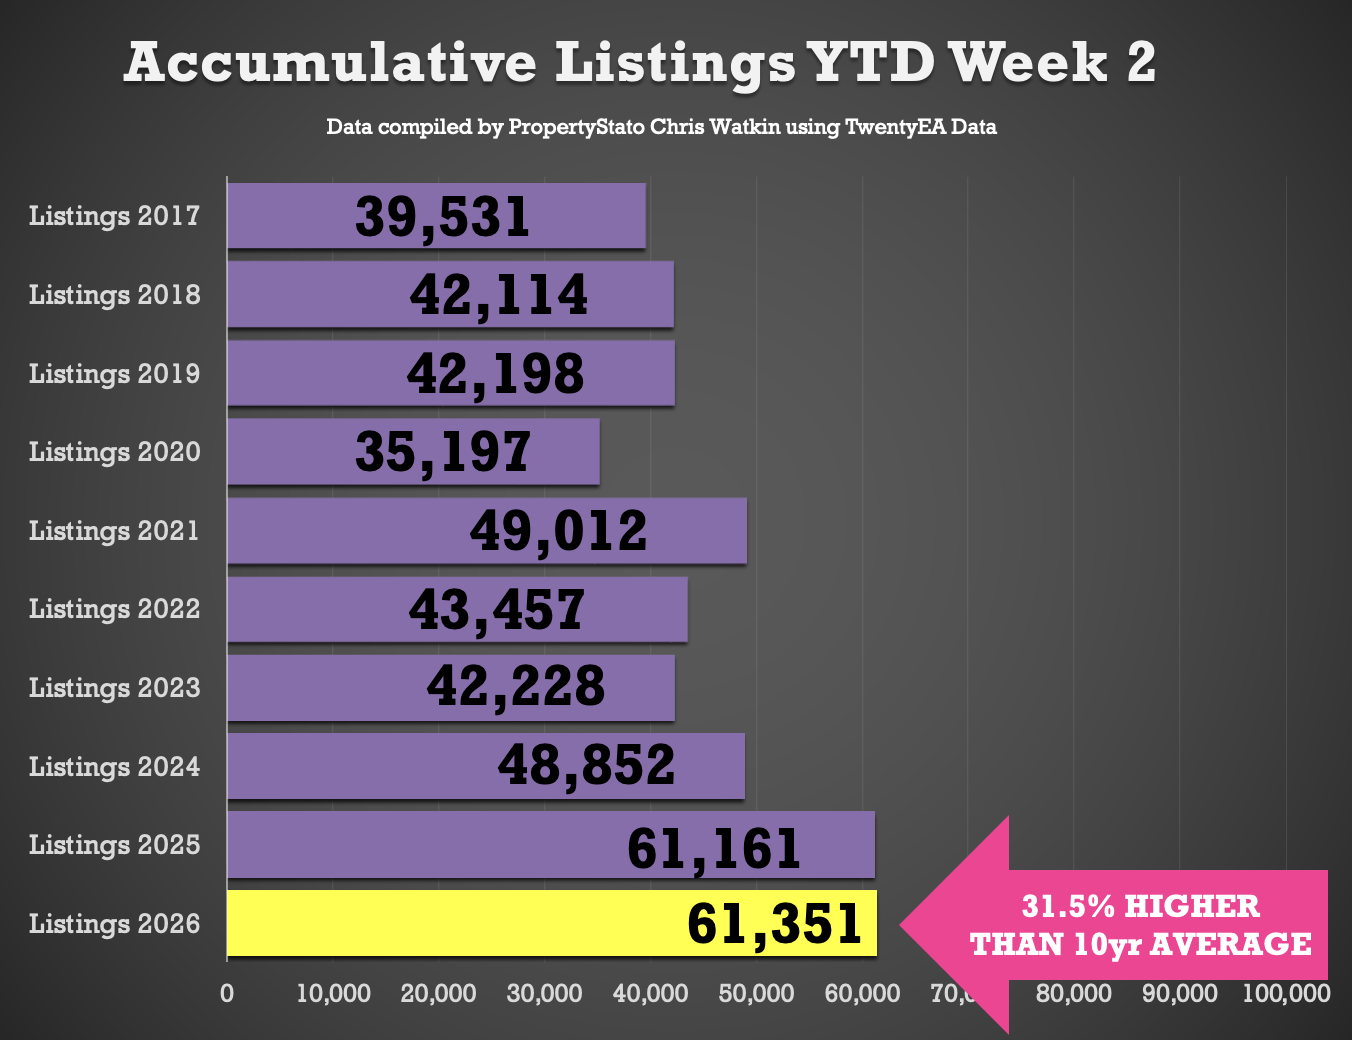
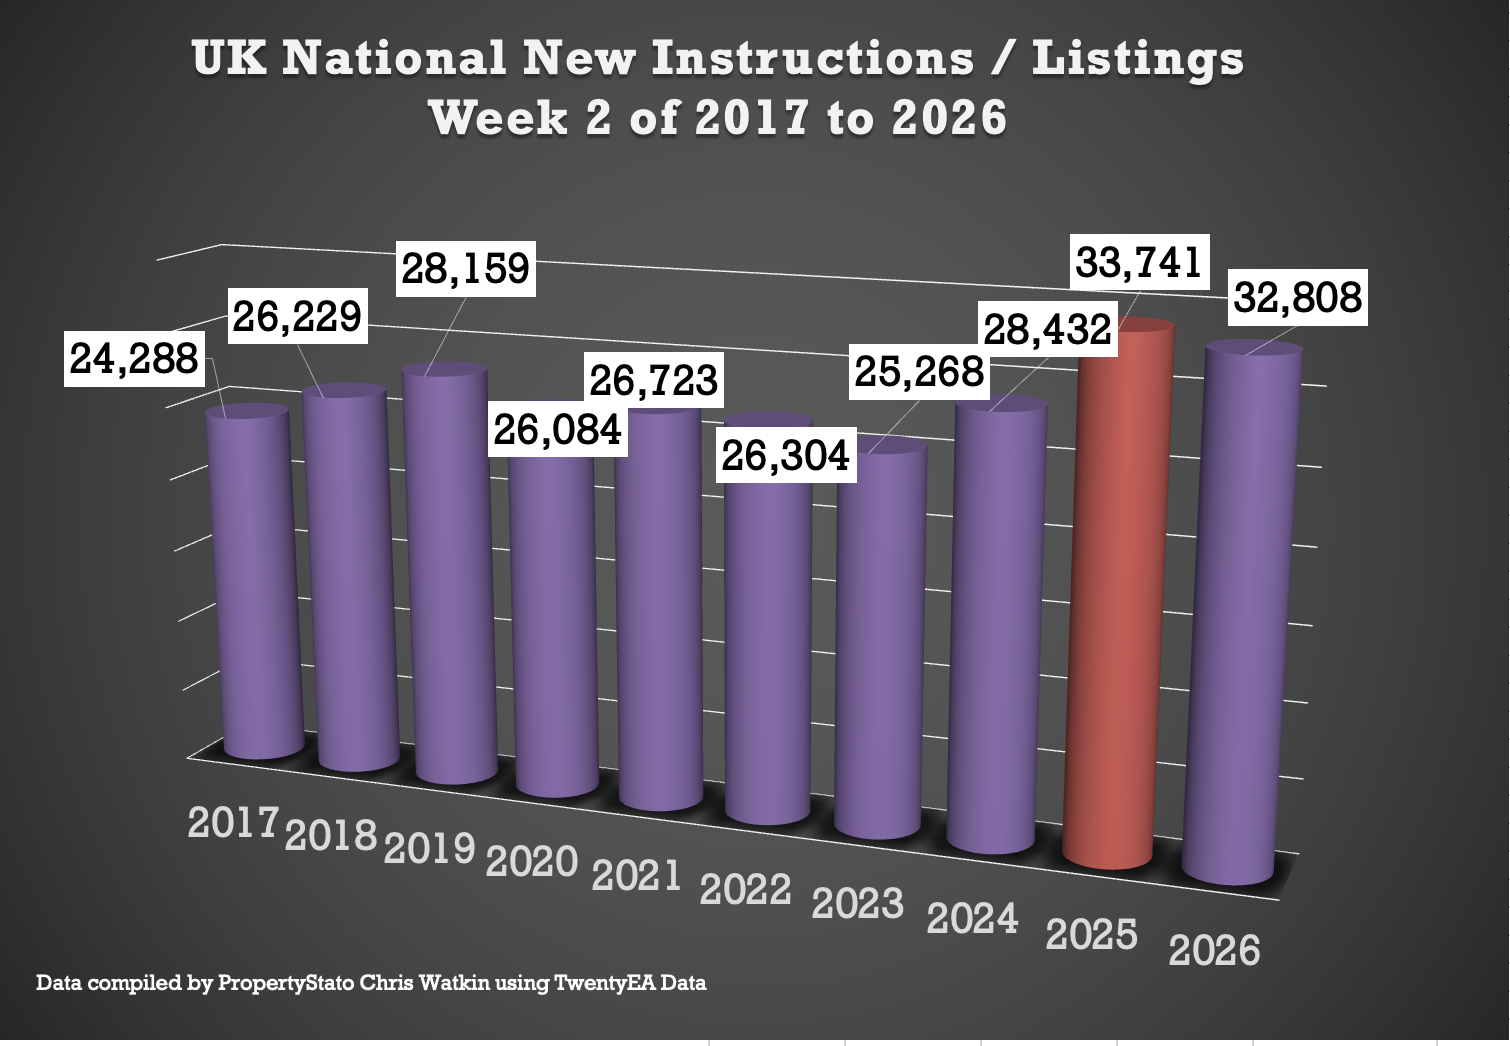
+ 32.8k new properties came to market this week, up as expected from 28.5k last week.
+ 2025 weekly average: 30.6k.
+ 10-year week 2 average : 27.8k
+ Year-to-date (YTD): 61.3k new listings, 0.3% above than 2025 YTD (61.1k), 25.6% above 2024 YTD and 49% above the 2017–19 average (41.3k).
✅ Price Reductions
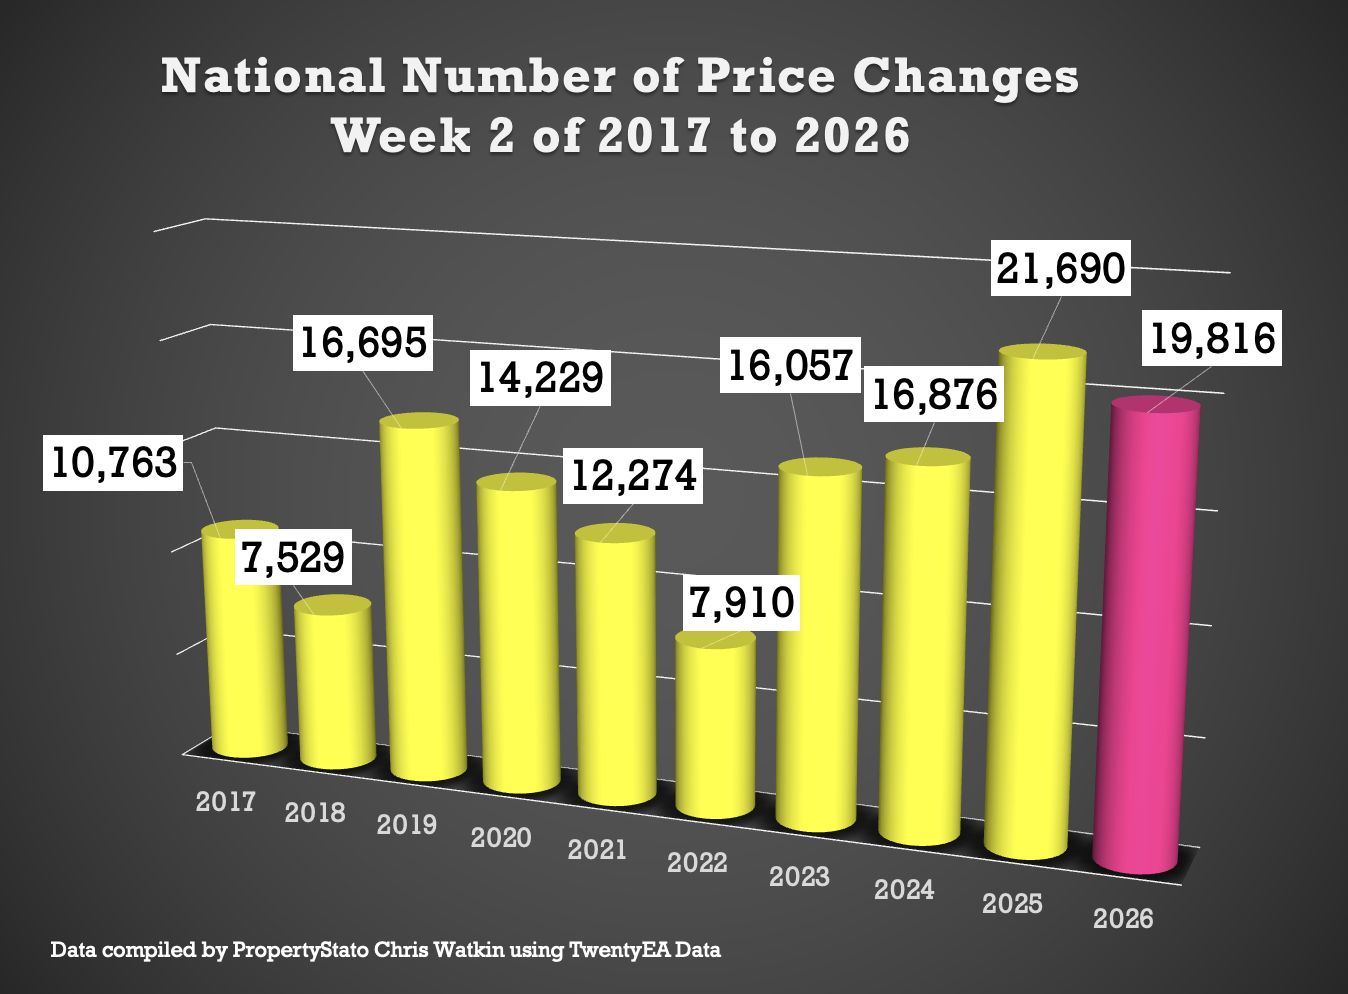
+ 19.8k reductions this week
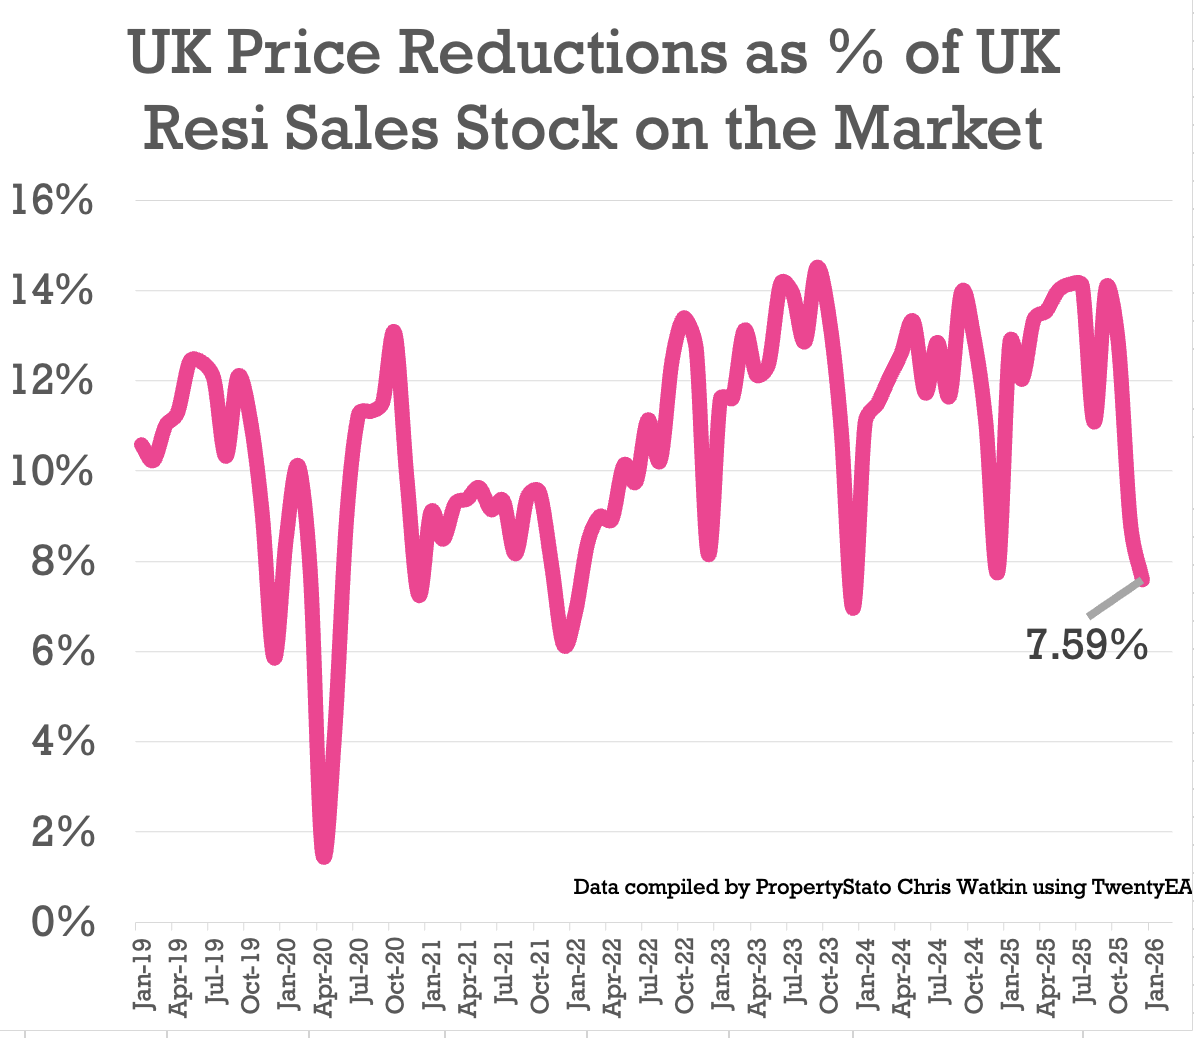
+ 7.6% of resi homes for sale were reduced in December. Compared to Oct 12.8%, Sept 14.1%, August 11.1%, July 14.1% in July and 14% in June.
+ 2025 average was 12.8%, versus the five-year long-term average of 10.74%.
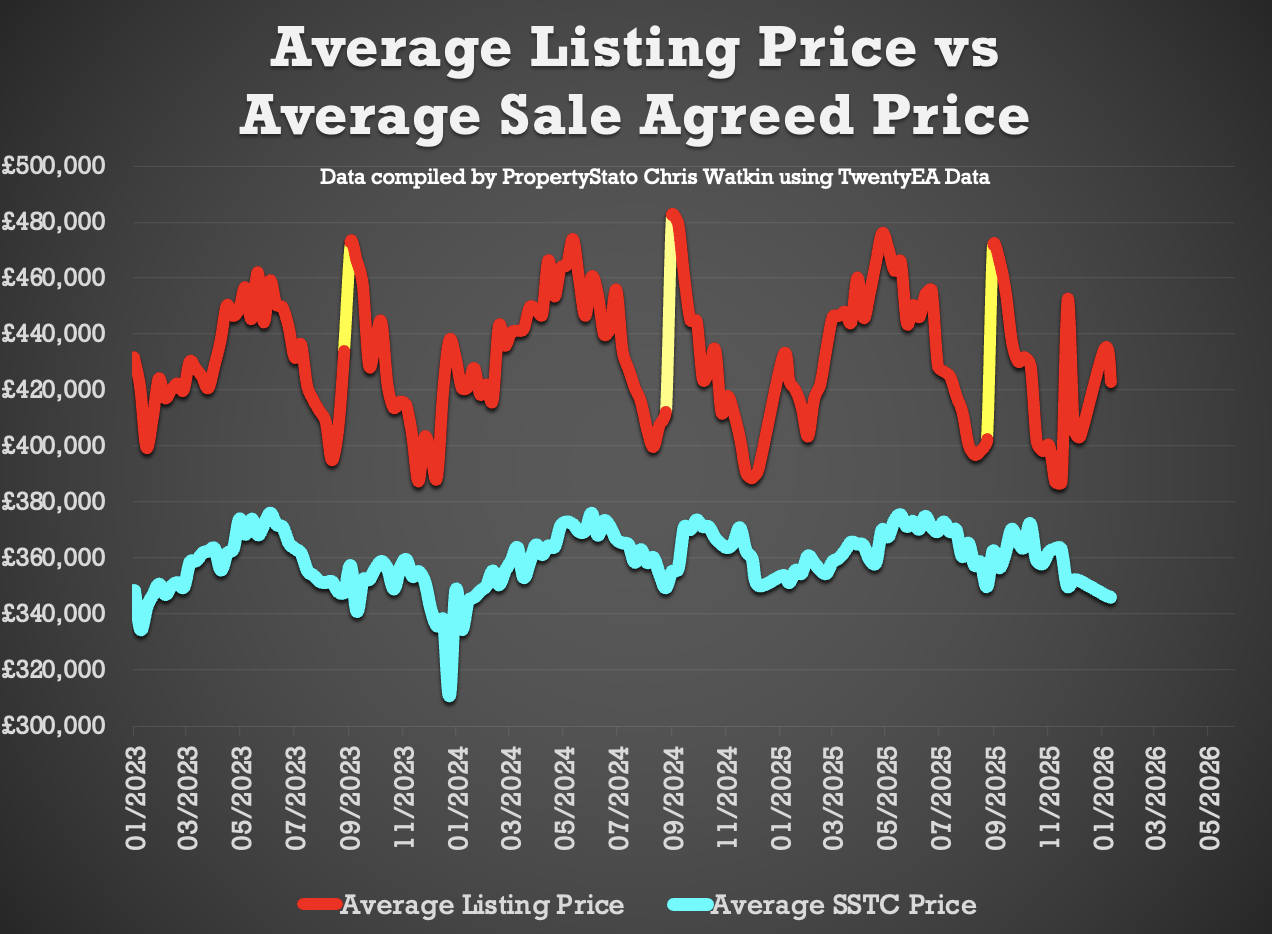
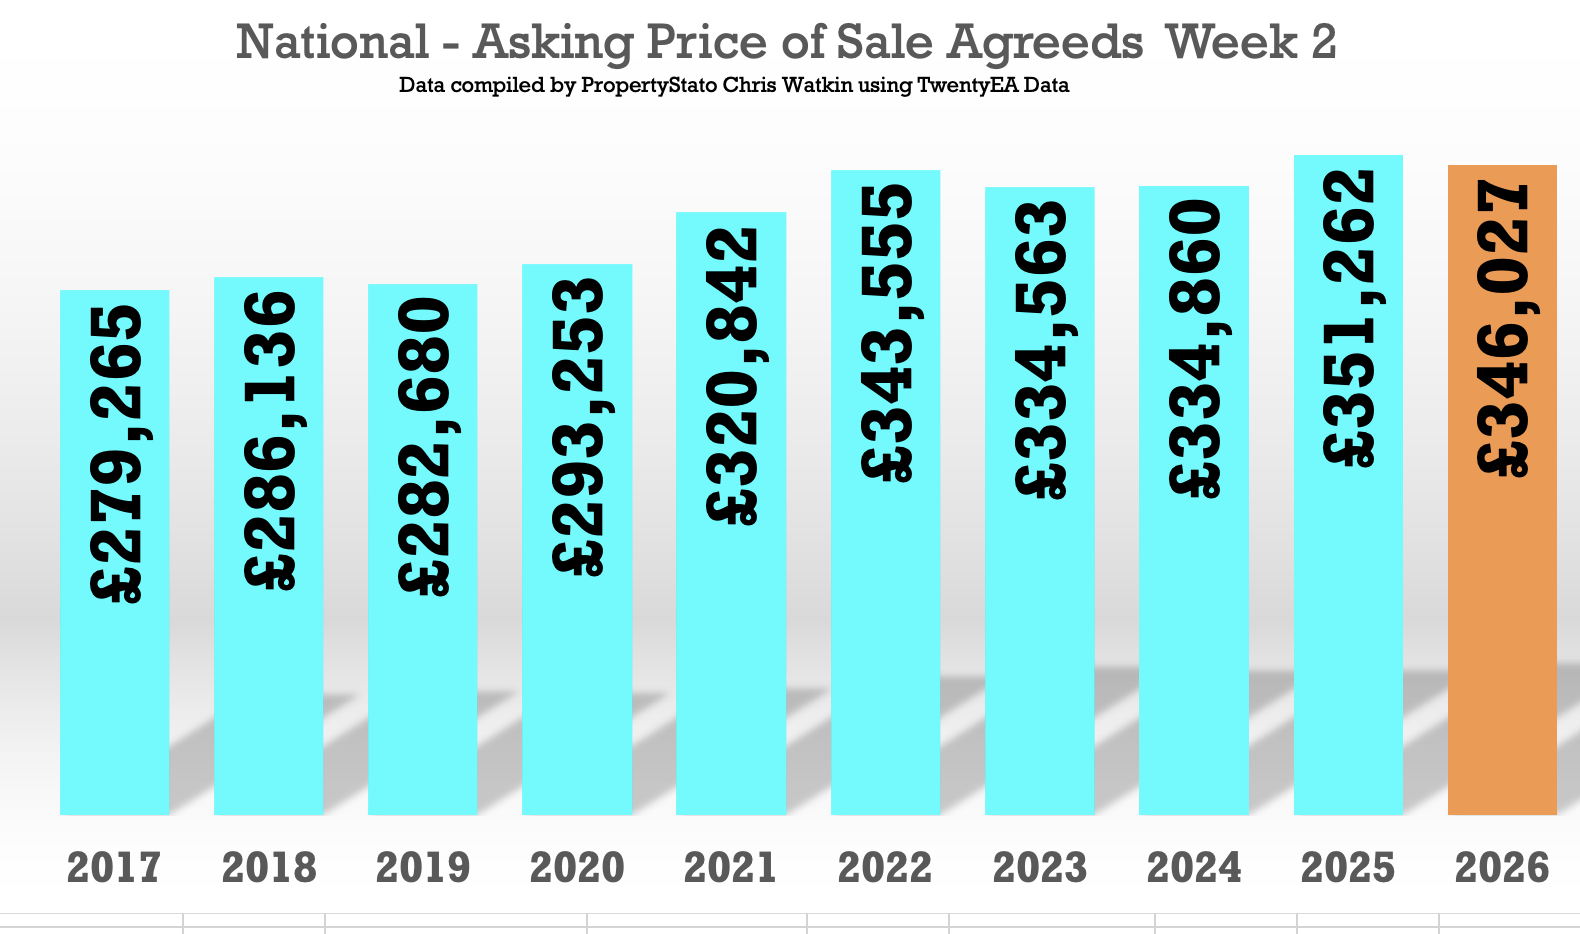
✅ Price Diff between Listings & Sales
+ Average Asking Price of listings last week £423k
+ Average asking price of Sales Agreed (SSTC)last week was £346k
+ A 22.2% difference (long term 9 year average is 16% to 17%).
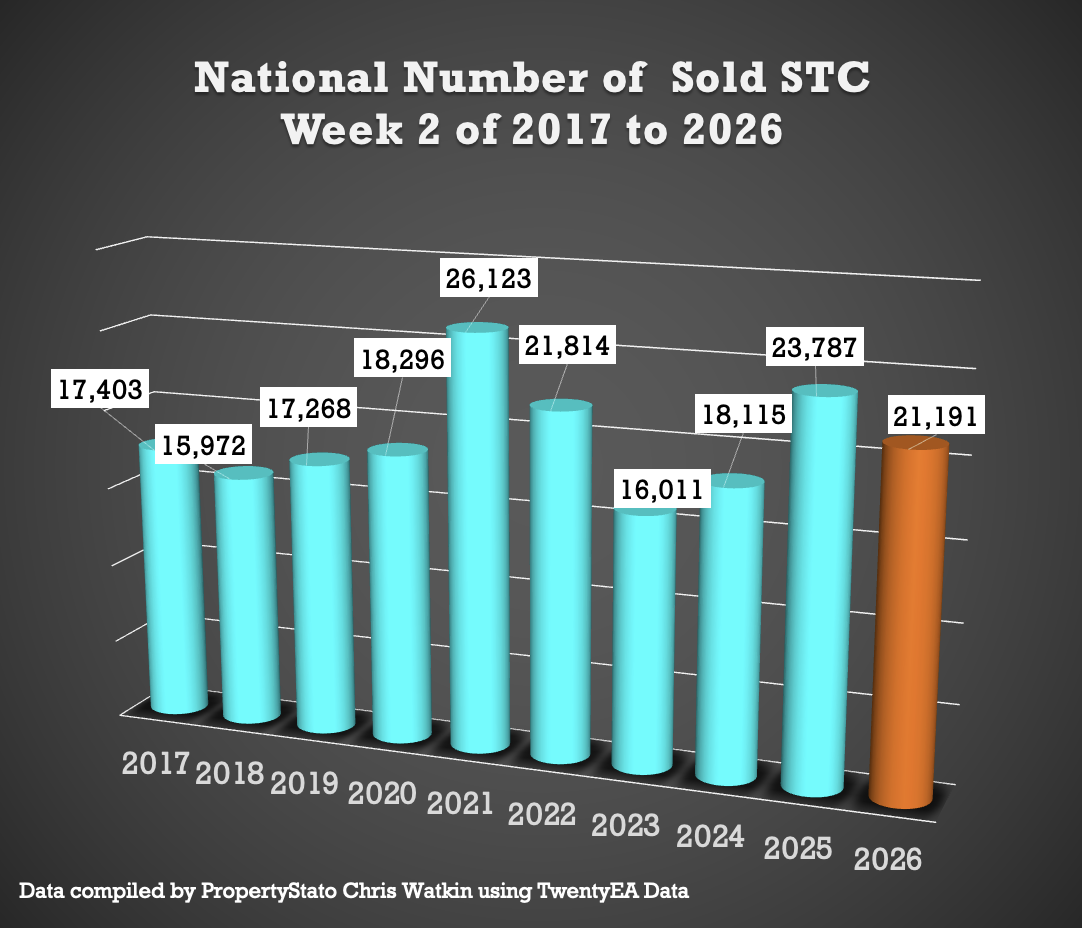
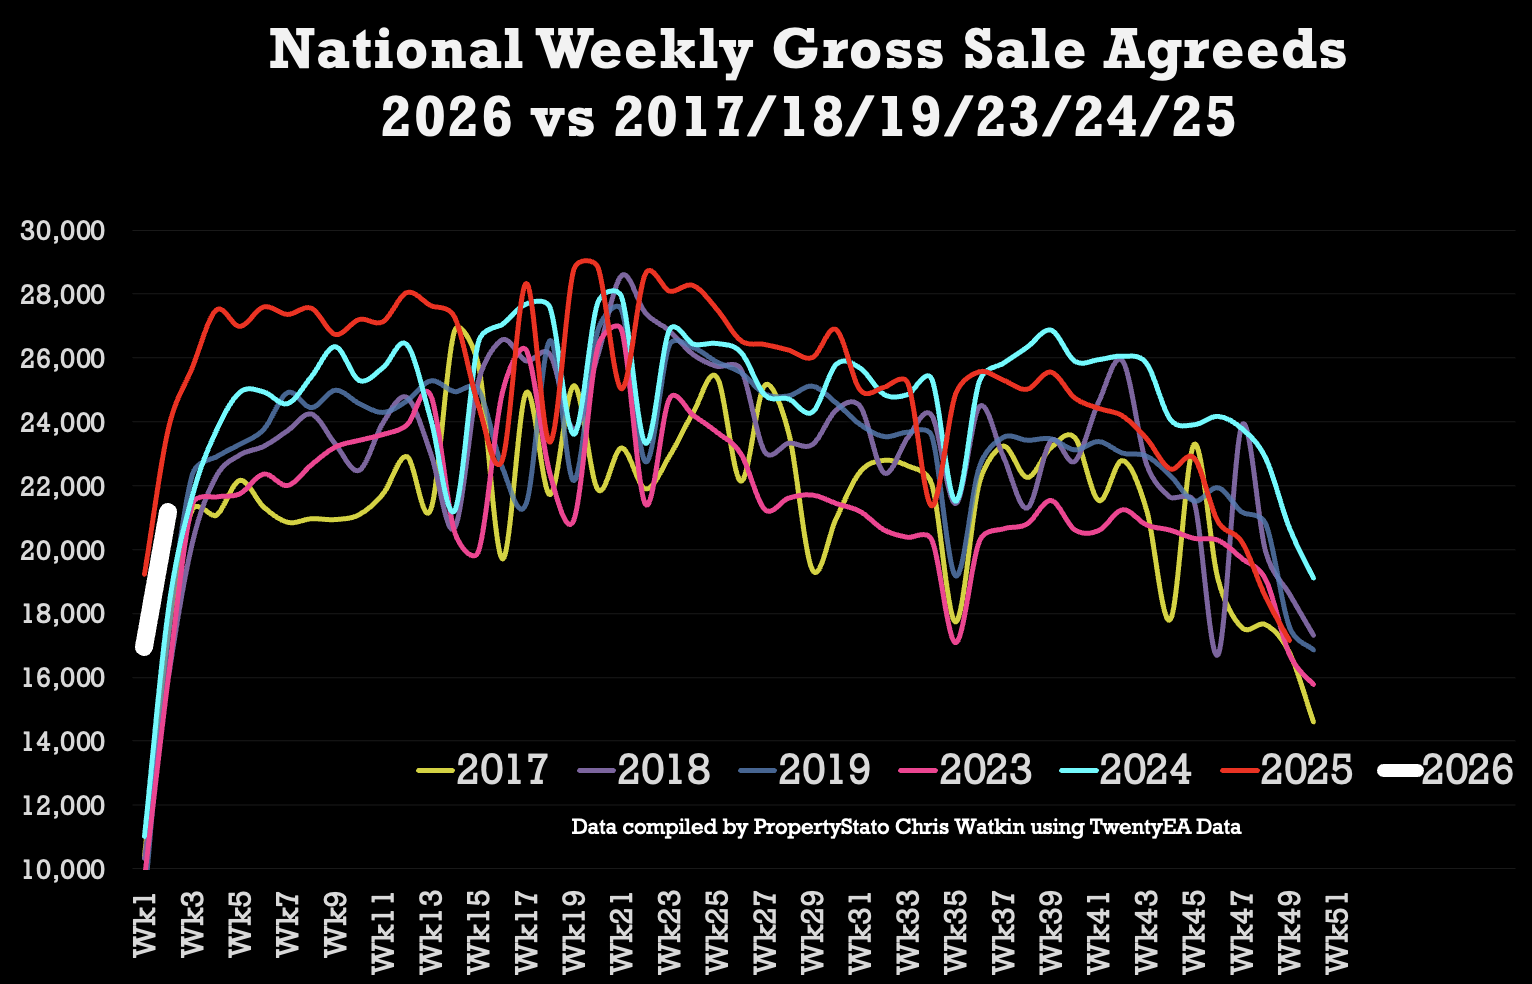
✅ Sales Agreed
+ 21.2k homes sold subject to contract this week, up expectedly from 17k last week.
+ Week 2 average (for last 10 years) : 19.6k
+ 2026 weekly average : 19.1k.
+ YTD: 38.2k gross sales, which is 11.3% behind Week 2 YTD of 2025 (43k), yet 31% ahead of wk.2 2024 (29.1k) and 42.4% above the 2017–19 average (26.8k).
+ Thoughts – January 2025 was an exceptional month as we had the stamp duty deadline for April 2025.
✅ Sell-Through Rate
+ 9.9% of homes on agents’ books went SSTC in December ’25. Down as expected from 13.5% in November, 15% in October, 14.1% in Sept, 14.5% in Aug, 15.4% in July, 15.3% in June, and 16.1% in May.
+ Pre-Covid average: 15.5%.
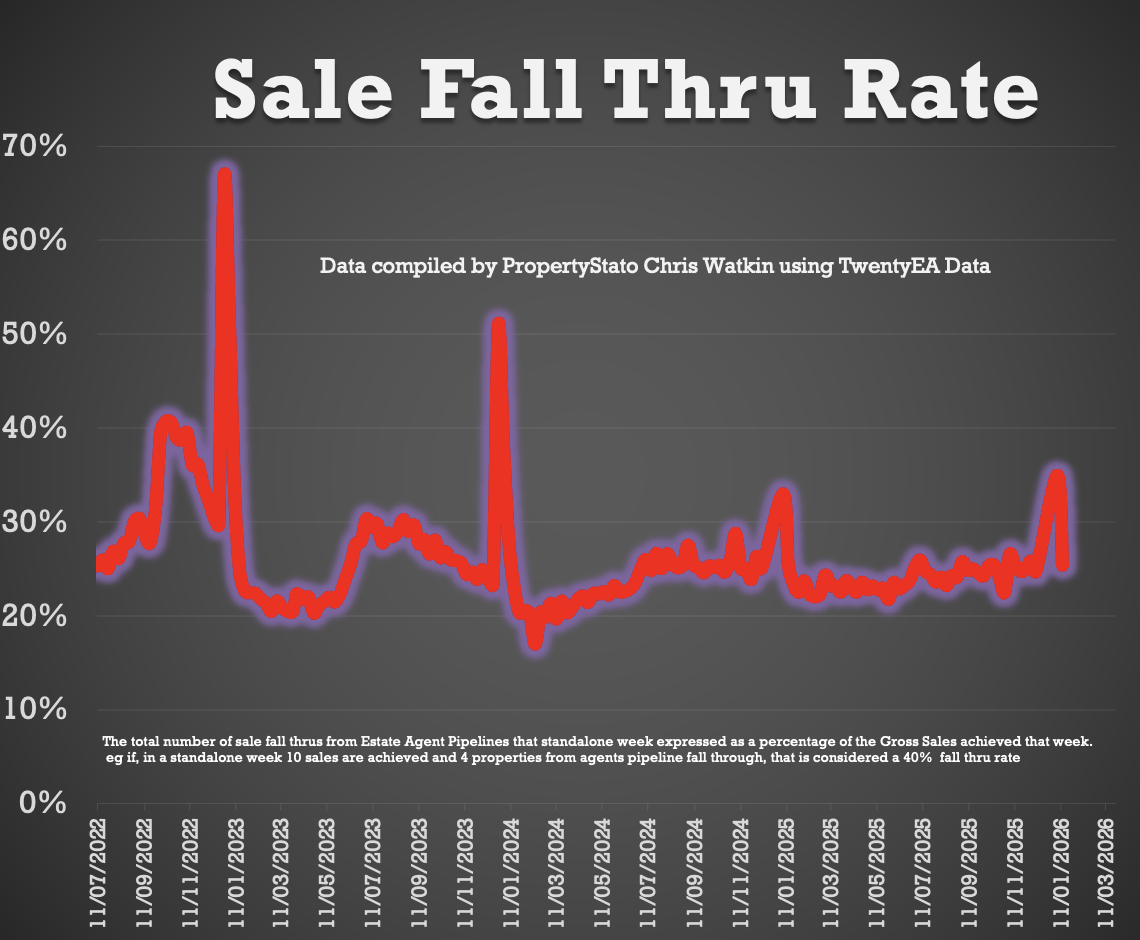
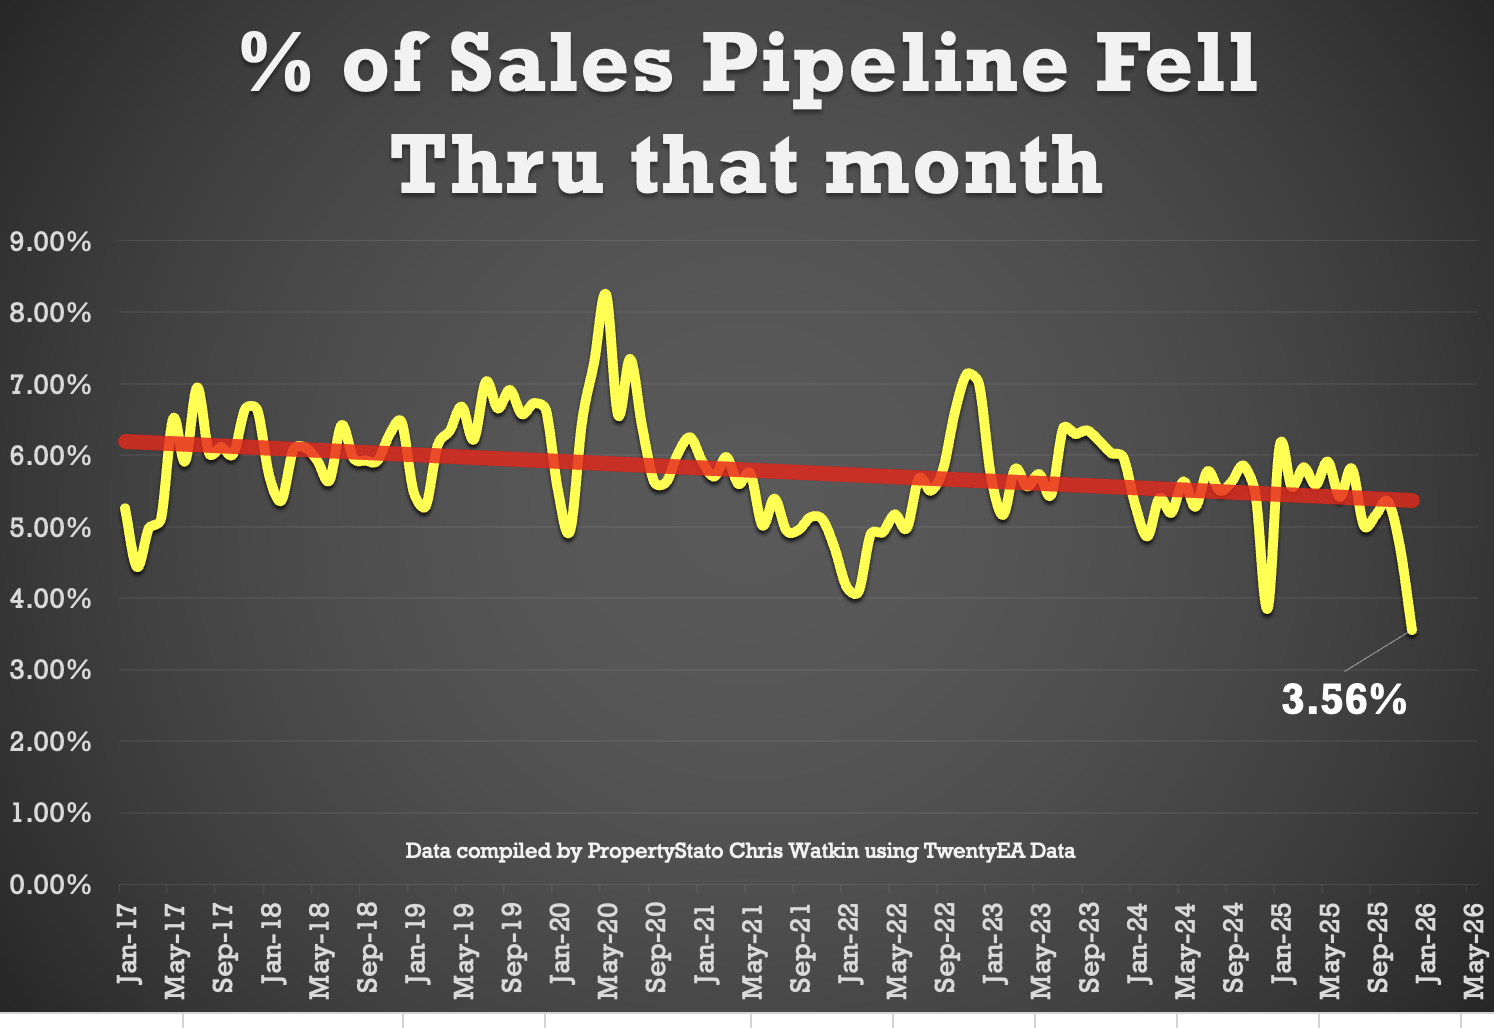
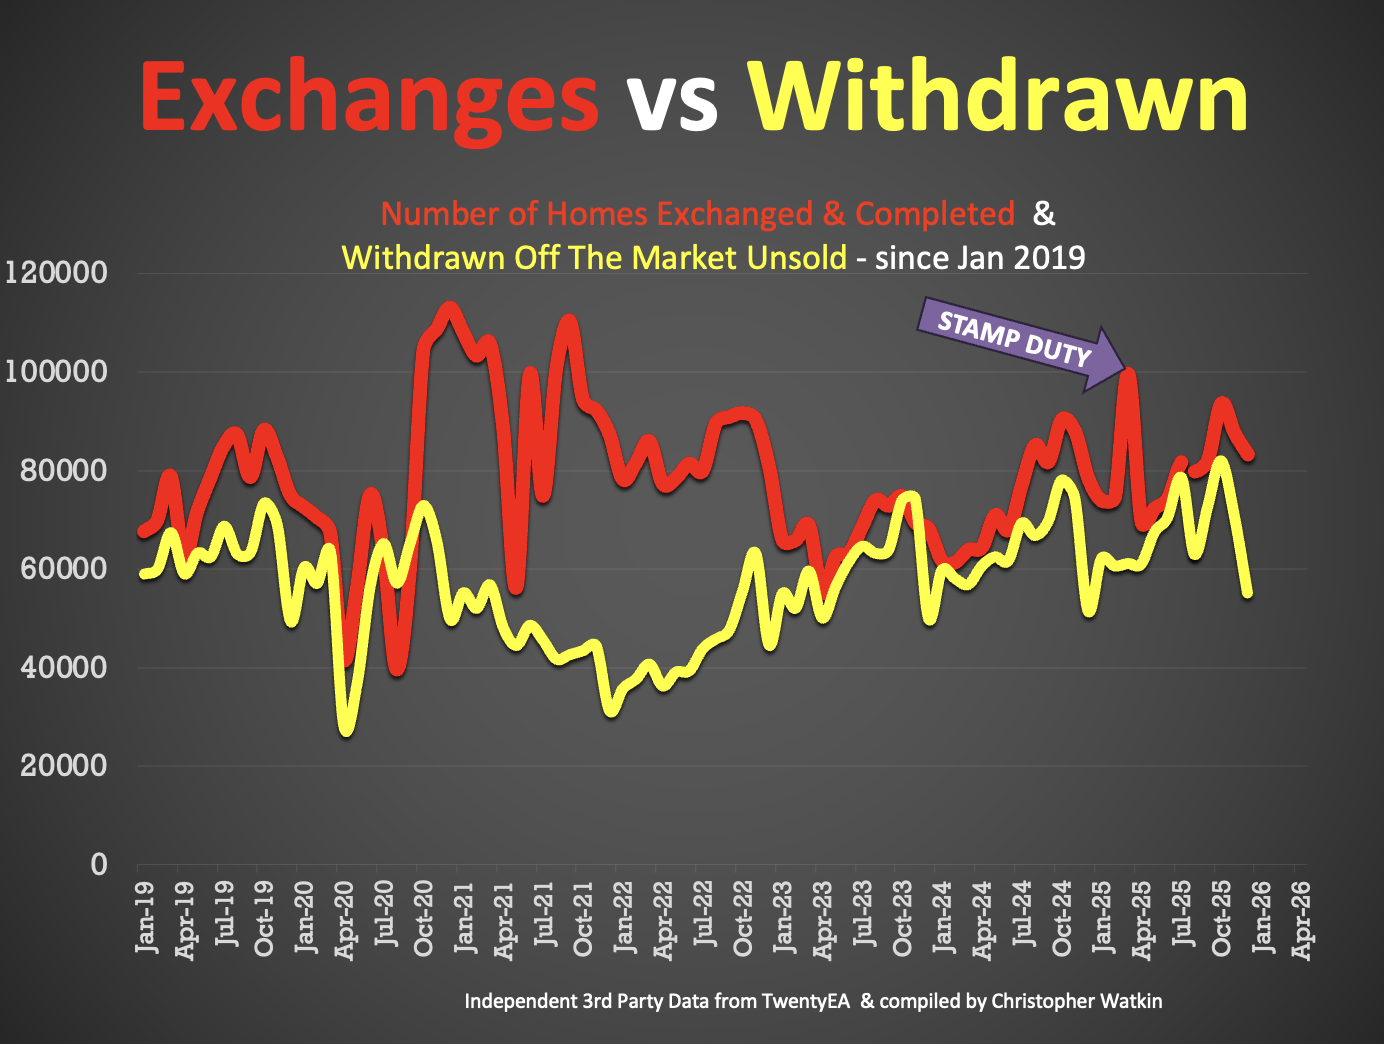
✅ Fall-Throughs
+ 4,783 fall-throughs last week (pipeline of 482k home Sold STC).
+ Weekly average for 2025: 6,100.
+ Fall-through rate: 25.8%, slightly up from 24.9% last week.
+ Long-term average: 24.2% (post-Truss chaos saw levels exceed 40%).
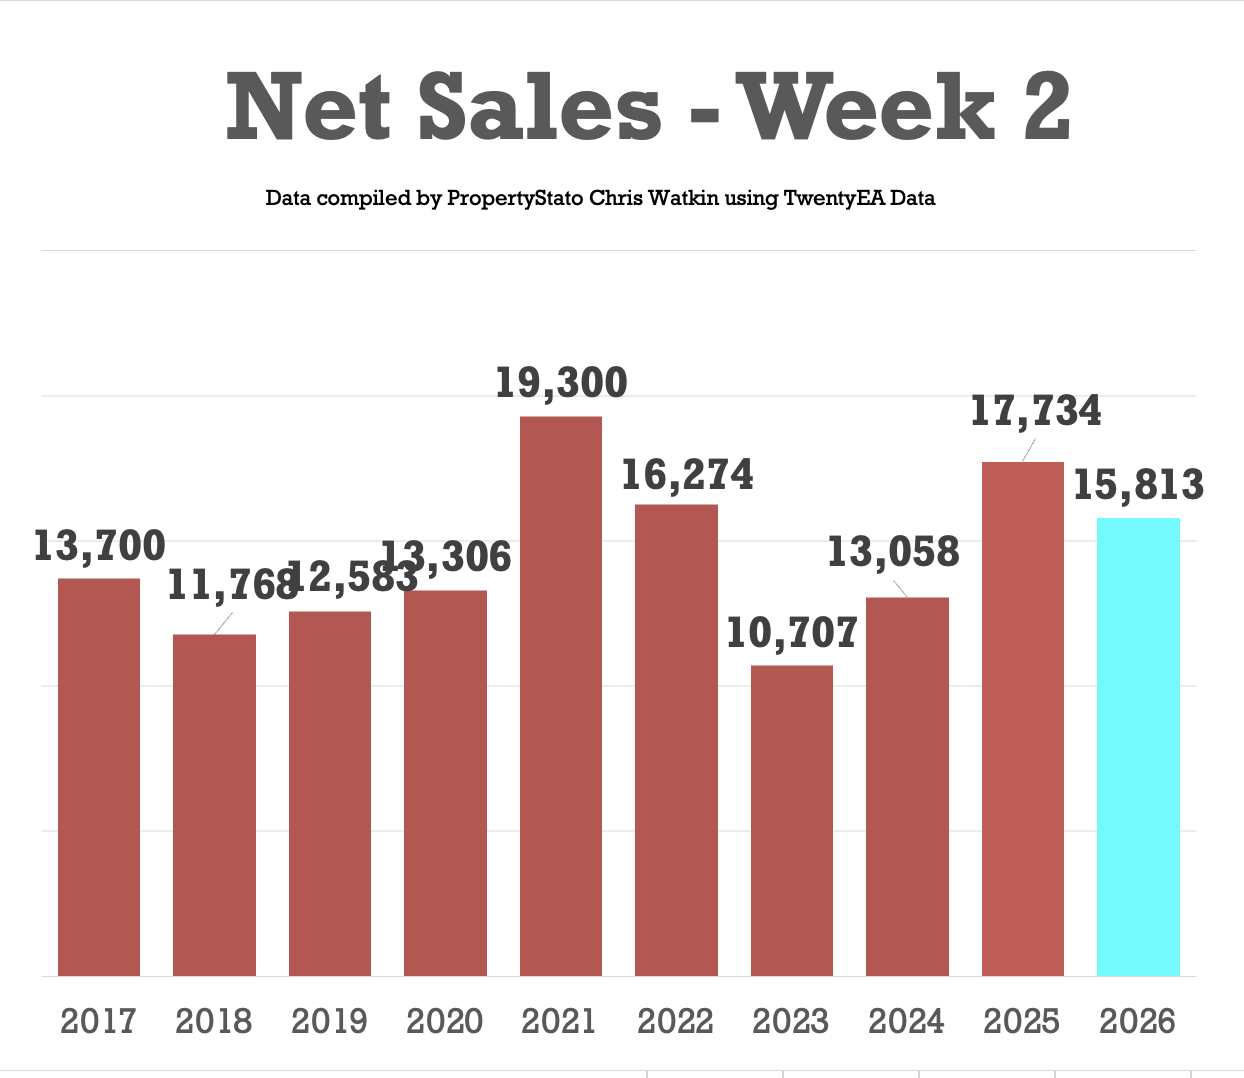
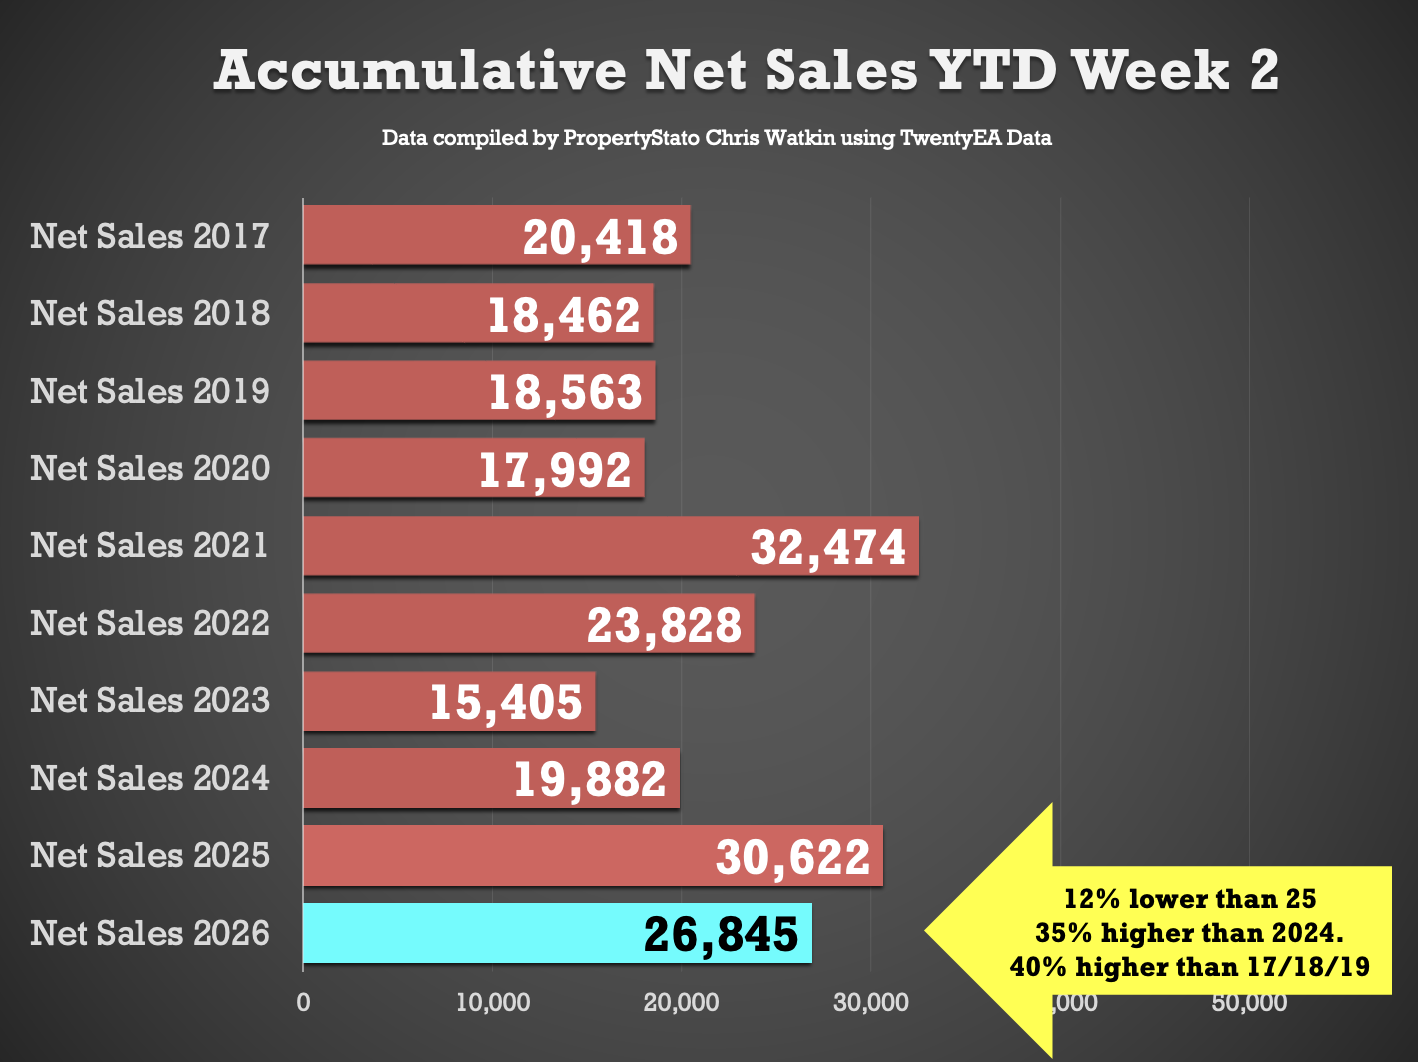
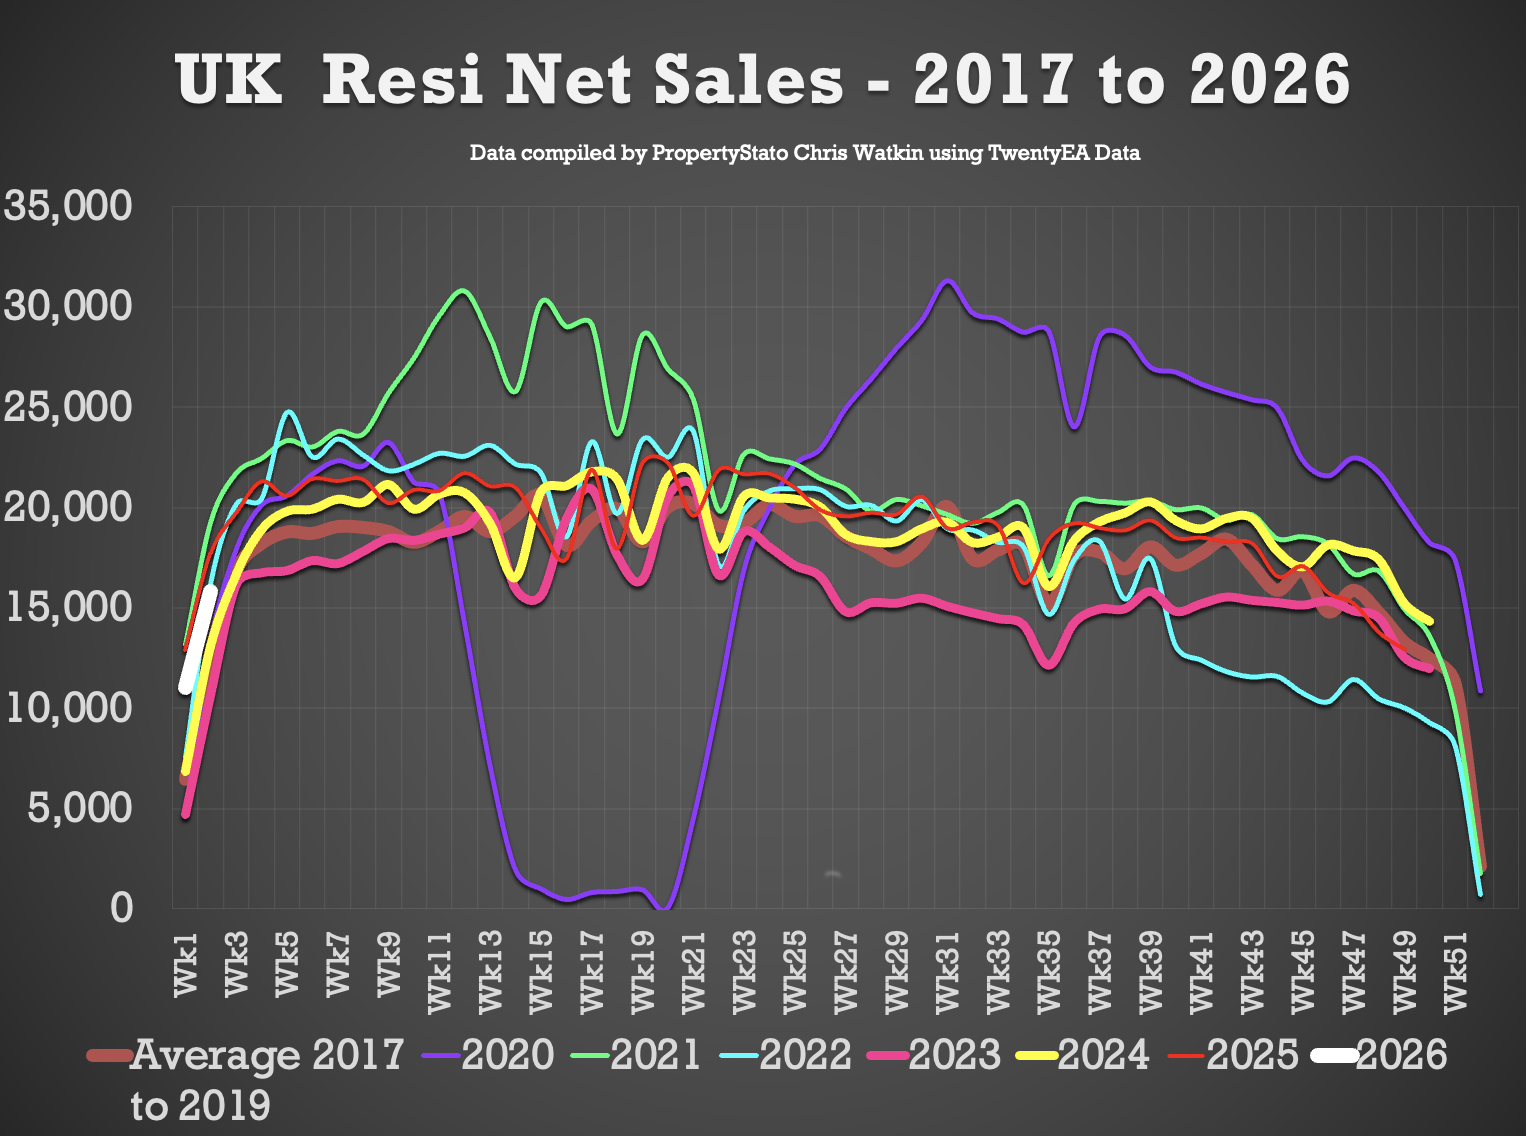
✅ Net Sales
+ 15.8k net sales this week, up expectedly from 11k last week.
+ Ten-year Week 2 average: 14.4k.
+ Weekly average for 2026: 13.4k. Weekly average for 2025: 19.2k.
+ YTD: 26.8k, which is 12.3% behind Wk.2 of 2024 (30.6k), 35% ahead of wk2 2024 (19.9k) and 40% ahead of wk2 2017–19 (19.1k).
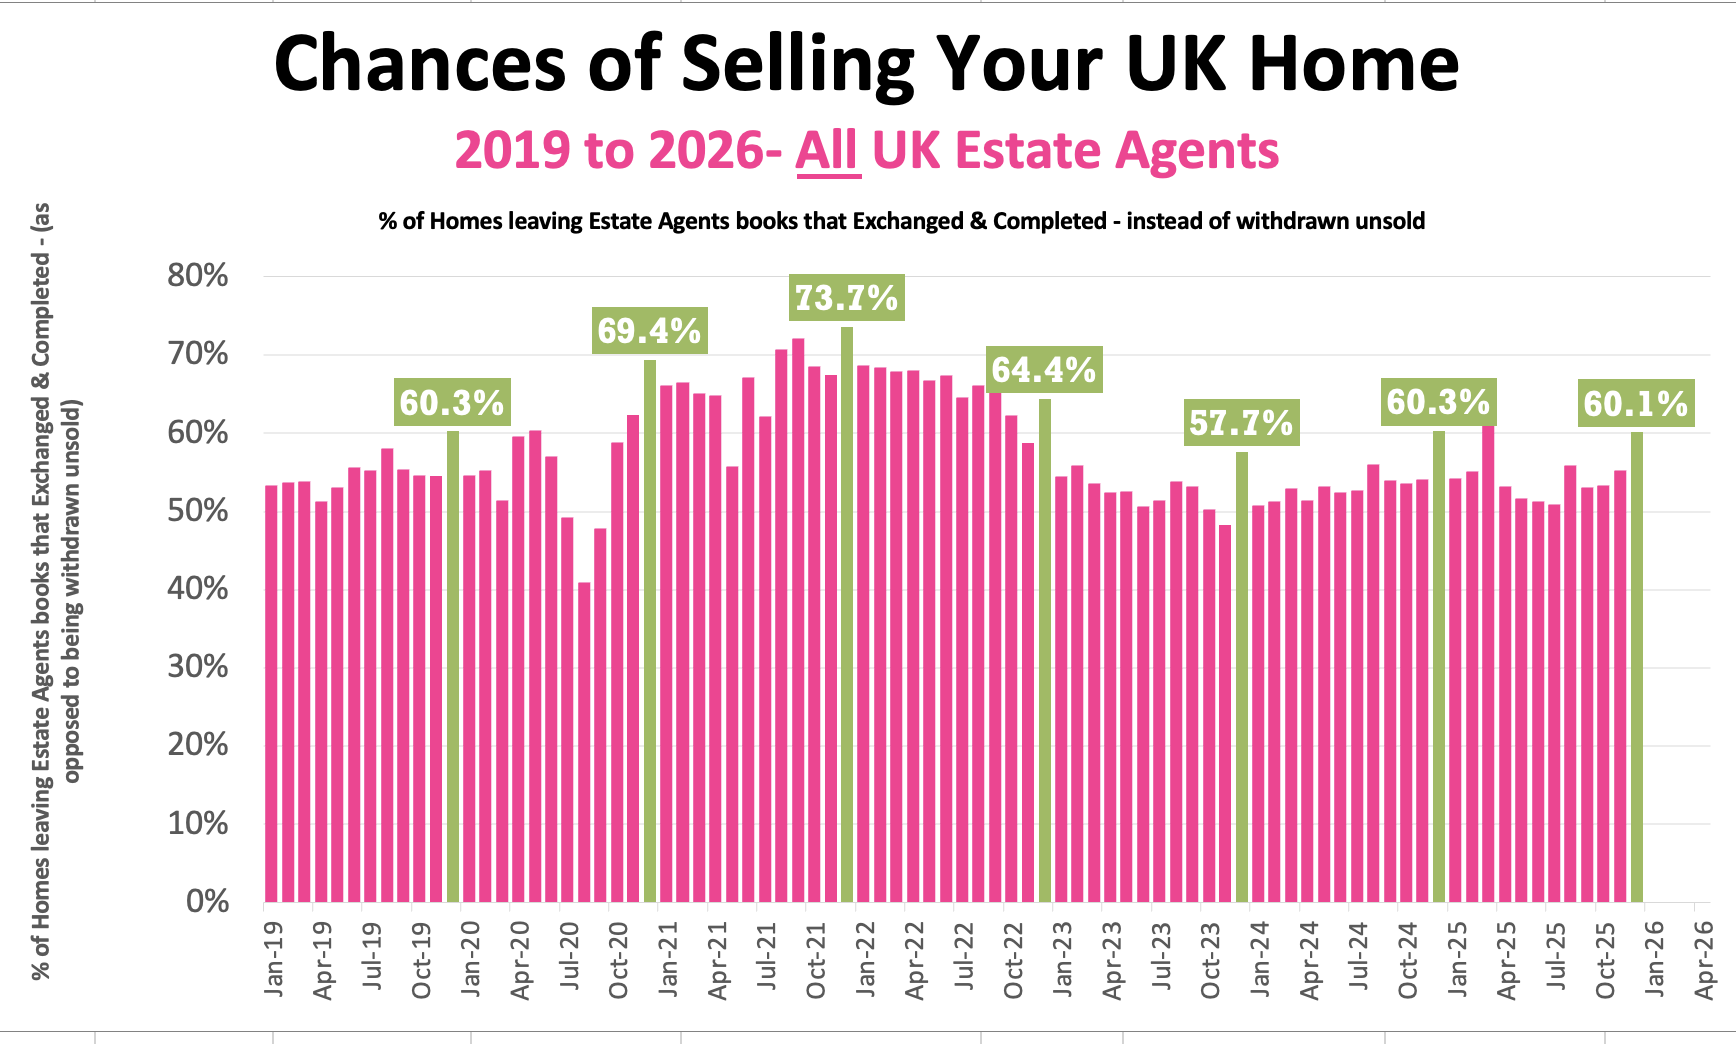
✅ Probability of Selling (% that Exchange vs withdrawal)
+ December Stats : 60.1%% of homes that left agents’ books exchanged & completed in December. (Note this figure will change throughout the month as more December stats come in).
+ November 55.2% / October 53.3% / September: 53.1% / August :55.8% / July: 50.9% / June: 51.3% / May: 51.7% / April: 53.2%.
+ Dec 24: 60.3% / Dec 23: 57.7% / Dec 22: 64.4% / Dec 21: 73.7%.
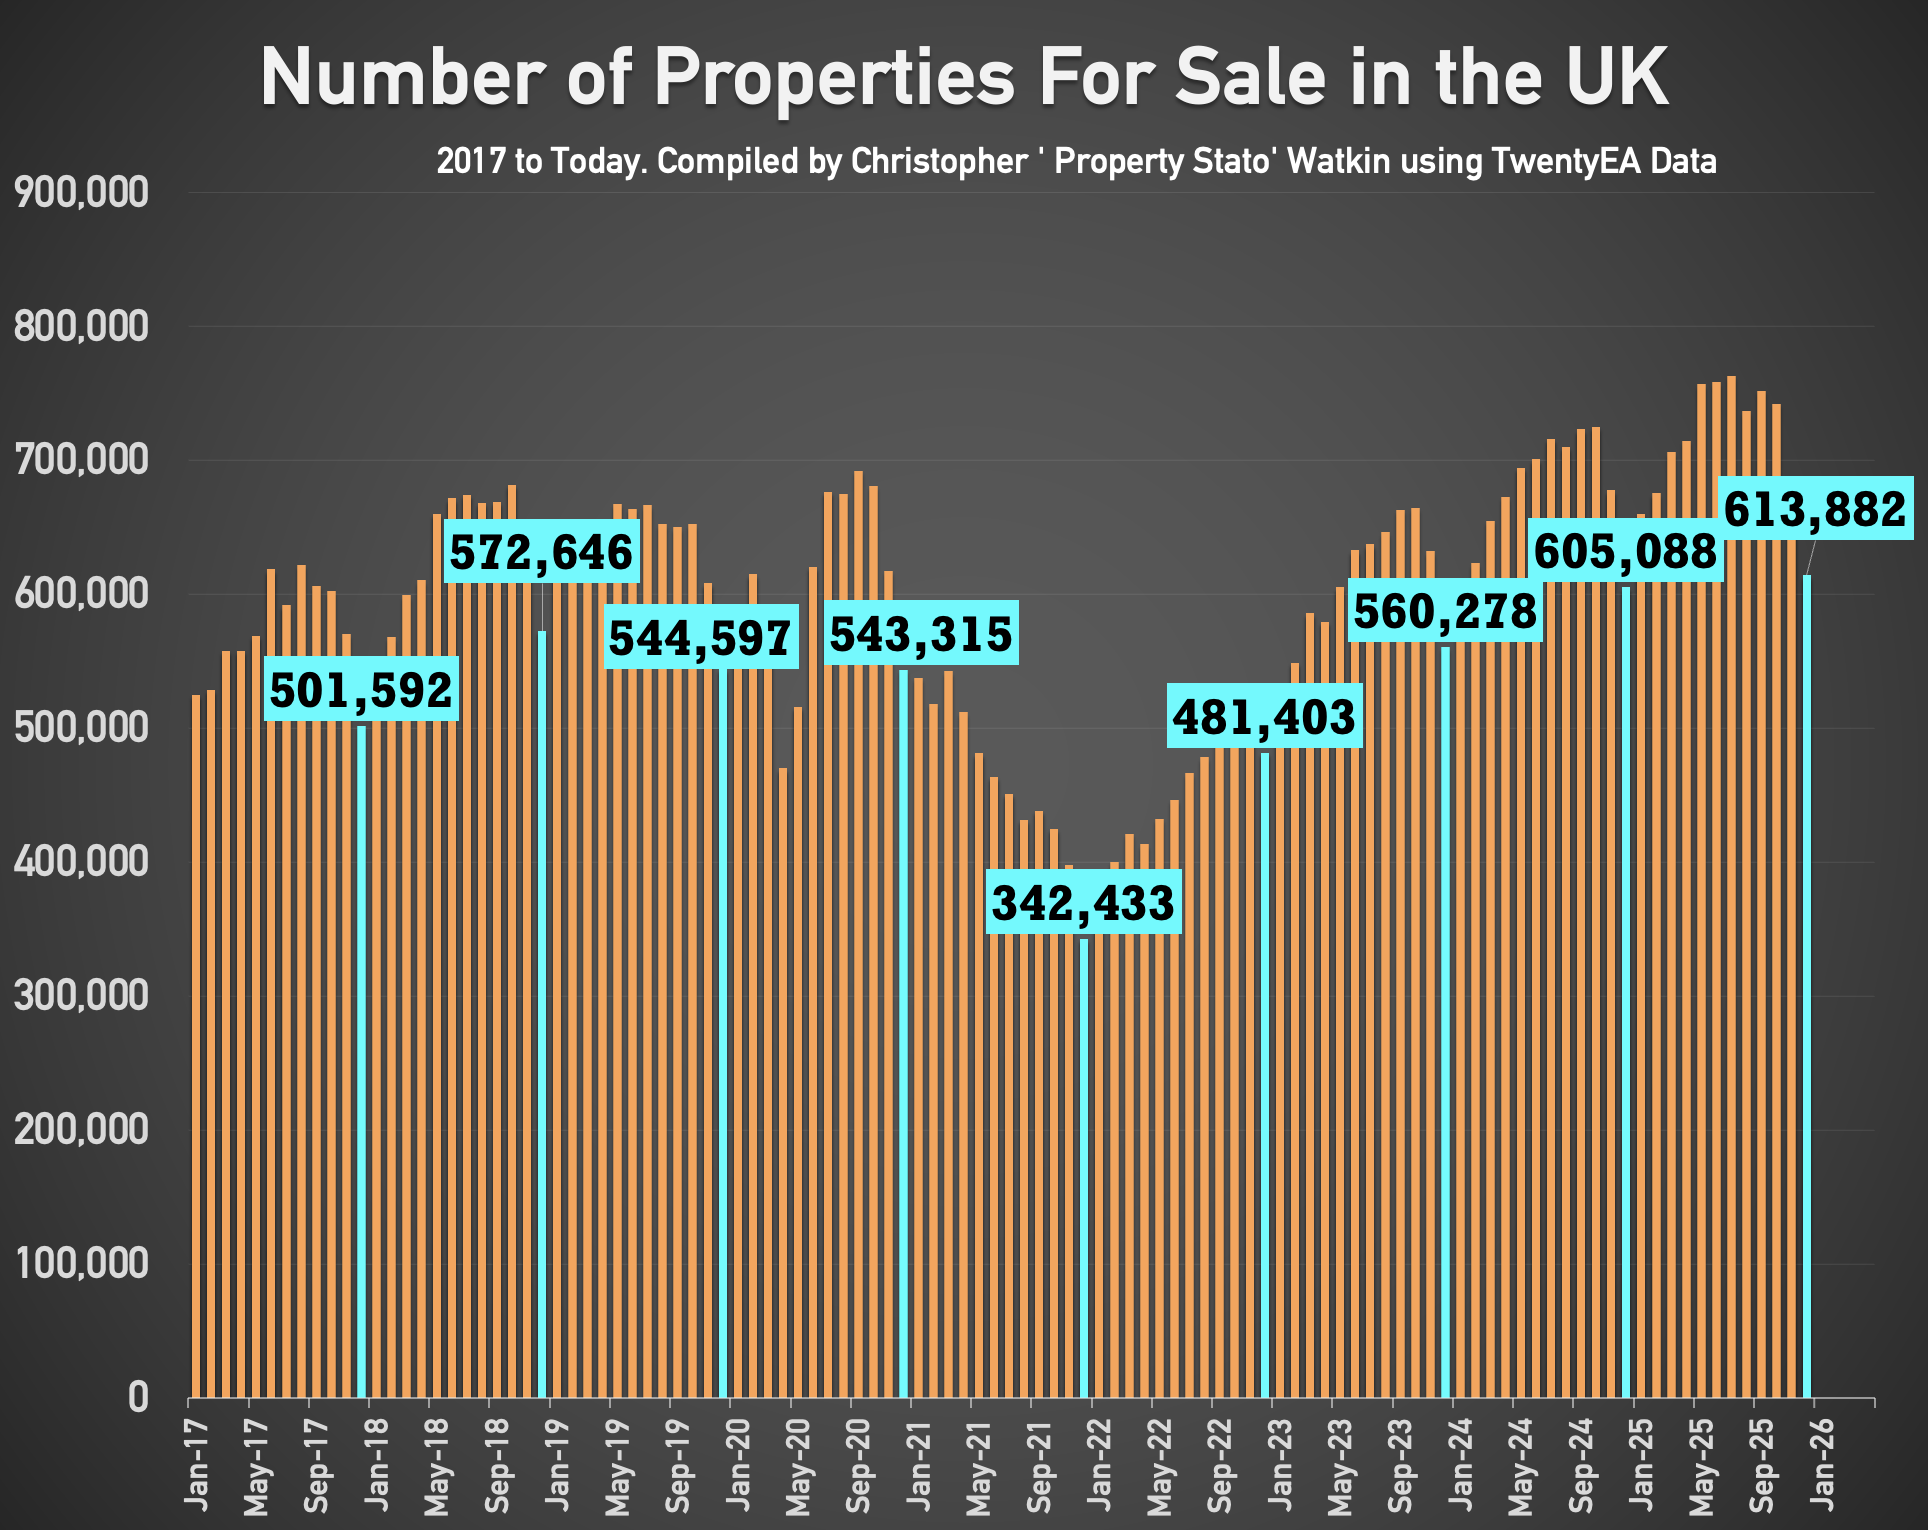
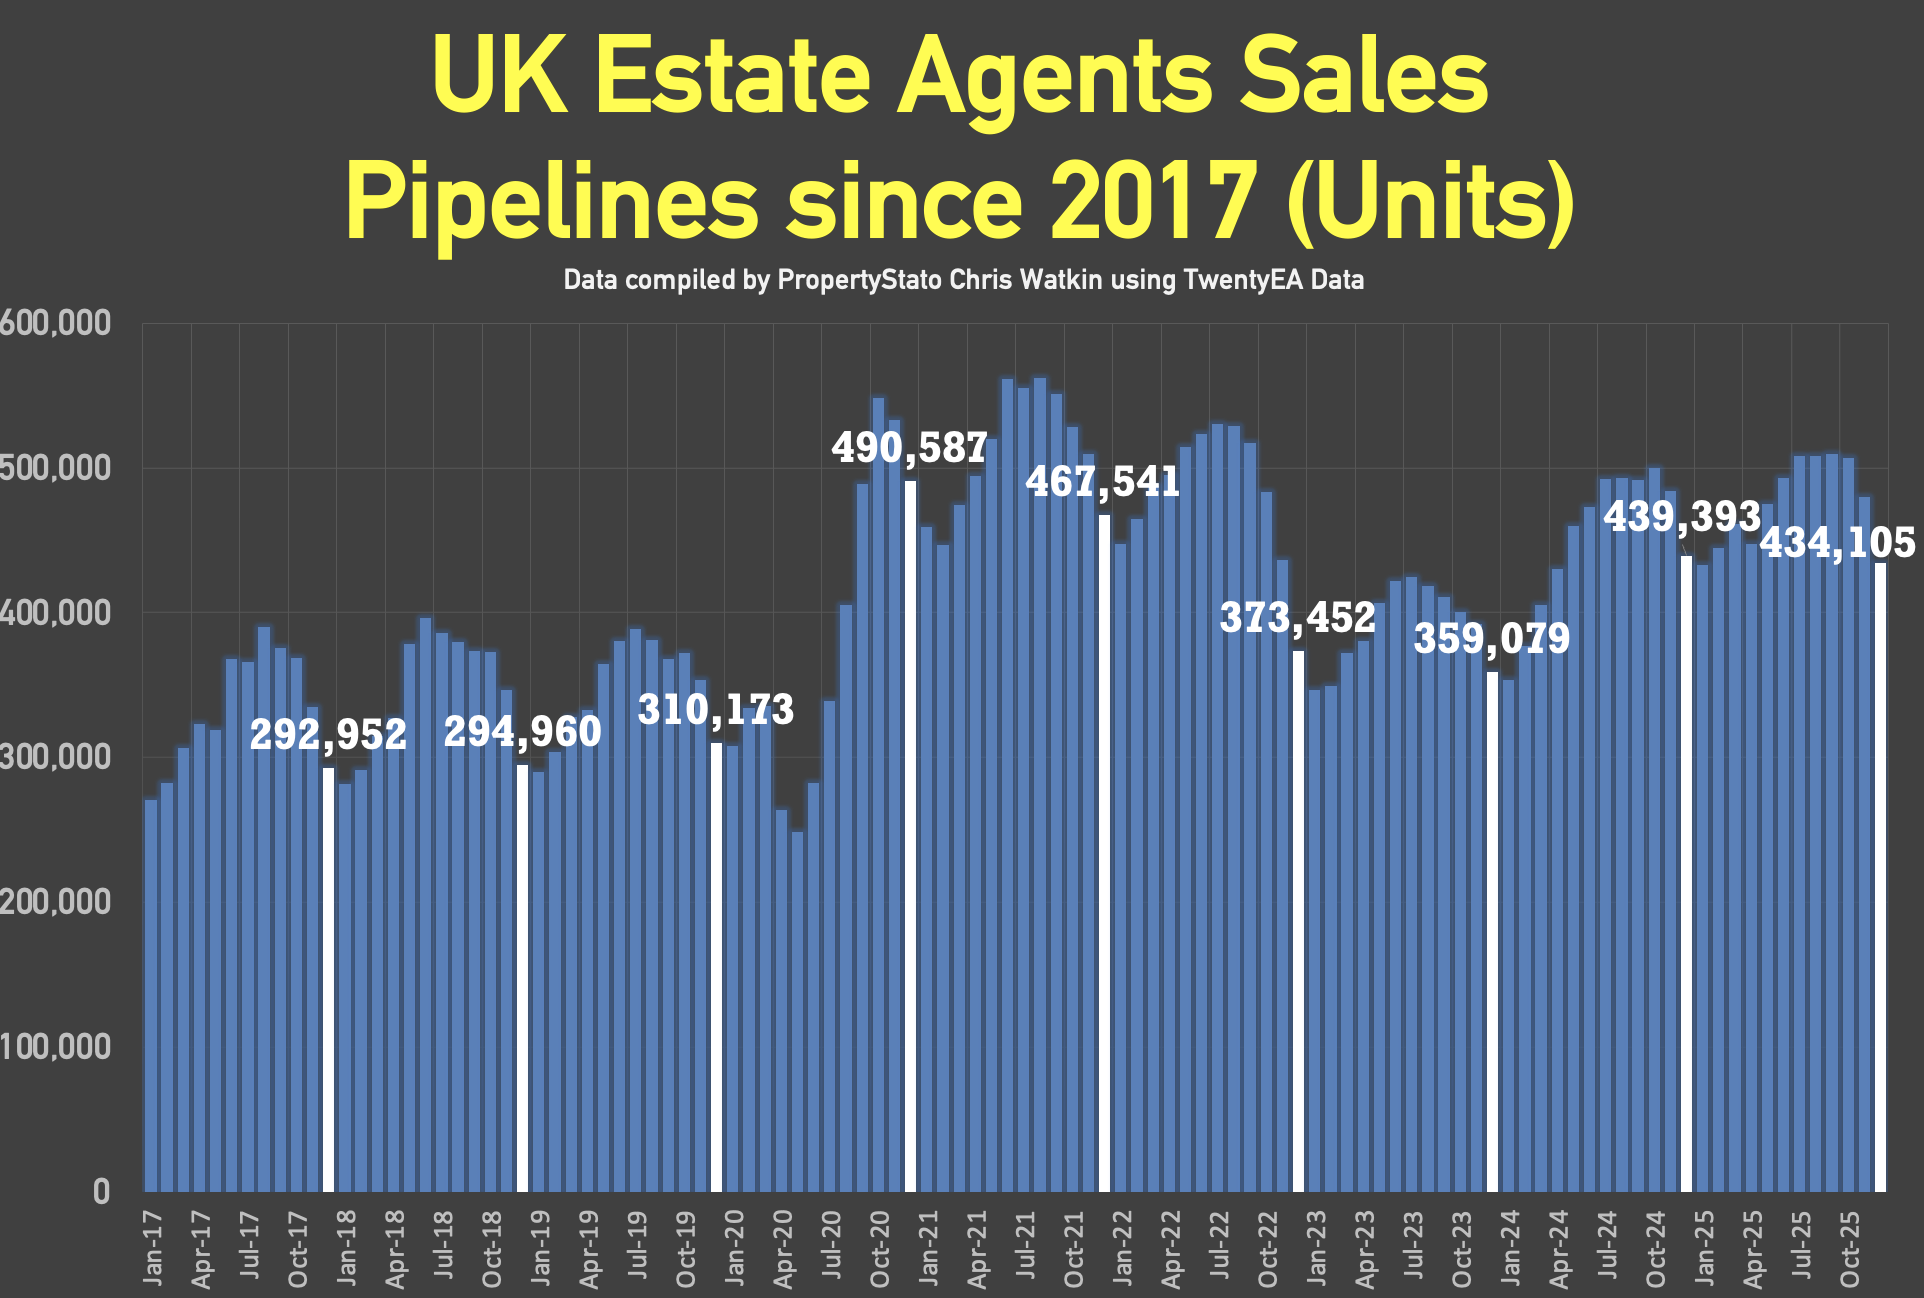
✅ Stock Levels
+ 613k homes on the market on the 1st of January ’26 , down from 678k on 1st of December ’25 . (605k on the market on 1st Jan ’25 for comparison)
+ 434k homes in agent’s sales pipeline on the 1st Jan 2026, almost identical than 12 months ago on 1st Jan ’25 (439k).
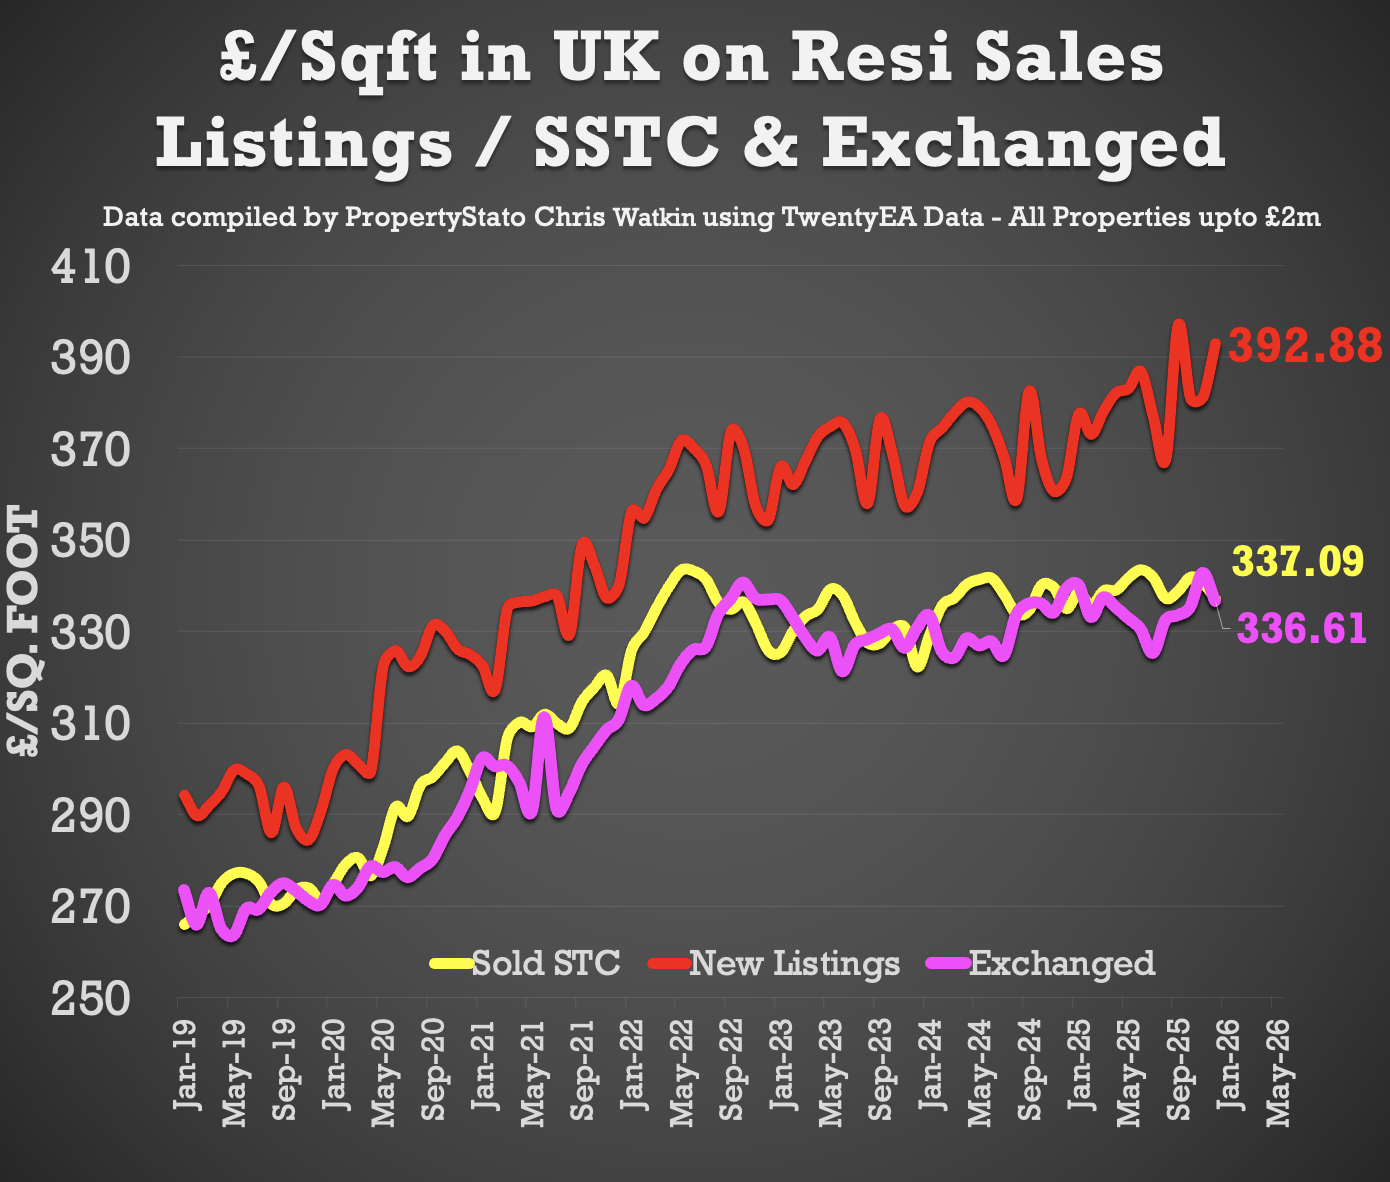
✅ House Prices (£/sq.ft)
+ December 2025 agreed sales averaged £337.09 per sq.ft. 0.6% higher than 12 months ago (£335.04) and 12.6% than 5 years ago (£299.30). The £/sqft at sale agreed matches the HM Land Registry Index with a 98% accuracy, 5 months in advance. That is why it is so important.
✅ UK Rental Market Overview
+ Average Rent in December 2025 – £1,702 pcm – compared to £1,719 pcm in Dec 2024 and £1,301 pcm in Dec 2017.
+ Available Rental Properties in December ’25 – 285k compared to 321k in November ’25. (Dec ’24 – 258k and Dec ’23 – 235k)
Local Focus this week
Bristol

Listings are firing early
32,800 new homes came to market last week. That is well ahead of the ten year Week 2 average and ahead of where we were at this point in 2024 and the pre Covid years. Year to date listings are already 25.6% higher than 2024 and nearly 50% above the 2017 to 2019 norm. Plenty of choice for buyers. Plenty of opportunity for agents who know how to price properly.
You must be logged in to like or dislike this comments.
Click to login
Don't have an account? Click here to register
Sales are not hanging about
21,200 homes went SSTC last week, a clear step up from the first week of the year and above the long term Week 2 average. Yes, we are behind January 2025, but that month was turbo charged by the stamp duty deadline. Strip that out and 2026 is flying. Year to date sales are 31% ahead of 2024 and over 42% above pre Covid levels. Demand is real.
You must be logged in to like or dislike this comments.
Click to login
Don't have an account? Click here to register
But price reality still matters…
The gap between asking prices and achieved prices is 22.2%. That is materially wider than the long term norm. This tells us one thing. Agents are putting on posh houses, yet the more inexpensive ones are selling
Price reductions remain elevated. Nearly one in eight homes were reduced last year, well above the long term average. The market is talking. The question is whether sellers are listening.
You must be logged in to like or dislike this comments.
Click to login
Don't have an account? Click here to register
Bottom line for agents
This is a good start to 2026. Listings are strong. Sales are happening. The opportunity is there.
But this is not a market for hope pricing, long tie ins, or lazy pipeline management. The agents who win this year will be the ones who price with intent, manage momentum hard in the first 21 days, and protect deals all the way to exchange.
Busy does not always mean profitable. Execution still matters.
You must be logged in to like or dislike this comments.
Click to login
Don't have an account? Click here to register
A positive start to the year – despite worldwide distractions and meteorological challenges – love it!
You must be logged in to like or dislike this comments.
Click to login
Don't have an account? Click here to register