

 New analysis by Hamptons of Land Registry data shows that in 2025, 14.8% of London homeowners sold their properties for less than they originally paid, overtaking the North East, which had topped the ranking in 2024.
The North East had held the highest proportion of “loss-making” sellers in nine of the past ten years. As recently as 2019, 29.9% of North East sellers sold at a loss, compared with 9.2% in London, reflecting the region’s slower recovery from the 2008 financial crash.
Chart 1 – Share of properties sold for less than their purchase price
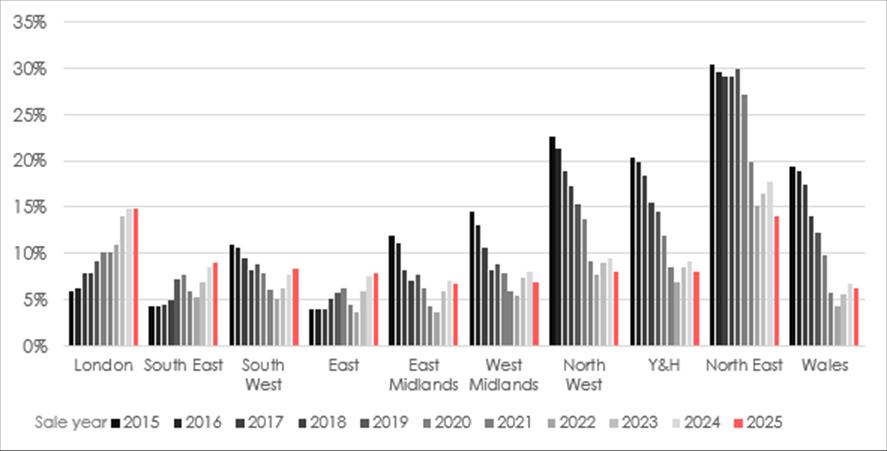
Source: Hamptons & Land Registry
Hamptons’ analysis of Land Registry data, which compares the price homeowners paid for their property with the price at which they sold it, shows that in 2025, 14.8% of London sellers sold for less than their purchase price, surpassing the North East, which had held the highest proportion of loss-making sales in 2024.
The North East had dominated this ranking for nine of the past ten years. As recently as 2019, 29.9% of sellers in the North East sold at a loss, compared with 9.2% in London, reflecting the region’s slower recovery from the 2008 financial crash.
Table 1 – Share of sellers getting back less than they paid for their property
| 2019 | 2025 | |
| London | 9.2% | 14.8% |
| North East | 29.9% | 13.9% |
| South East | 7.3% | 9.0% |
| South West | 8.8% | 8.3% |
| North West | 15.4% | 8.1% |
| Yorkshire & Humber | 14.5% | 8.0% |
| East of England | 5.7% | 7.9% |
| West Midlands | 8.9% | 6.9% |
| East Midlands | 7.6% | 6.7% |
| Wales | 12.2% | 6.2% |
| England & Wales | 10.0% | 8.7% |
Source: Hamptons & Land Registry
The picture has changed significantly over the past decade. The proportion of loss-making sales in the North East has more than halved, falling from 29.9% in 2019 to 17.7% in 2024 and 13.9% in 2025. In contrast, the share of London sellers selling at a loss has been rising, highlighting a reversal in the relative performance of the North and South.
This shift has been driven largely by flat sales: although flats accounted for 60% of London transactions last year, they made up 90% of properties sold at a loss, up from 78.4% in 2019.
Chart 2 – Share of London properties sold for less than their purchase price
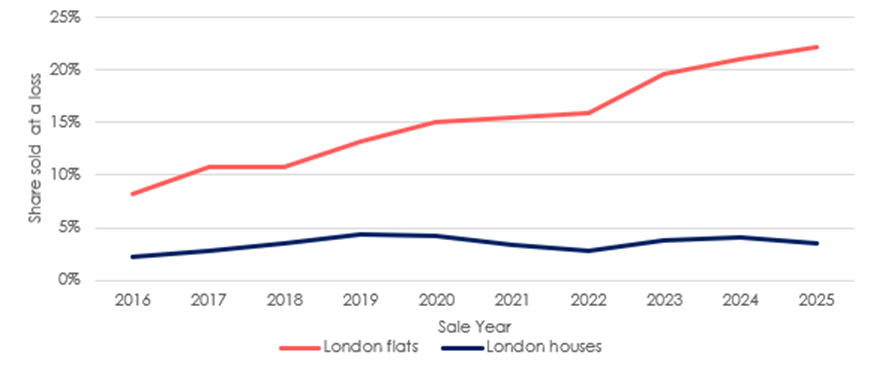
Source: Hamptons & Land Registry
At local authority level, eight of the 10 local authorities where sellers were most likely to make a loss were in the capital. Last year, 28.2% of sellers in Tower Hamlets sold for less than they paid, the highest figure in both the capital (map 1) and the country, with flats making up 90%+ of all sales in the area.
The City of London (26.2%), Kensington & Chelsea (22.4%), Westminster (22.1%) and Hammersmith & Fulham
(20.8%) complete the top five local authorities where more than a fifth of sellers sold at a loss in 2025. Meanwhile, in Barking & Dagenham – London’s cheapest borough – just 5.3% of sellers sold below purchase price (map 1).
While the average London seller in 2025 still achieved a price of £172,510 (44.6%) above what they originally paid, most of this uplift stems from historic house price growth (table 2). Although half of London sellers last year had owned their home for more than a decade, in cash terms, these long-term owners accounted for 77% of the total gains made in the capital.
House owners in the capital generally recorded higher gains than flat owners – 59.6% over an average of 10.3 years, compared with 35.4% for flats over a similar 10.1 year period. London house sellers were more than six times less likely than flat sellers to make a loss (3.5% vs 22.2%, chart 2). This widening gap has made it increasingly difficult for flat owners to bridge the step up to a house.
Elsewhere, sellers in the South of England (South East, South West and East of England) were also among the most likely to sell for less than they paid. While sellers in three of the four Southern regions achieved smaller average gains than in 2024, vendors in all three Northern regions saw increases (table 2).
Table 2 – Average difference between purchase and sale price for sellers across England and Wales
| 2024 Sellers | 2025 Sellers | YoY Change | |
| London | £172,350 | £172,510 | £160 |
| South East | £116,560 | £108,030 | -£8,530 |
| South West | £96,090 | £91,890 | -£4,200 |
| East | £100,270 | £97,130 | -£3,140 |
| East Midlands | £71,530 | £70,730 | -£800 |
| West Midlands | £72,980 | £76,220 | £3,240 |
| North East | £38,220 | £41,140 | £2,920 |
| North West | £64,830 | £70,520 | £5,690 |
| Yorkshire & Humber | £60,380 | £62,180 | £1,800 |
| Wales | £66,710 | £68,120 | £1,410 |
| England & Wales | £91,830 | £91,260 | -£570 |
Source: Hamptons & Land Registry
The sustained level of house price growth across the North of England over the last decade means that sellers there have seen proportionally higher gains than those in the South. In 2025, the average seller in the North West achieved a 45.4% increase in the value of their home during their period of ownership – higher than London (44.6%), the South East (38.3%), South West (39.5%) and East of England (39.5%). Outside London, no Southern region recorded average gains above 40%.
Sellers in the Midlands and Northern England are now among the least likely to make a loss when they sell. Of the 20 local authorities where sellers were least likely to sell below their purchase price, only two were in the South of England (London, South East, South West or East). At the very top of the list was Harlow in the East of England, where just 0.8% of sellers sold at a loss in 2025. This was followed by High Peak in Derbyshire (1.7%) and Broxtowe in Nottinghamshire (2.3%), both in the East Midlands.
Table 3 – Average seller gain in England & Wales
| Average seller gain (£) | Average seller gain (%) | Average length of ownership | Share of sellers who made a gain | |
| 2015 | £82,730 | 59% | 8.8 | 86% |
| 2016 | £87,560 | 60% | 8.8 | 89% |
| 2017 | £88,230 | 58% | 8.8 | 90% |
| 2018 | £88,030 | 54% | 8.9 | 90% |
| 2019 | £80,970 | 49% | 8.9 | 89% |
| 2020 | £84,880 | 45% | 8.8 | 90% |
| 2021 | £96,220 | 47% | 8.9 | 92% |
| 2022 | £112,930 | 54% | 9.0 | 94% |
| 2023 | £102,650 | 48% | 8.9 | 93% |
| 2024 | £91,830 | 42% | 8.9 | 91% |
| 2025 | £91,260 | 41% | 9.0 | 91% |
Source: Hamptons & Land Registry
Nationally, the picture in 2025 was similar to 2024. Last year, the average homeowner in England & Wales sold for £91,260 (or 41%) more than they paid an average of 9.0 years ago. This figure was £570 less than the £91,830 average gain recorded in 2024 (table 3).
Across England & Wales, 8.7% of sellers in 2025 got back less for their property than they originally paid (table 1), down slightly from 8.8% in 2024. However, this figure masks a sizable divide between property types: 19.9% of 2025 flat sellers sold at a loss, compared with just 4.5% of house owners, down from 5.7% in 2024.
Aneisha Beveridge, head of research at Hamptons, said: “In London, upward house price growth is no longer the one-way bet it once seemed. In some cases, even owners who bought a decade ago still face getting back less than they paid – something that would have been almost unthinkable in the heady days of 2015. And for many, the sums are likely to remain tight.
“Over the next few years, more sellers are likely to have missed out on London’s 2012-16 house price boom, having bought instead at what turned out to be the top of the market. That could make trading up increasingly challenging.
“Nationally, rising gains in the North have helped offset shrinking returns in the South, leaving the overall picture broadly unchanged from last year. And with much of the recent price growth in the North and Midlands now baked in, it’s possible that seller gains there could outpace those in the South – in both cash and percentage terms – for the foreseeable future.
“The recent slowdown in house price growth nationally is likely to reduce the uplift homeowners achieve when they come to sell in the coming years. But for many, moving remains a discretionary decision, heavily influenced by the value they can achieve. If the numbers don’t stack up – and sellers risk losing part of their original deposit – many choose to stay put. This means some homeowners, particularly those unable to secure a gain, are likely to remain out of the market.”

Comments are closed.