

 This week’s UK Property Market Stats Show for the week ending Sunday 30th November 2025 (week 47) features Steph Vass from TAUK. Together, we review the key data and trends from the week’s activity in the property market.
✅ Overall Picture
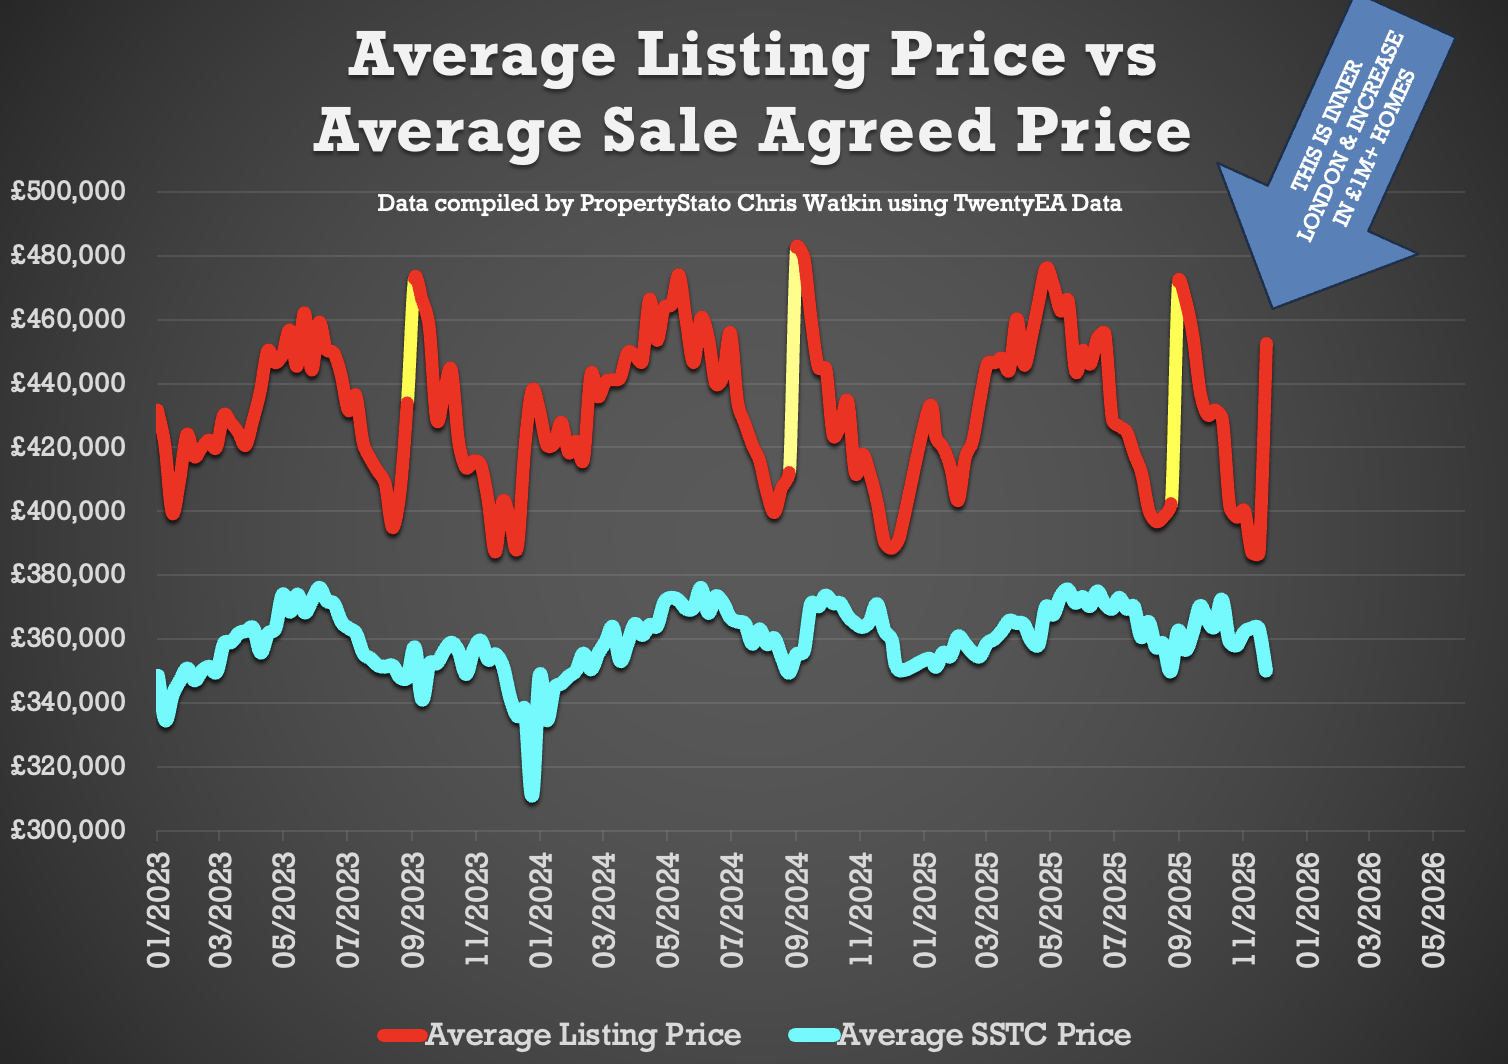
The only notable effect the budget has had is a large increase in £1m+ listings in Inner London, bringing the average listing price this week up by 20%+ on the last month’s average listing price.
Listings – 91% of Week 47 average
Gross Sales – 93% of Week 47 average
Net Sales – 94% of Week 47 average
(Week 47 average is based on the average of the last 9 years)
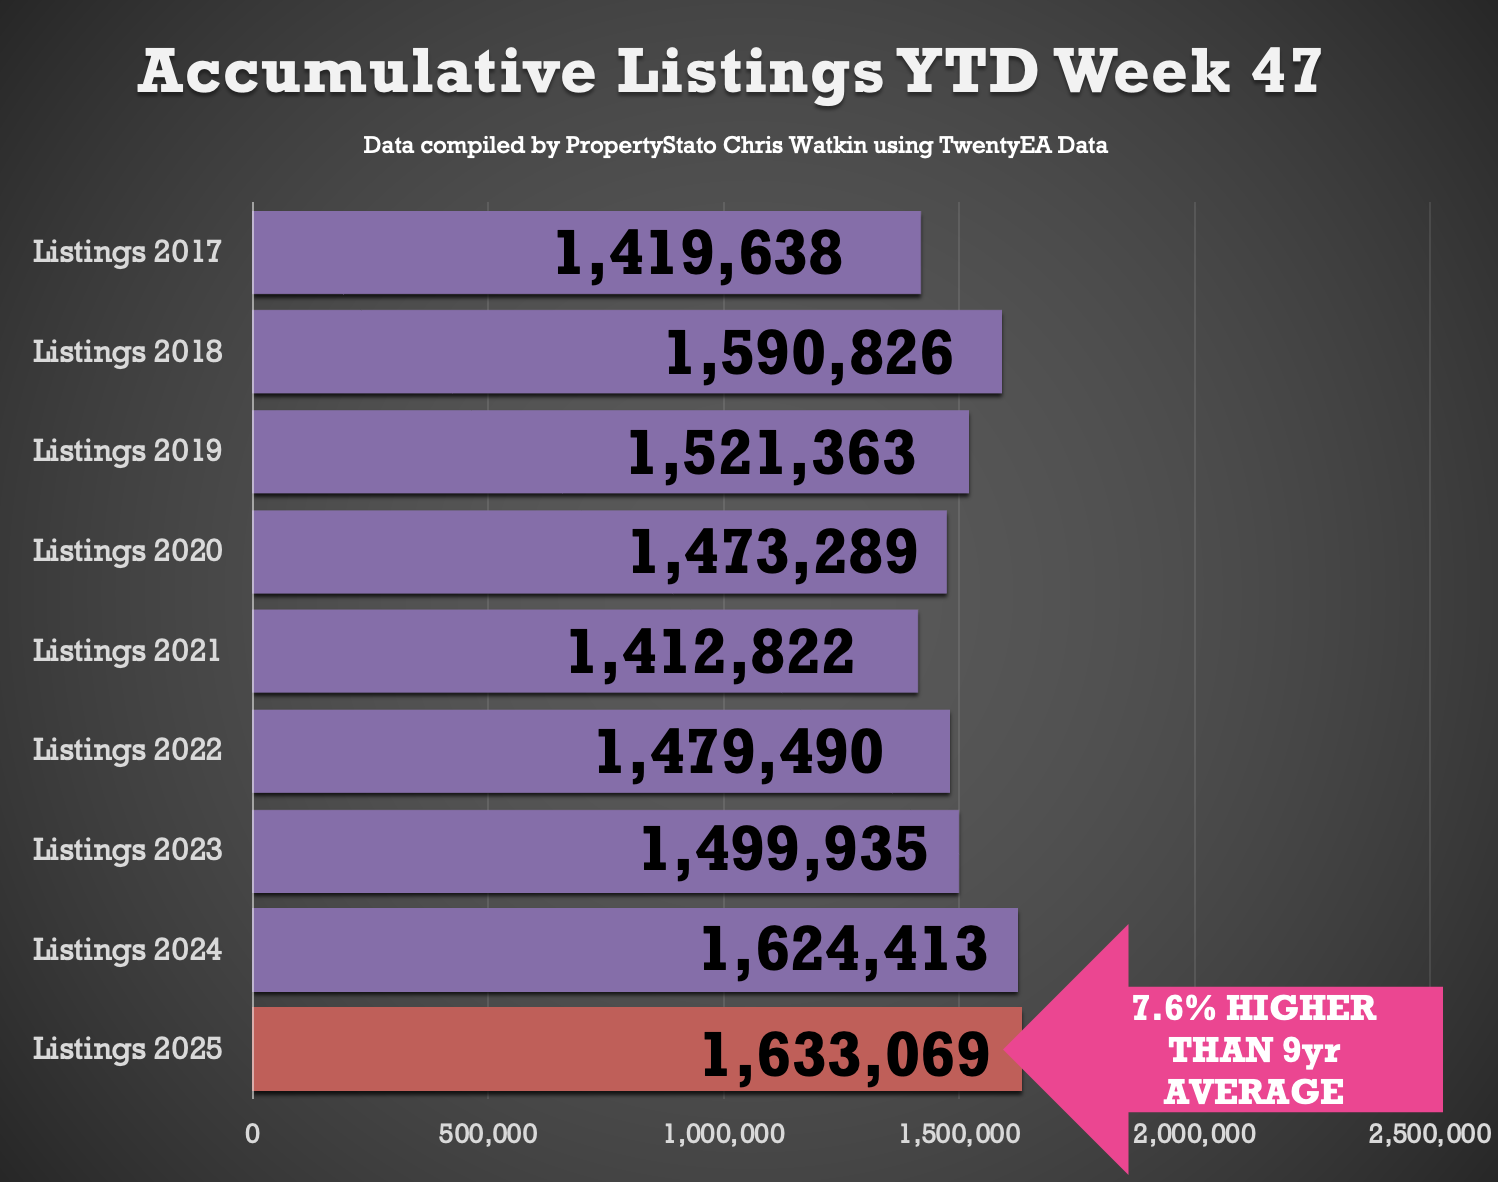
Listings – 1.633m YTD
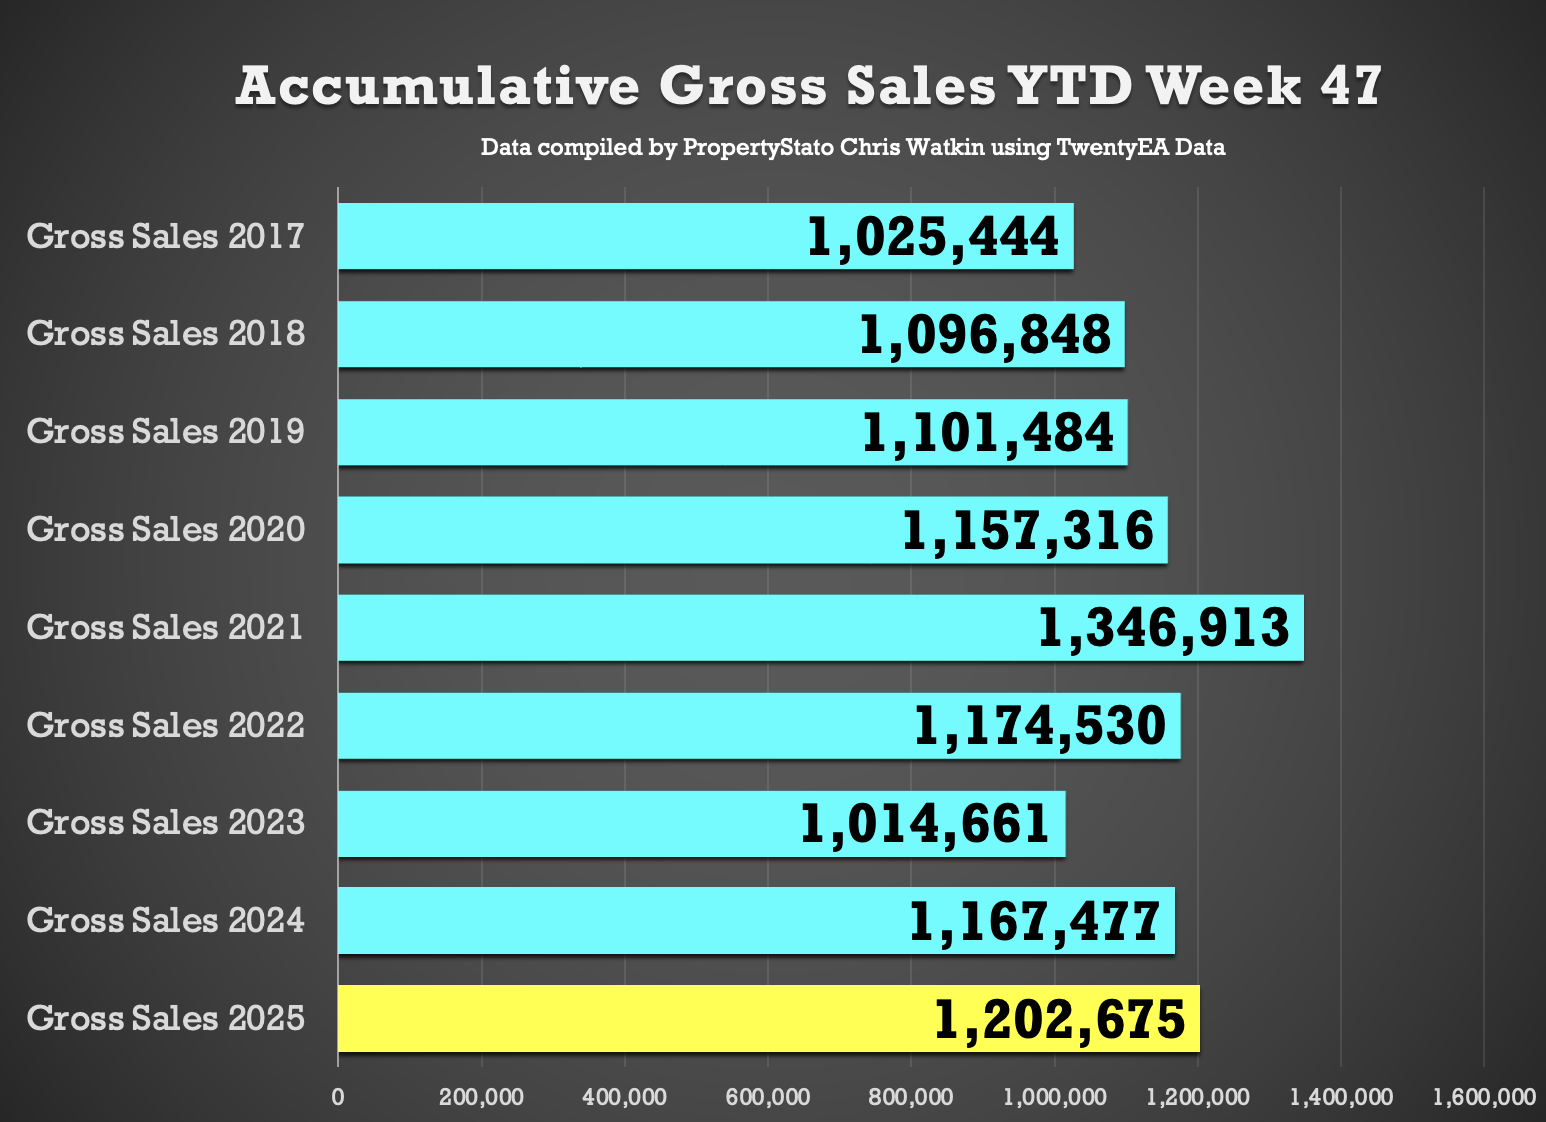
Gross sales – 1.203m YTD
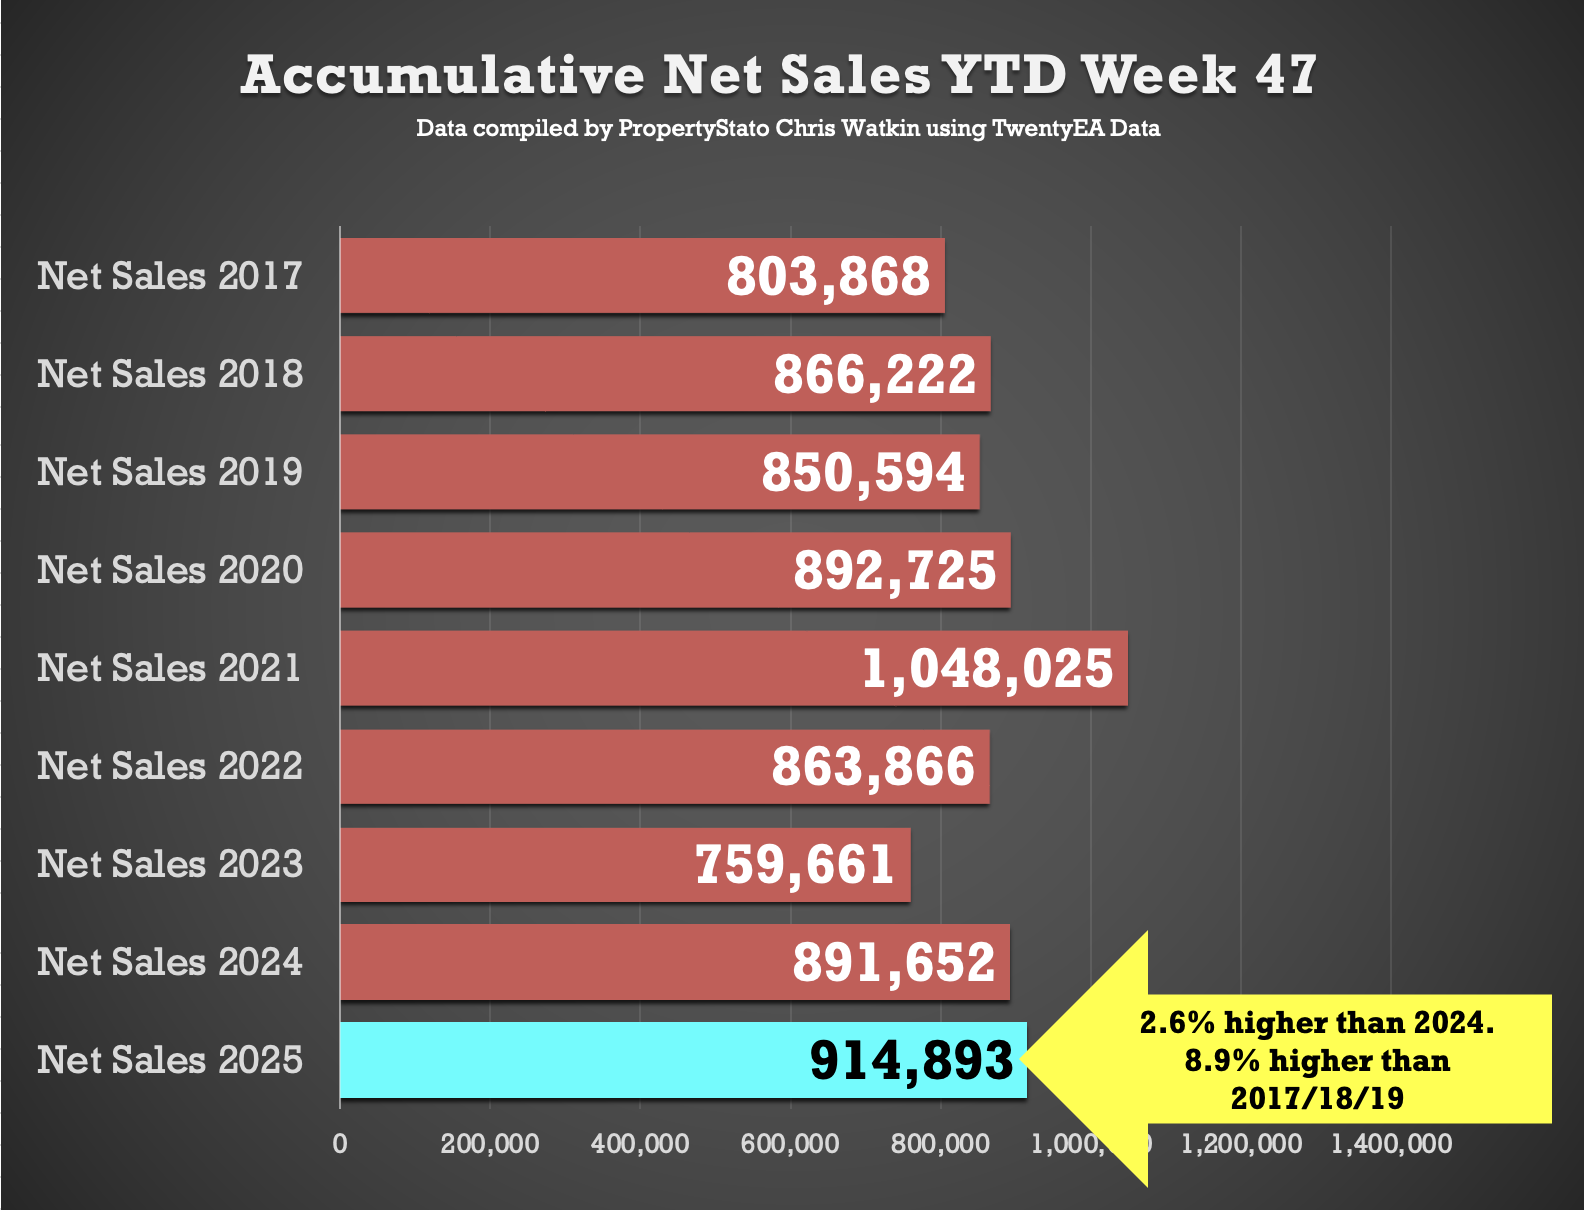
Net sales – 914k YTD
The full breakdown …
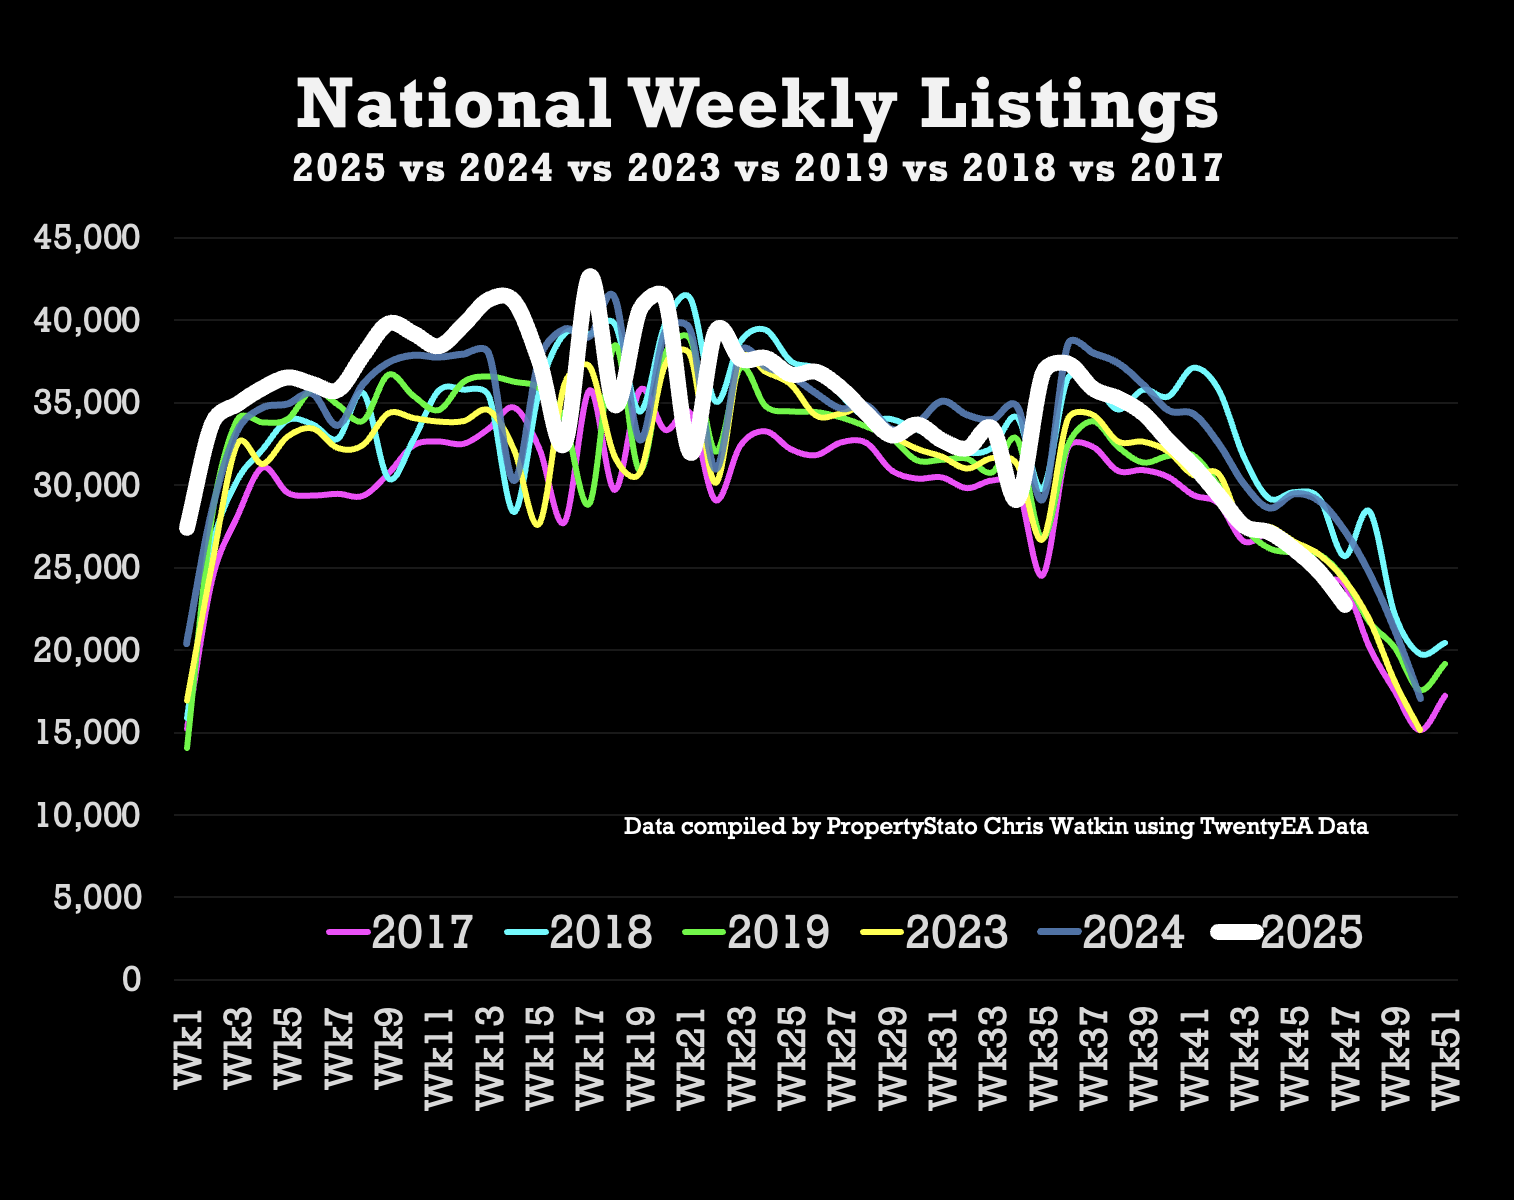
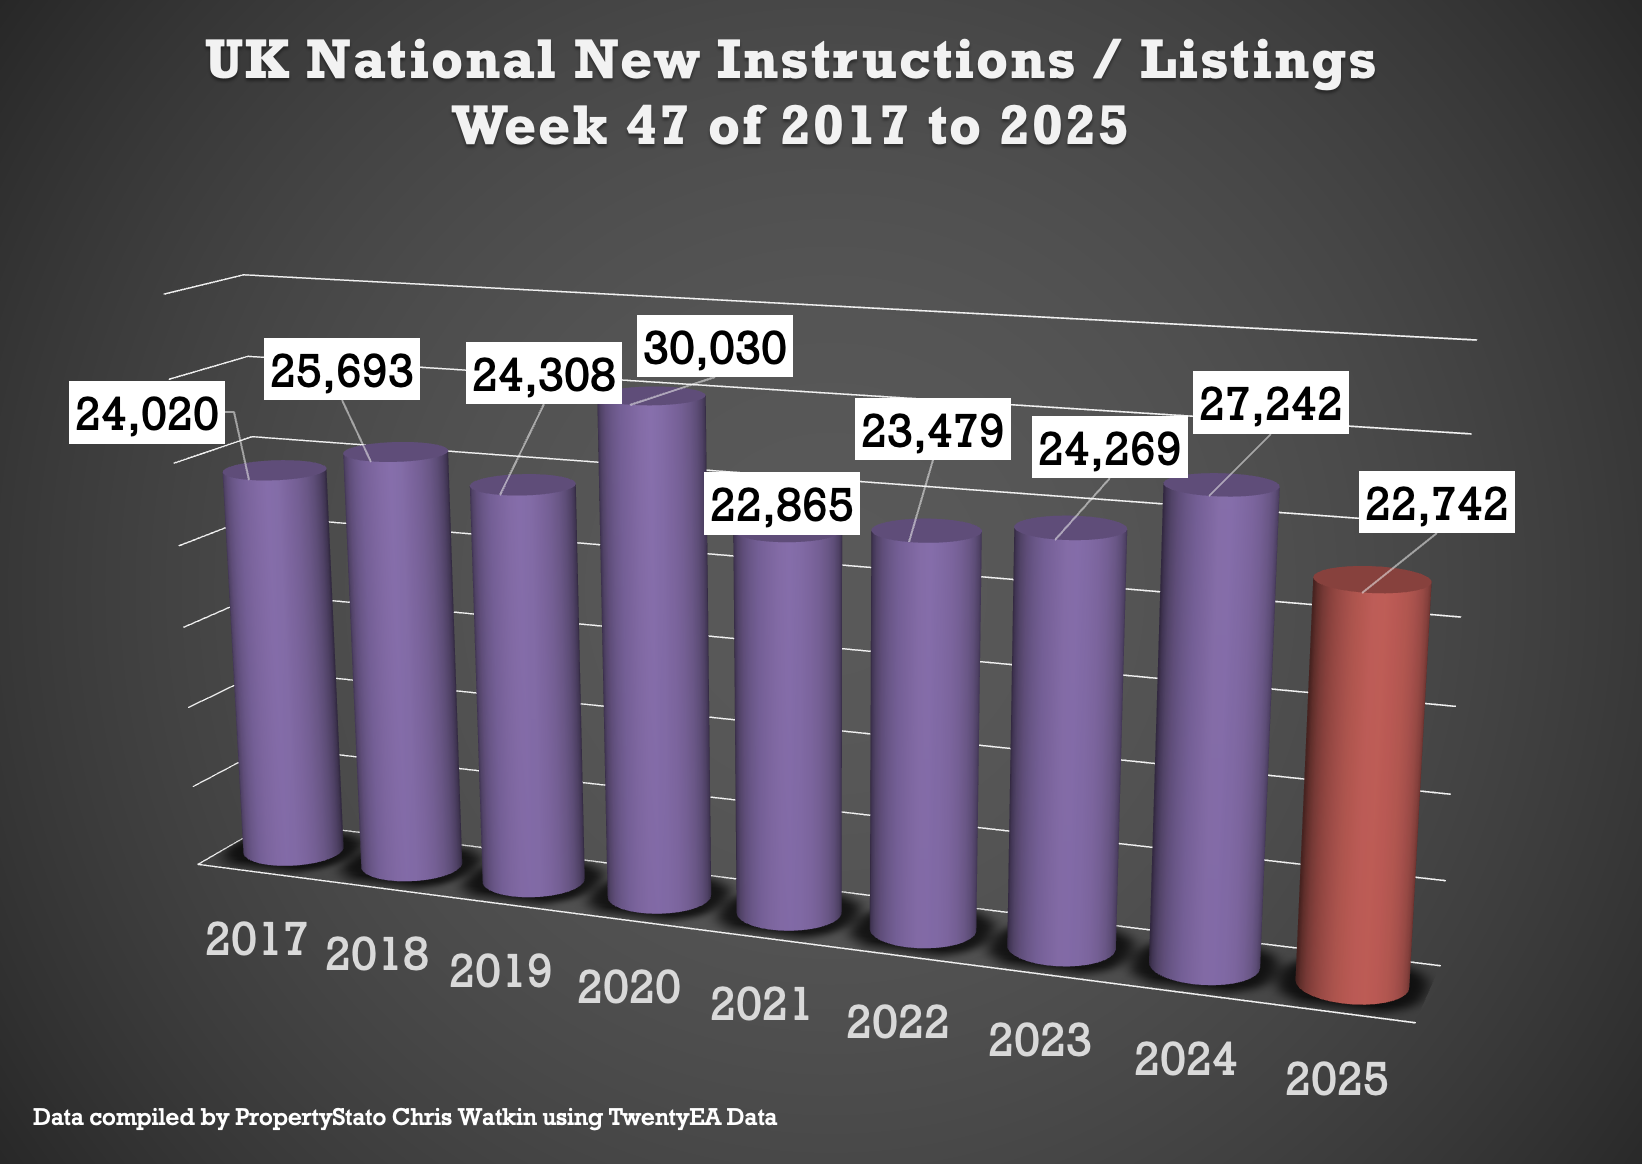
+ 22.7k new properties came to market this week, down as expected from 24.7k last week.
+ 2025 weekly average: 34.7k.
+ 9 year week 47 average : 25k
+ Year-to-date (YTD): 1.633m new listings, 0.5% higher than 2024 YTD (1.624m) and 8.1% above the 2017–19 average (1.511m).

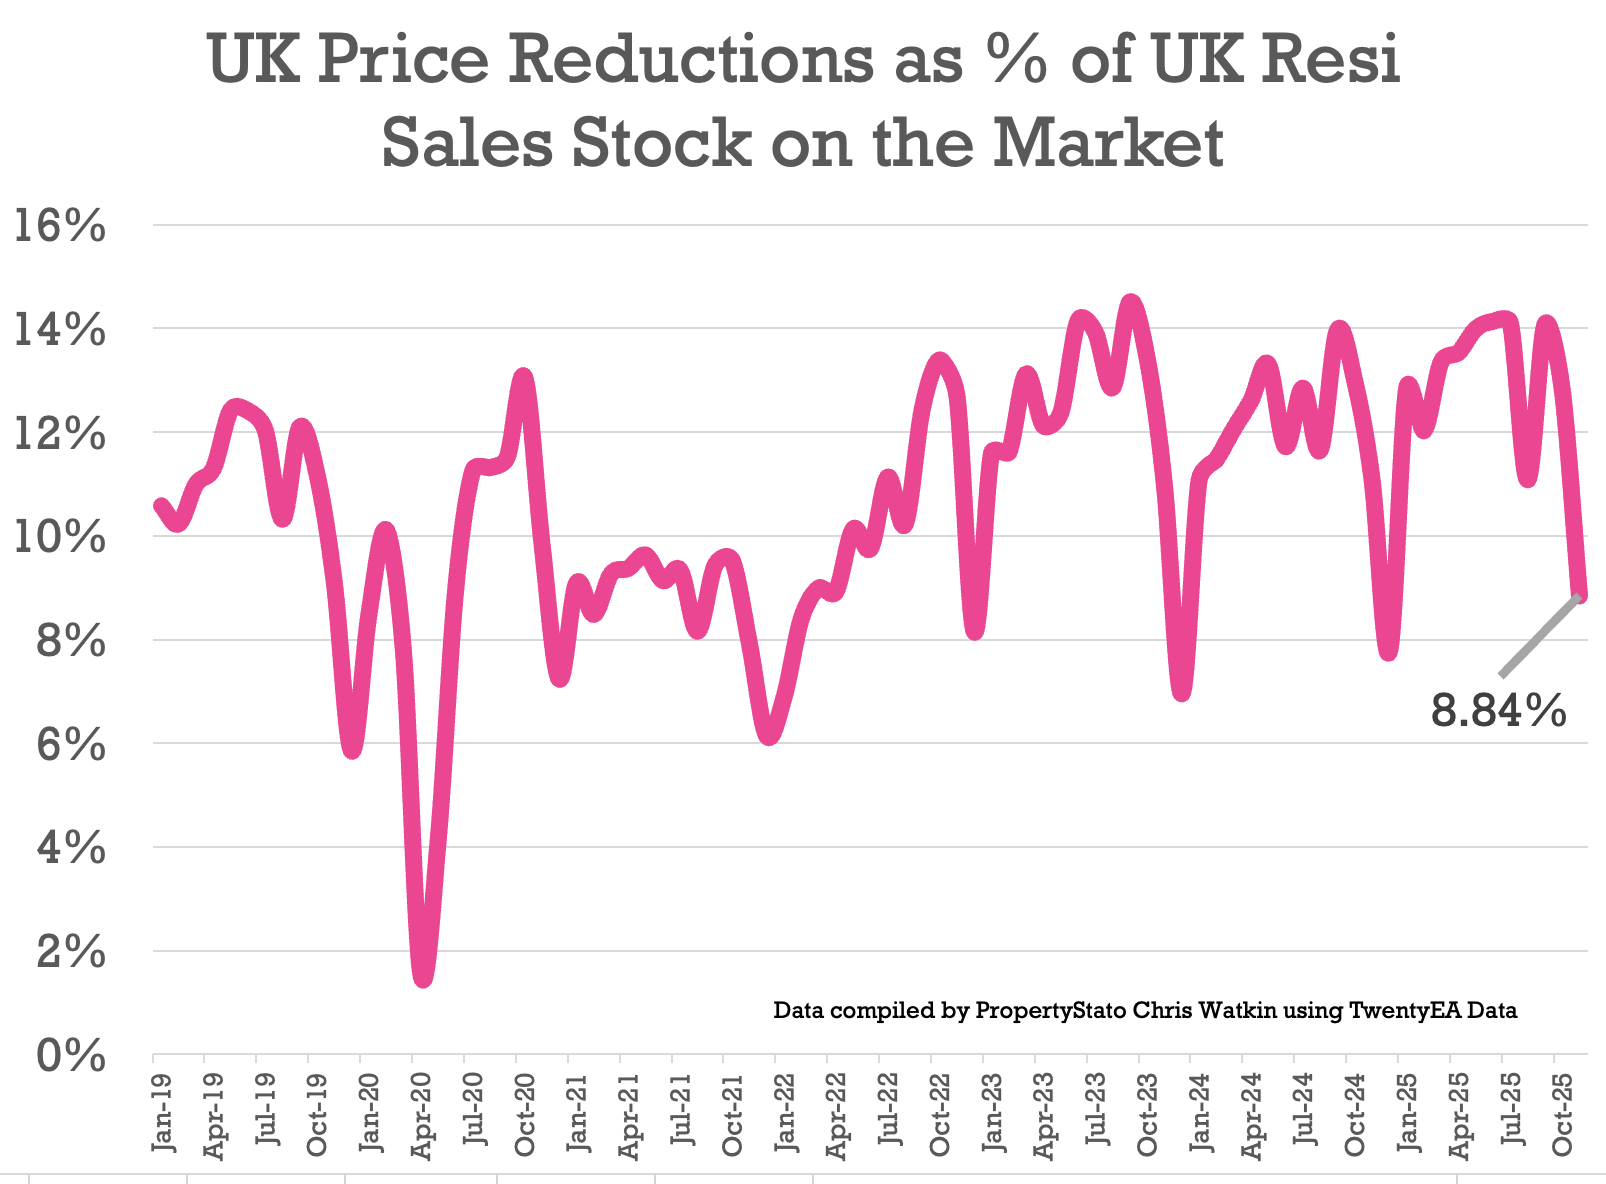
✅ Price Reductions
+ 13.2k reductions this week, lower than last week’s at 13.4k (Estate Agents seem to forget they can reduce houses prices after the first week in November!). 23.2k is the average weekly number of reductions for 2025.
+ 8.8% of resi homes for sale were reduced in November. Compared to Oct 12.8%, Sept 14.1%, August 11.1%, July 14.1% in July and 14% in June.
+ 2025 average still remains at 12.8%, versus the five-year long-term average of 10.74%.
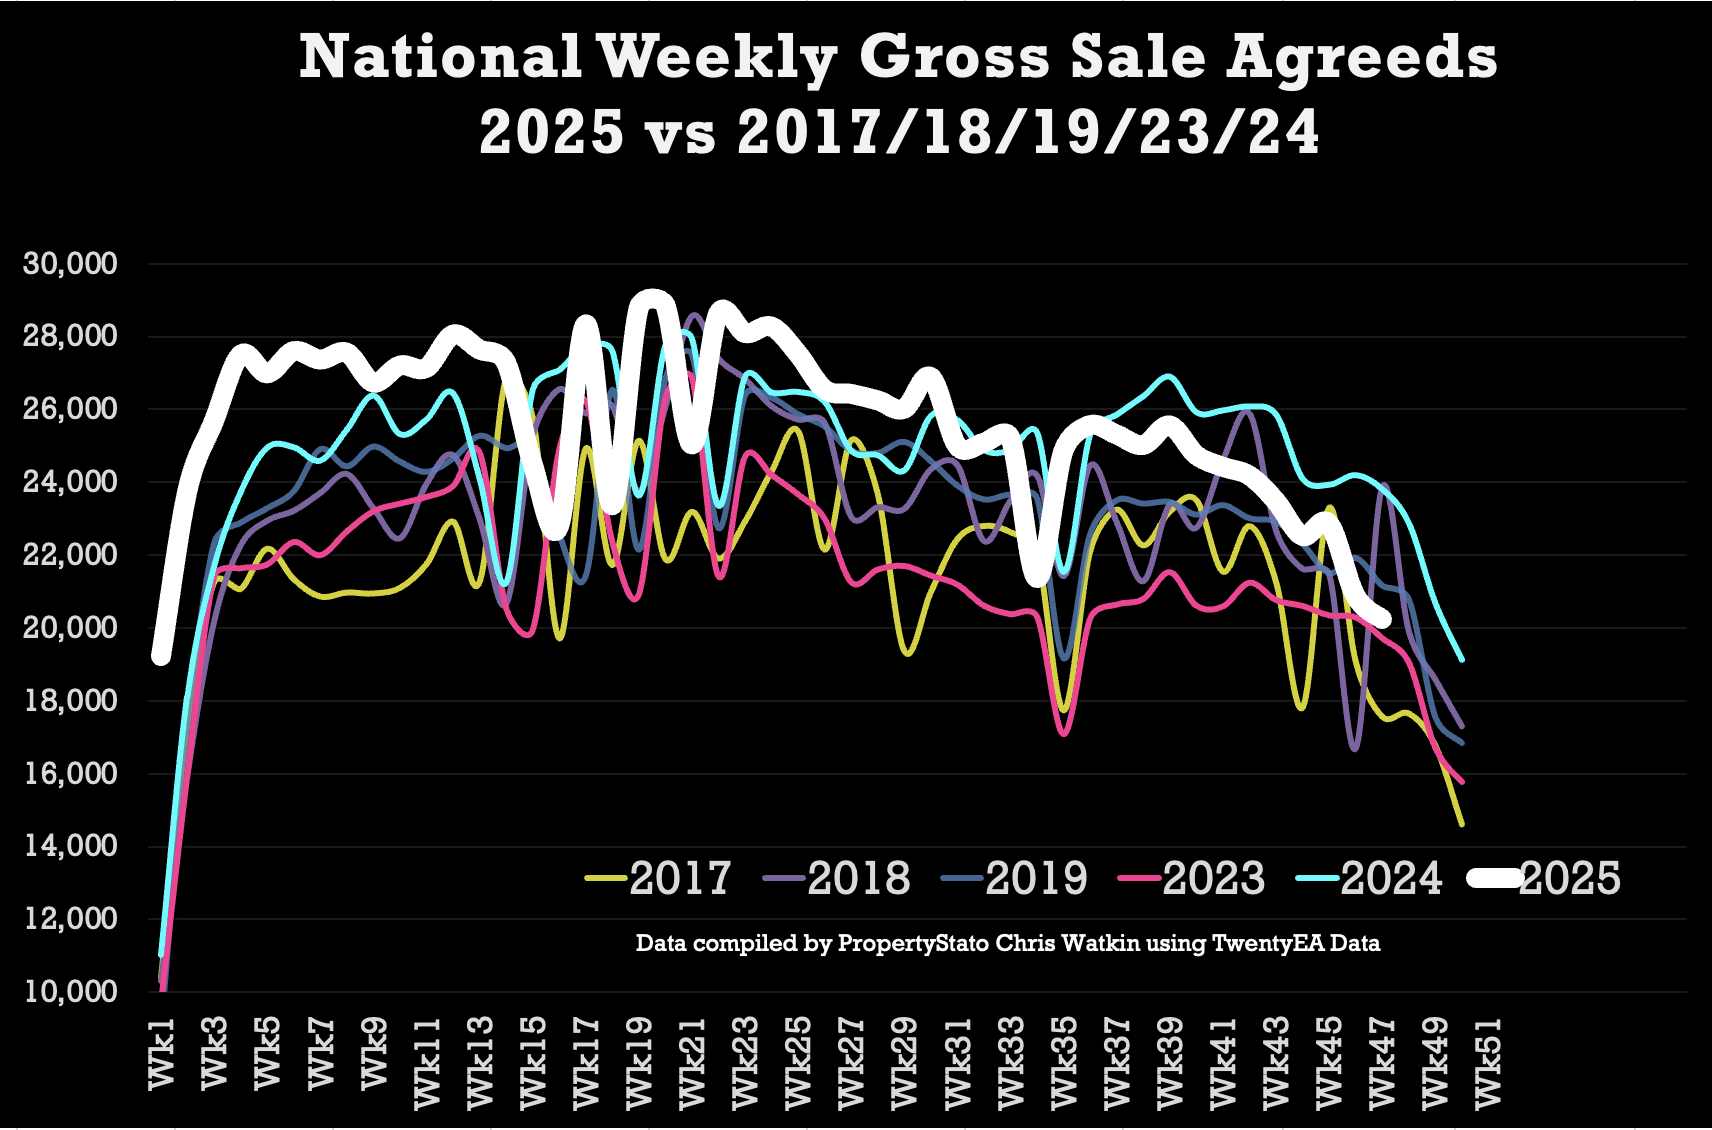
✅ Sales Agreed
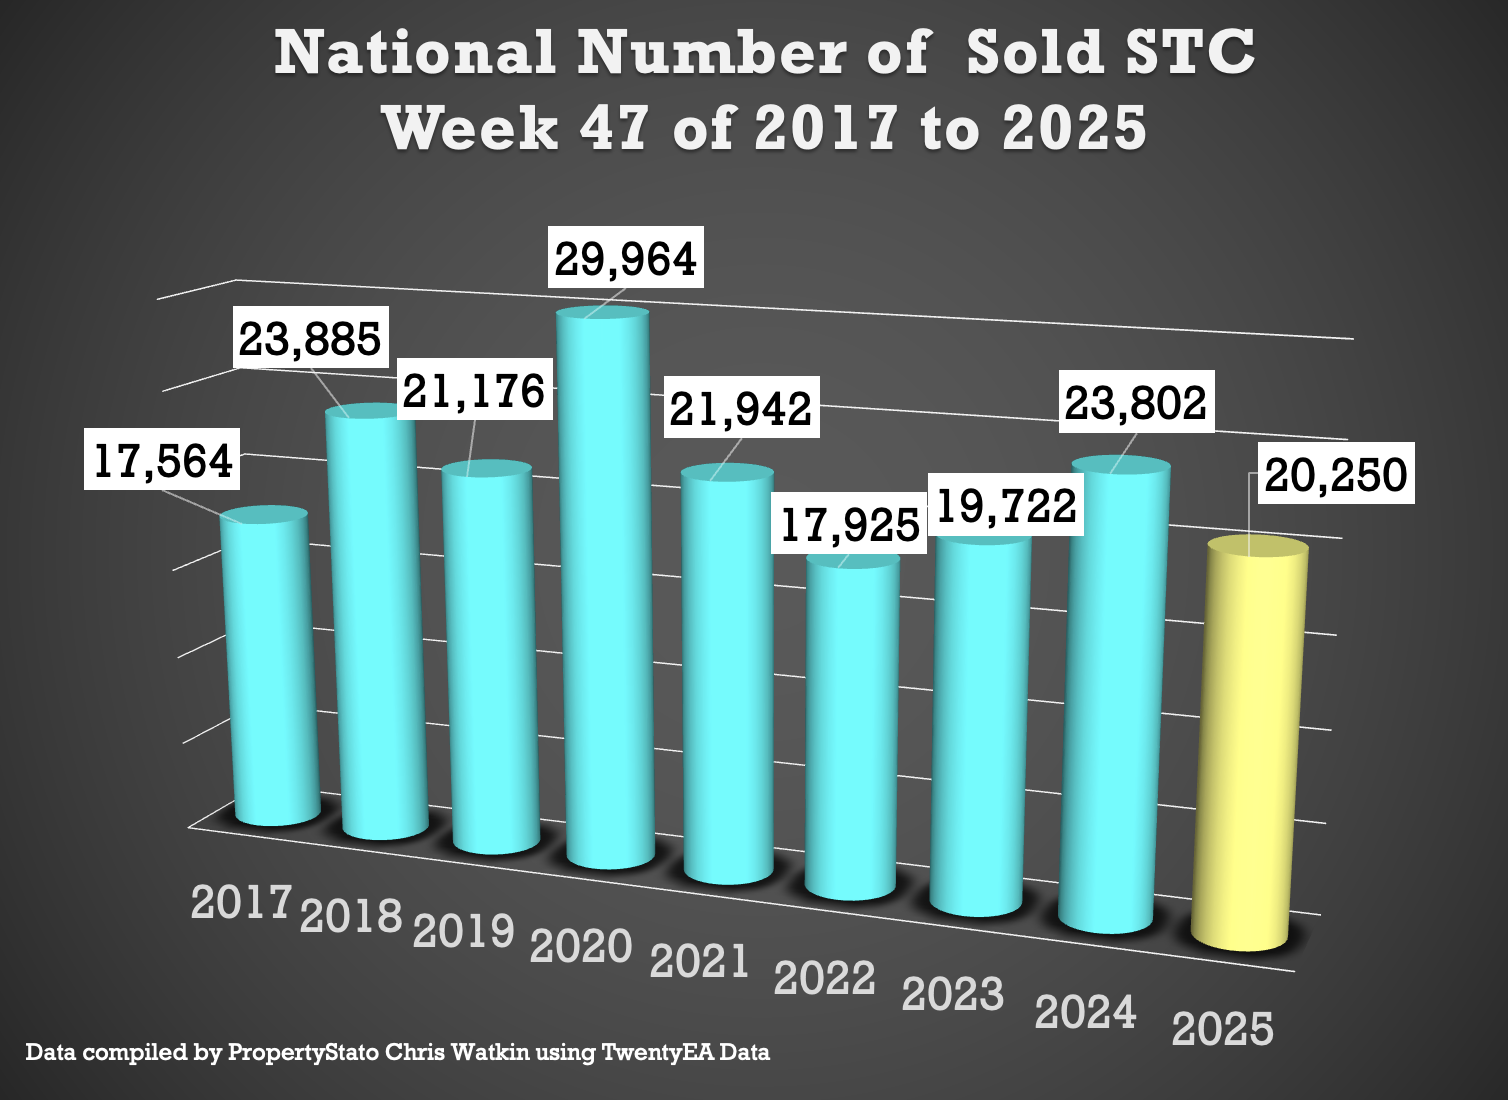
+ 20.3k homes sold subject to contract this week, down expectedly from 20.9k last week.
+ Week 47 average (for last 9 years) :21.8k
+ 2025 weekly average : 26k.
+ YTD: 1.203m gross sales, which is 3% ahead of 2024 (1.167m) and 11.9% above the 2017–19 average (1.074m).
+ Some will note Gross Sales in Q4 were higher – this was the first time buyers were buying homes to beat the March 2025 stamp duty deadline.
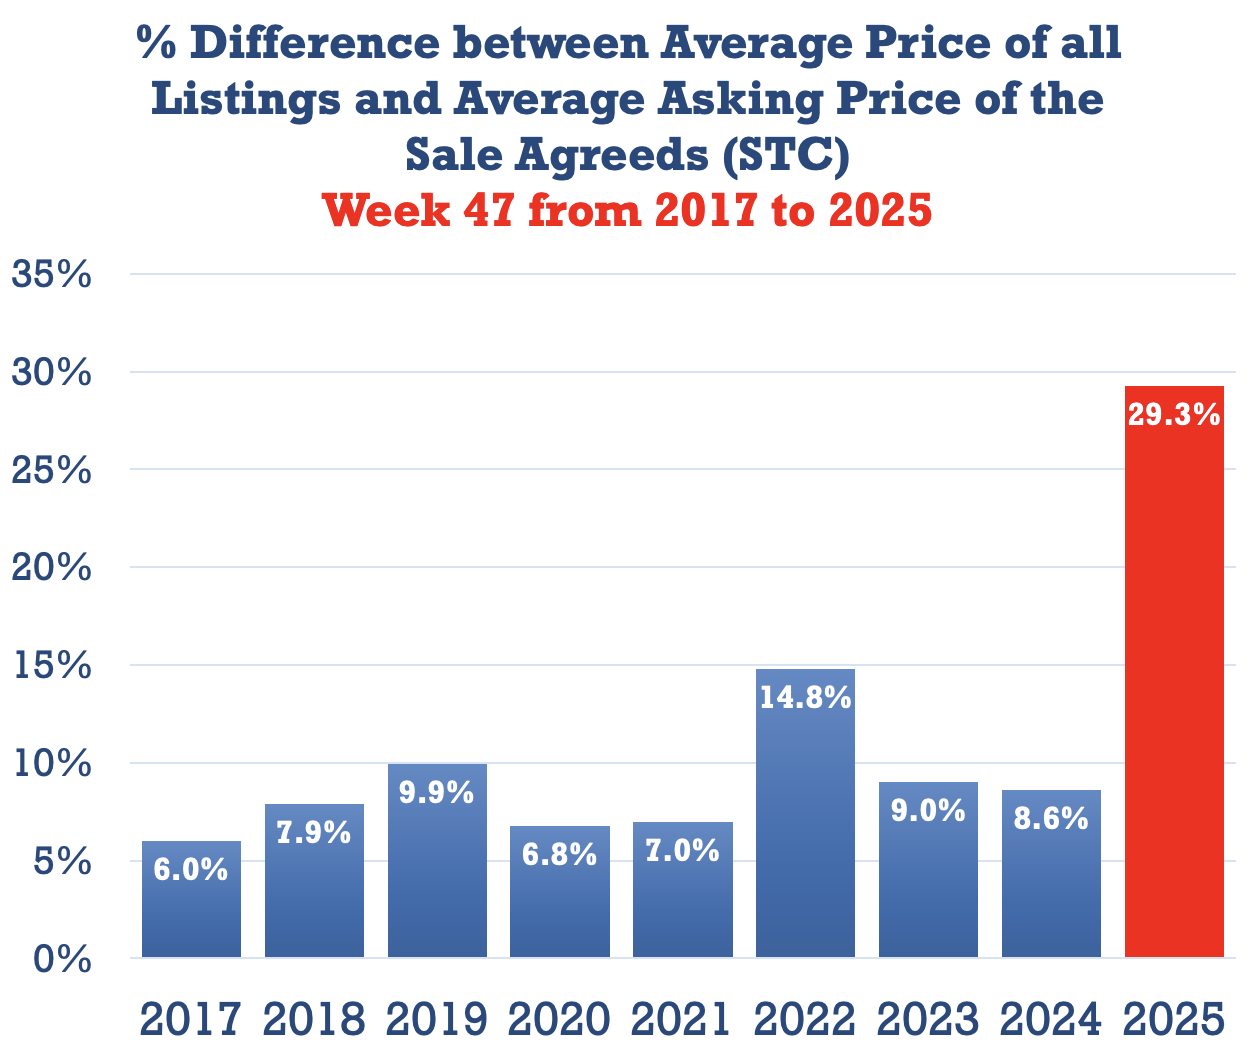
✅ Price Diff between Listings & Sales
+ Average Asking Price of listings last week £452k vs (£395 for the month before). This a massive jump and is down to a large number of Inner London home sin the £1.5m+ coming on the market.
+ Average asking price of Sales Agreed (SSTC)last week was £350k (in line with the average of 2025) – a29.3% difference (long term 9 year average is 16% to 17%.
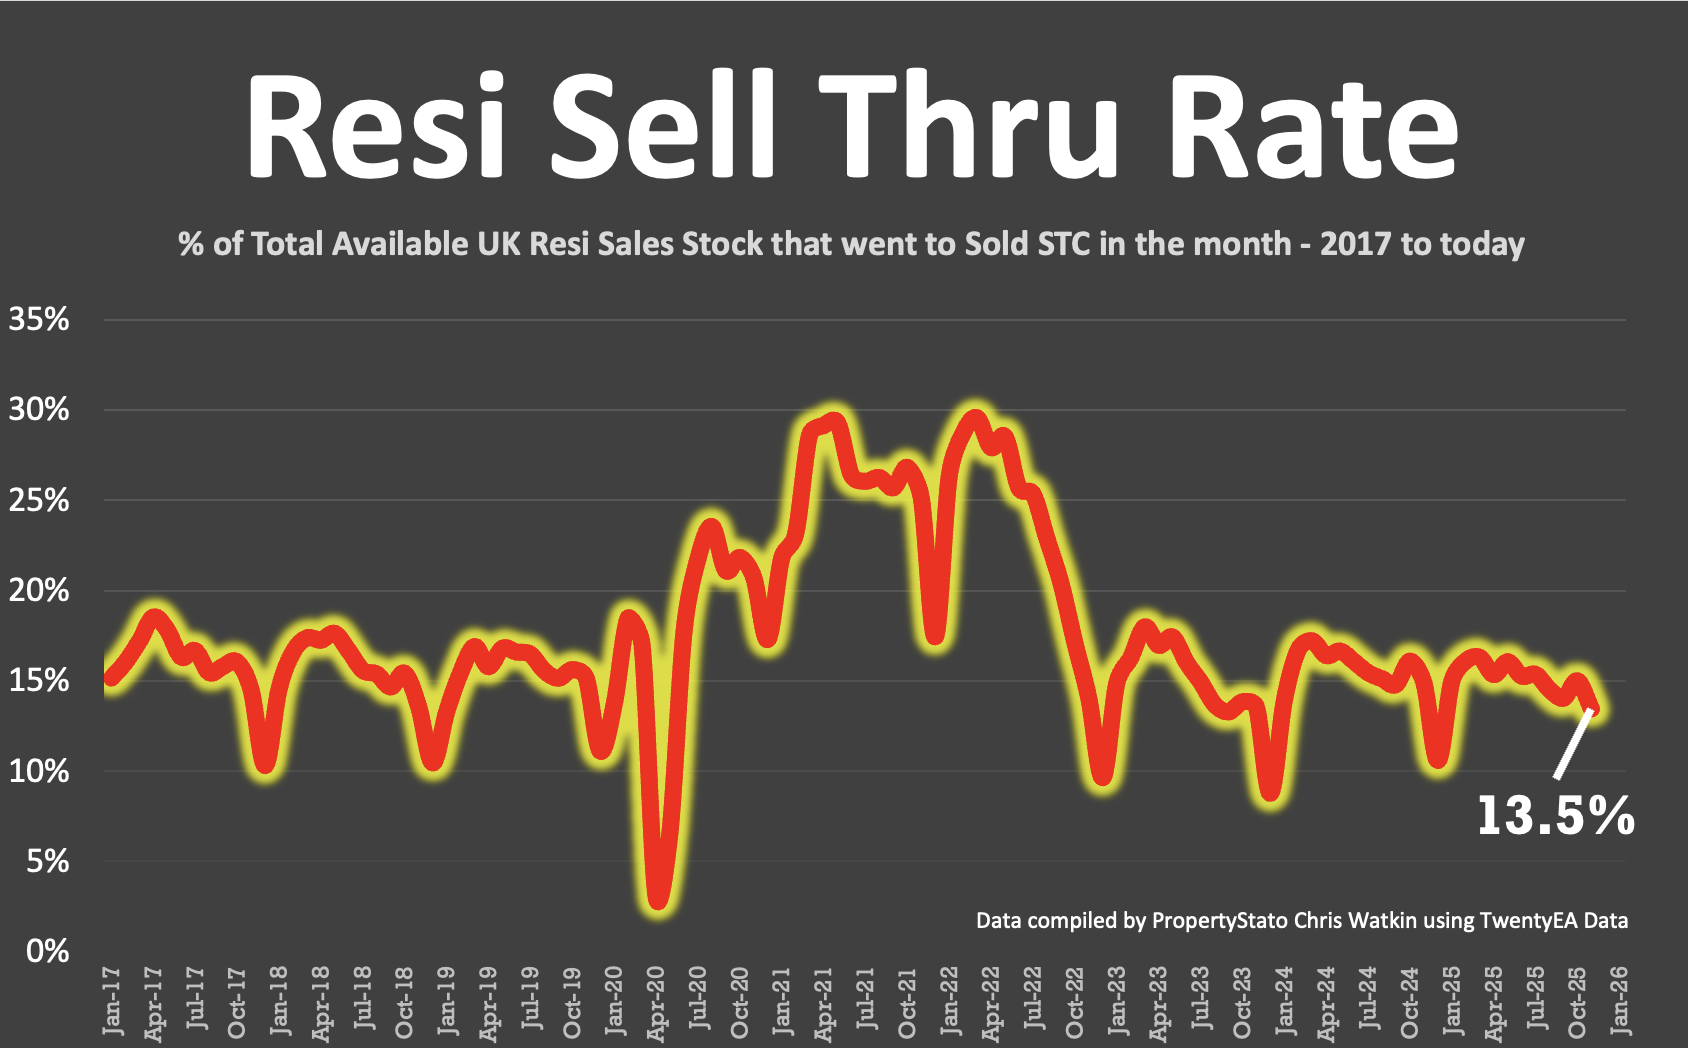
✅ Sell-Through Rate
+ 13.5% of homes on agents’ books went SSTC in October. Down from 15% in October, 14.1% in Sept, 14.5% in Aug, 15.4% in July, 15.3% in June, and 16.1% in May.
+ Pre-Covid average: 15.5%.
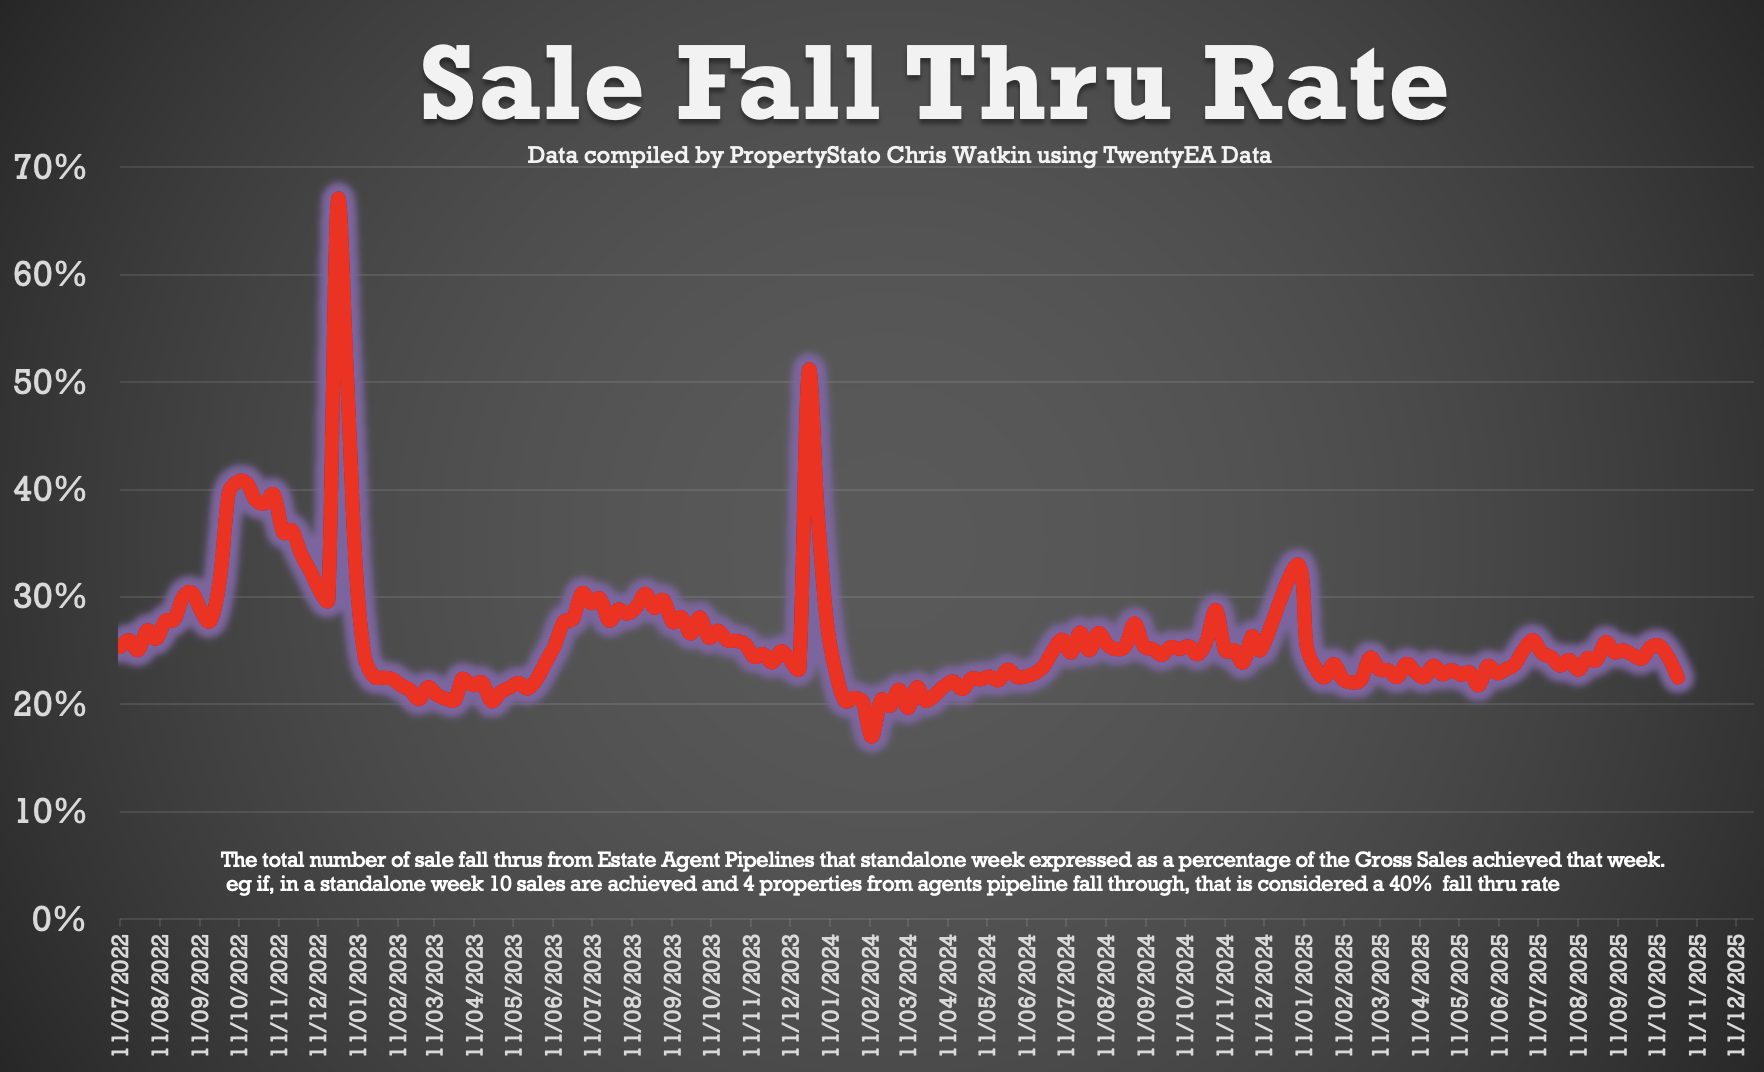
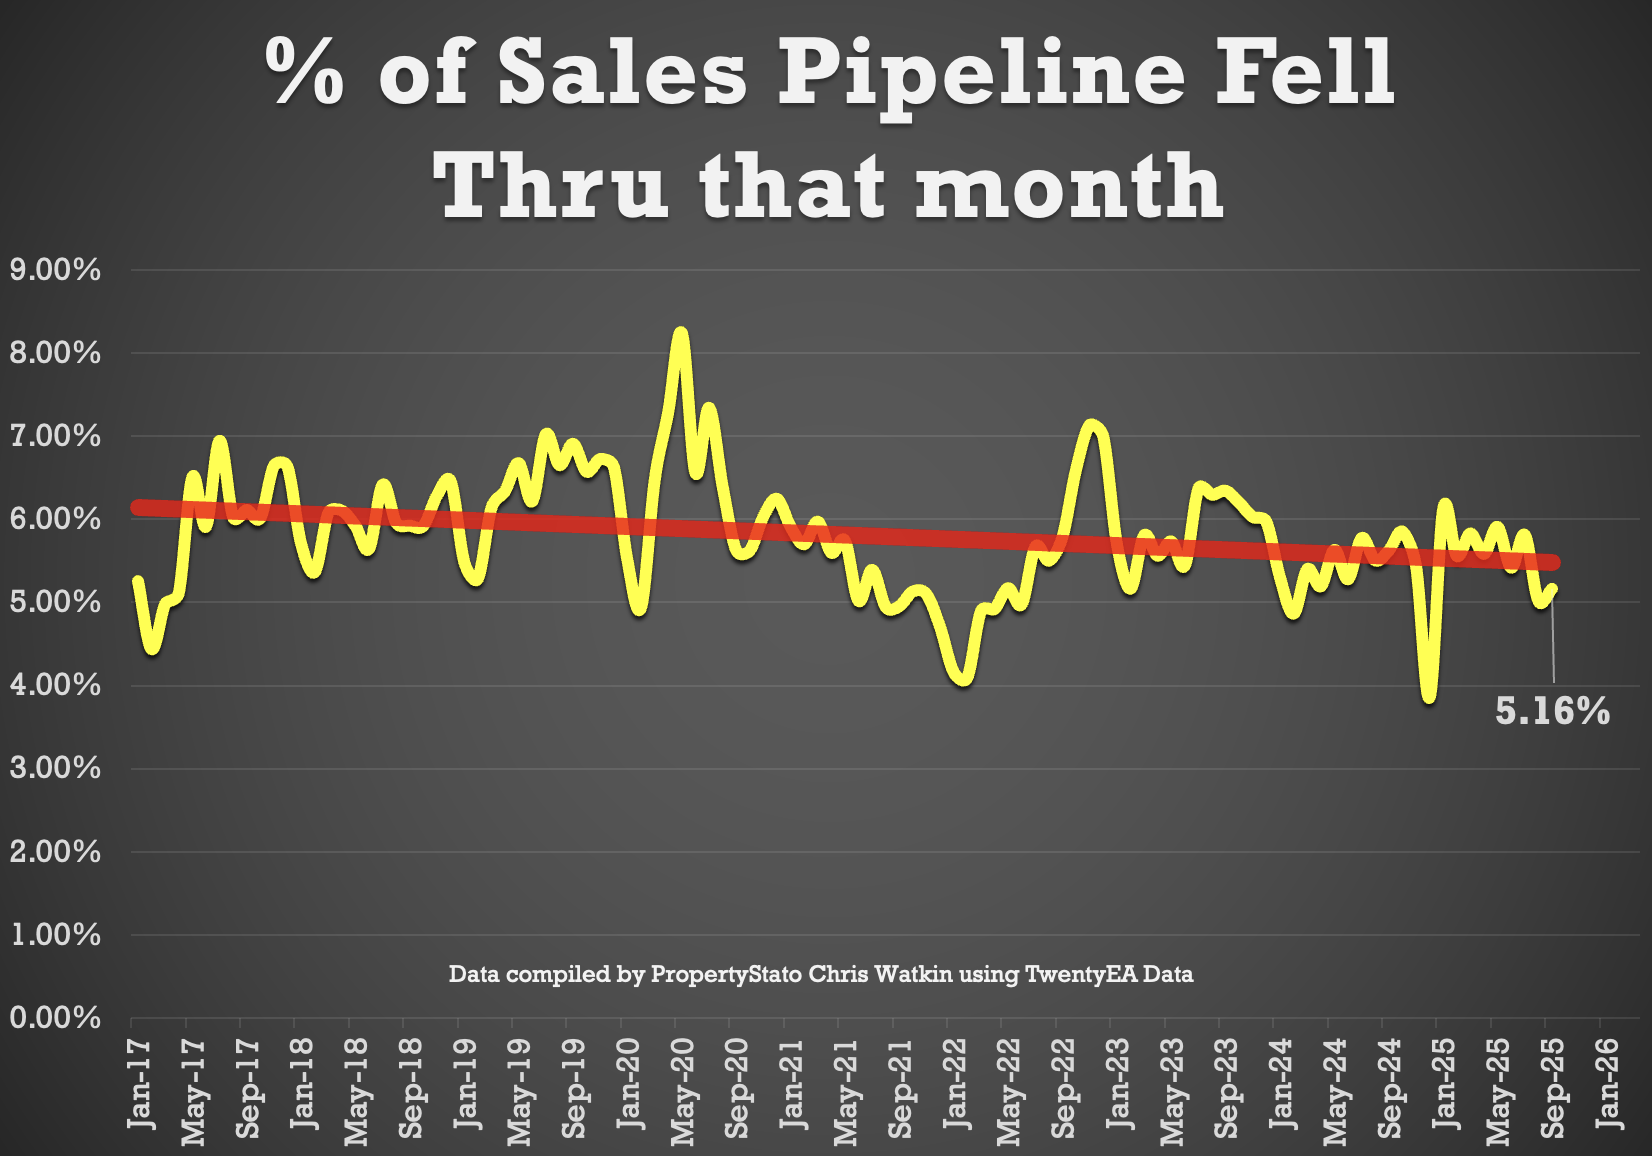
✅ Fall-Throughs
+ 5,054 fall-throughs last week (pipeline of 510k home Sold STC).
+ Weekly average for 2025: 6,128.
+ Fall-through rate: 25%, slightly up from 24.7% last week.
+ Long-term average: 24.2% (post-Truss chaos saw levels exceed 40%).
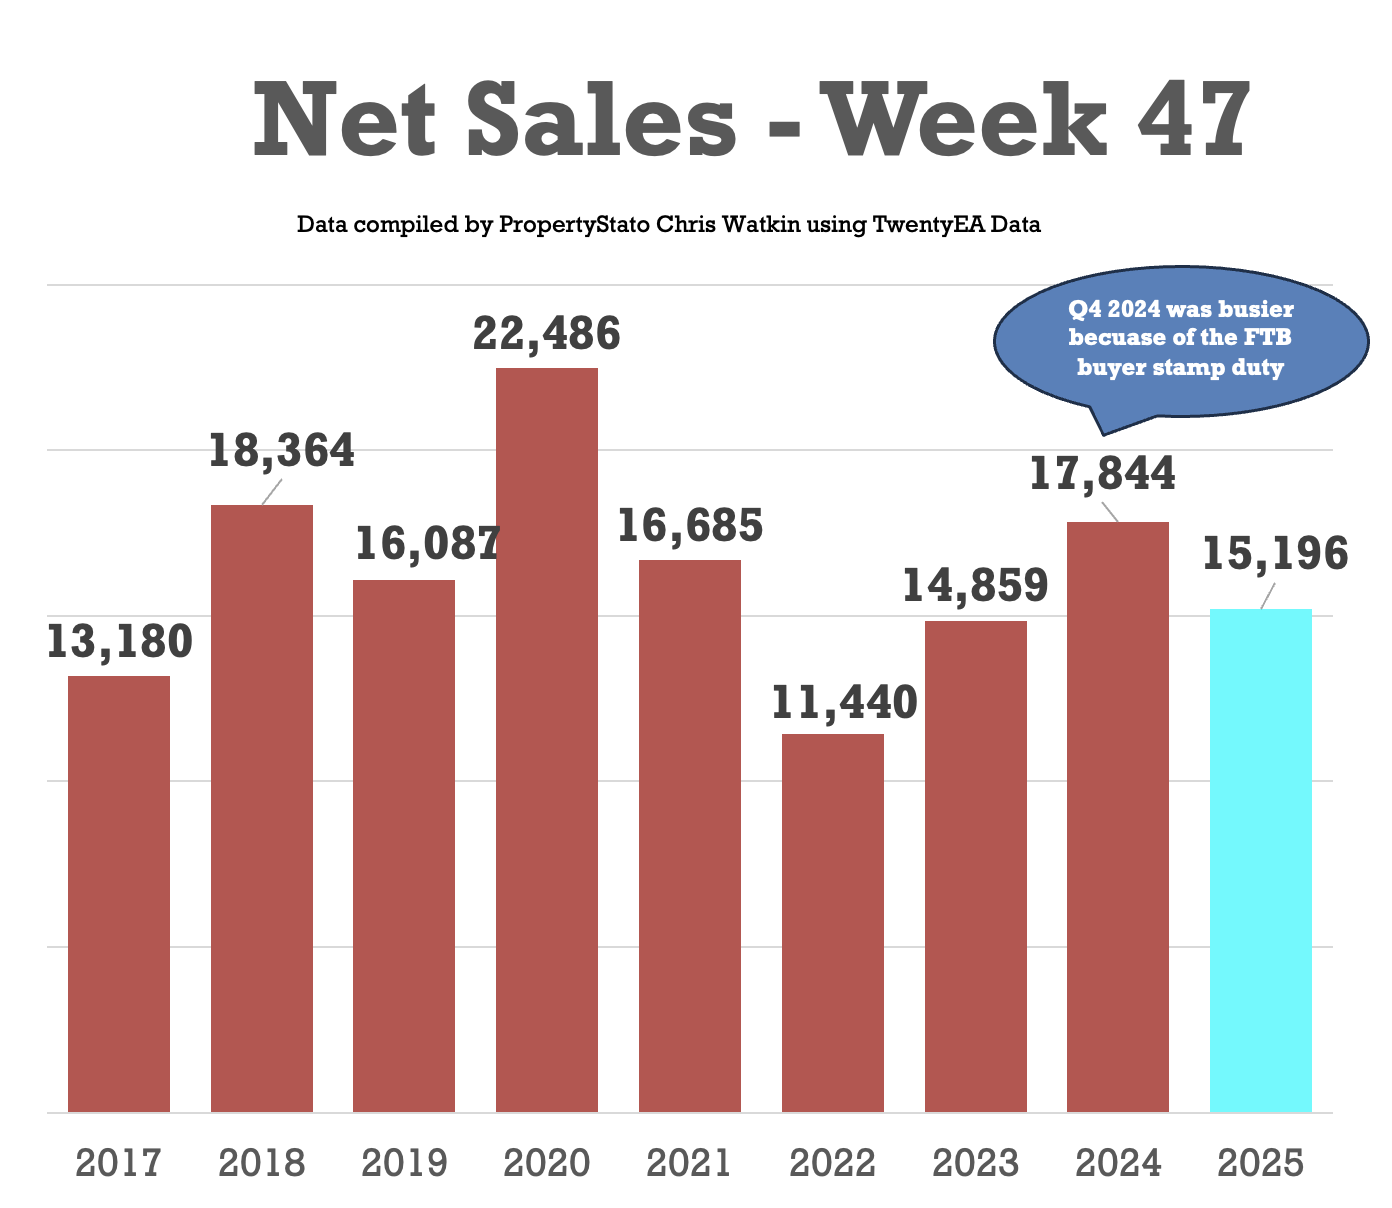
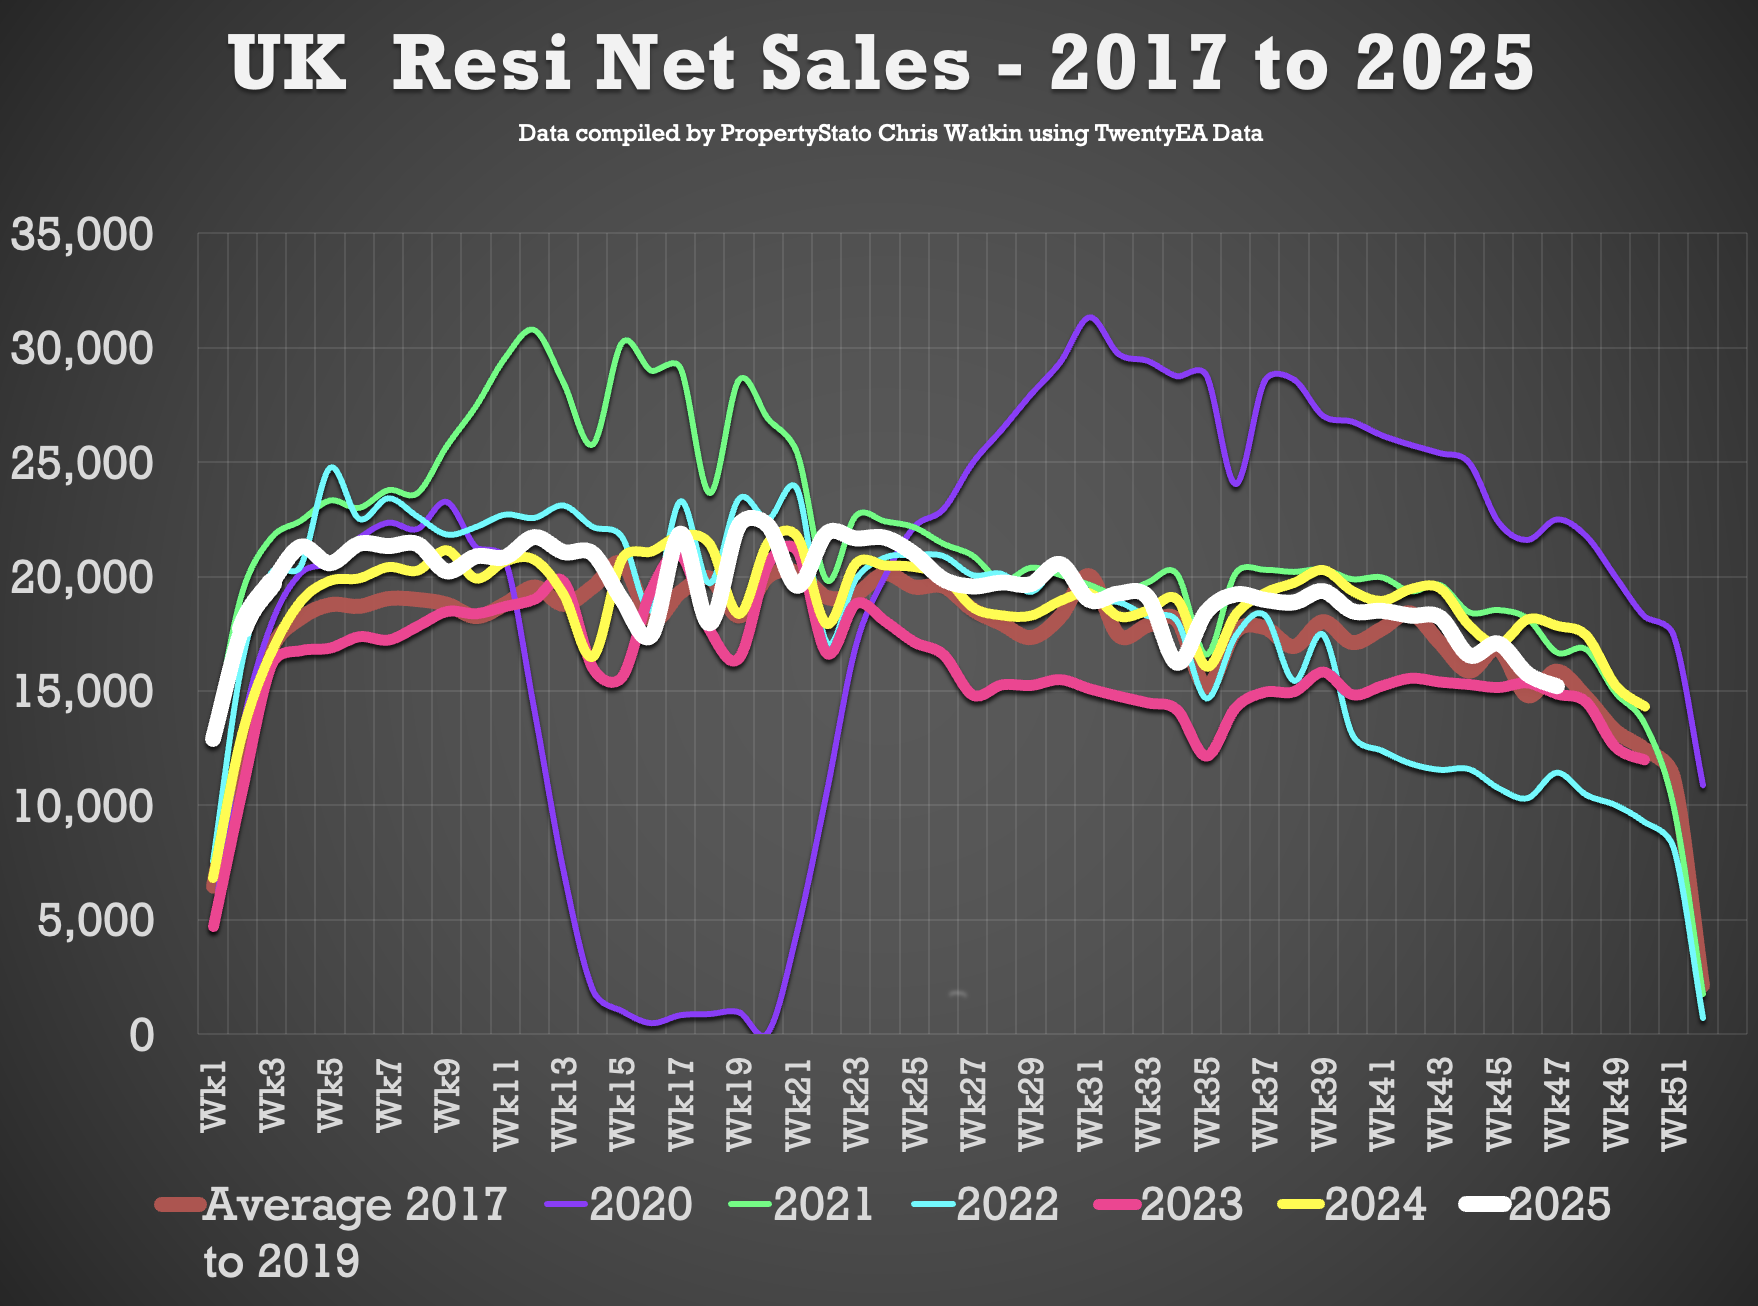
✅ Net Sales
+ 15.2k net sales this week, down expectedly from 15.7k last week.
+ Nine-year Week 47 average: 16.2k.
+ Weekly average for 2025: 19.4k.
+ YTD: 914k, which is 2.6% ahead of 2024 (892k) and 9.1% above 2017–19 (840k).
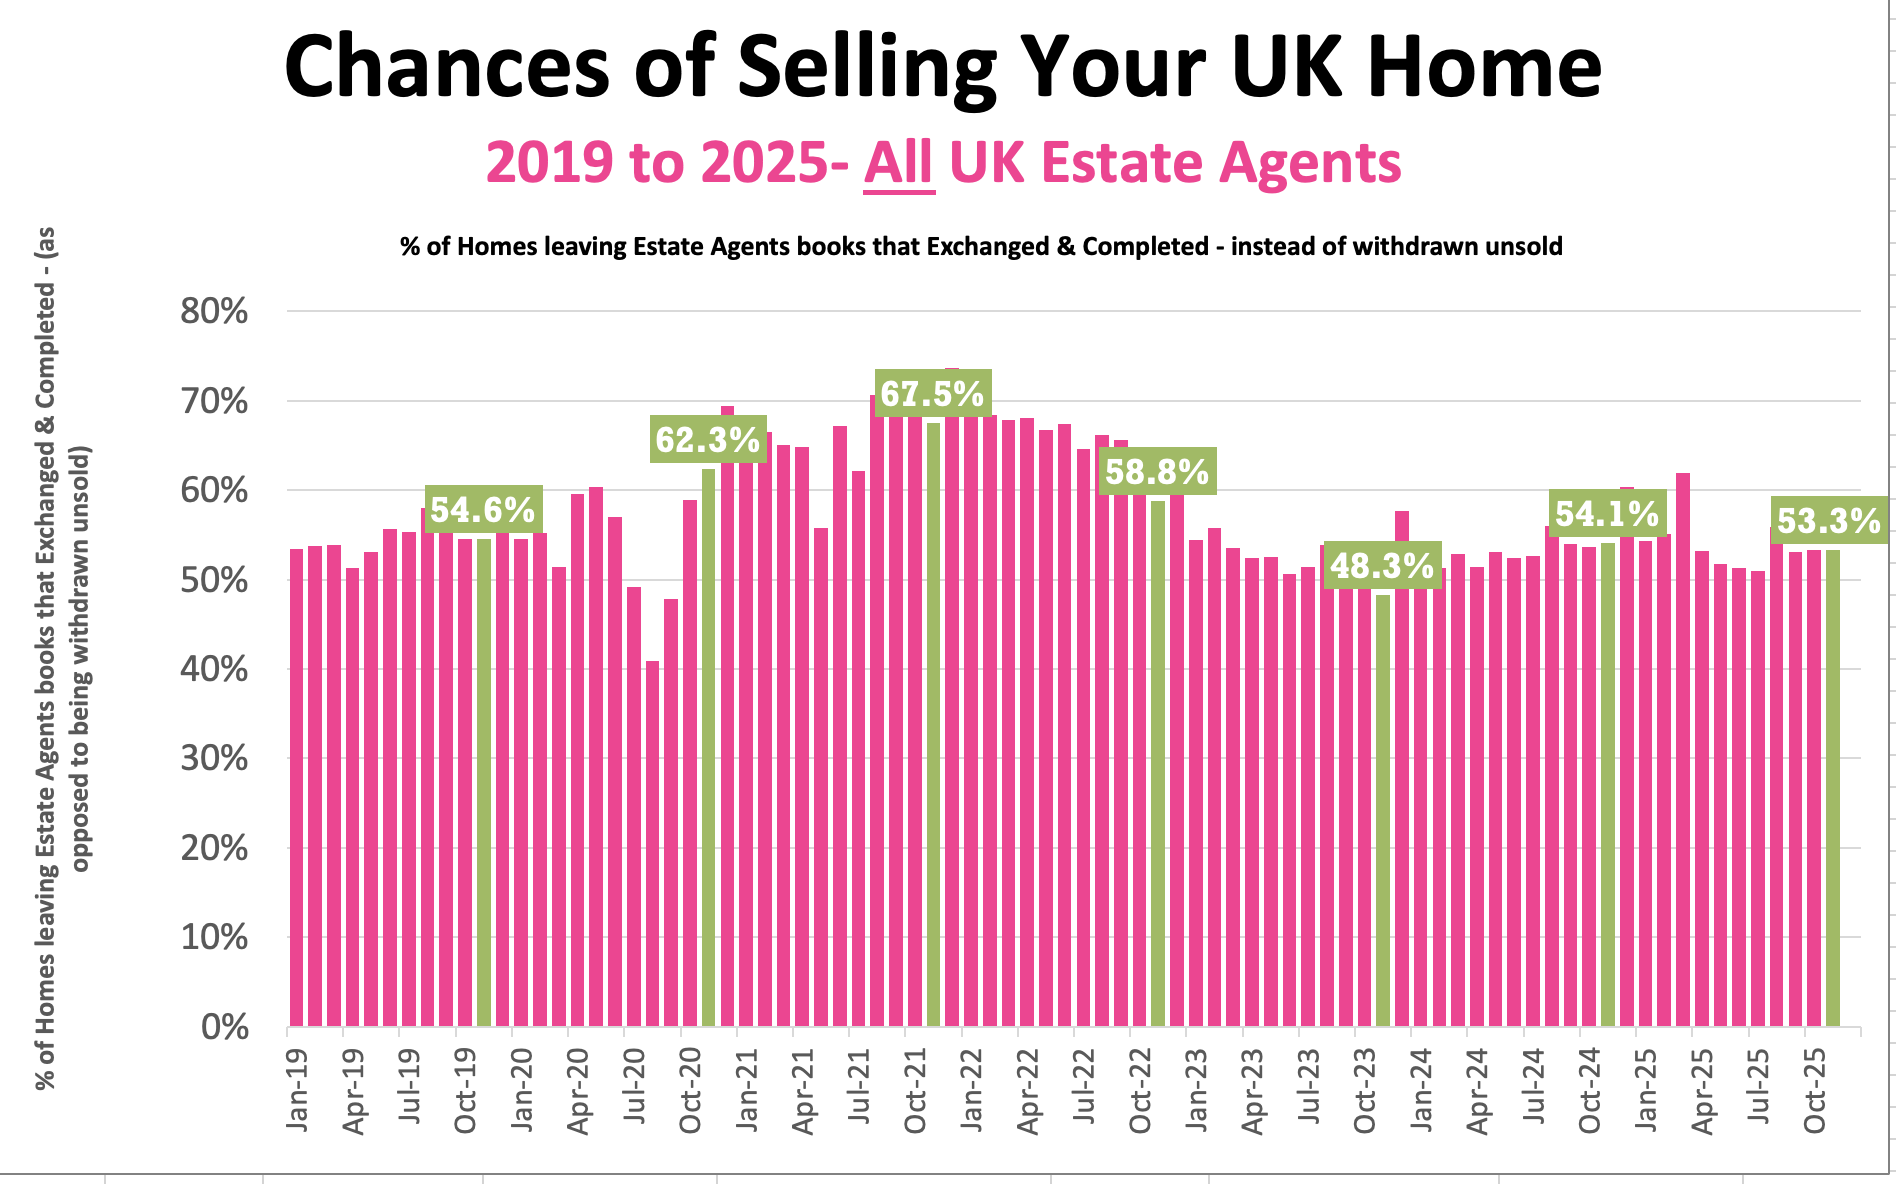
✅ Probability of Selling (% that Exchange vs withdrawal)
+ November Stats : 53.3% of homes that left agents’ books exchanged & completed in November. (Note this figure will change throughout the month as more November stats come in). (49.7k exchanges & 43.6k withdrawals as at 3rd Dec 2025)
+ October 53.3% / September: 53.1% / August :55.8% / July: 50.9% / June: 51.3% / May: 51.7% / April: 53.2%.
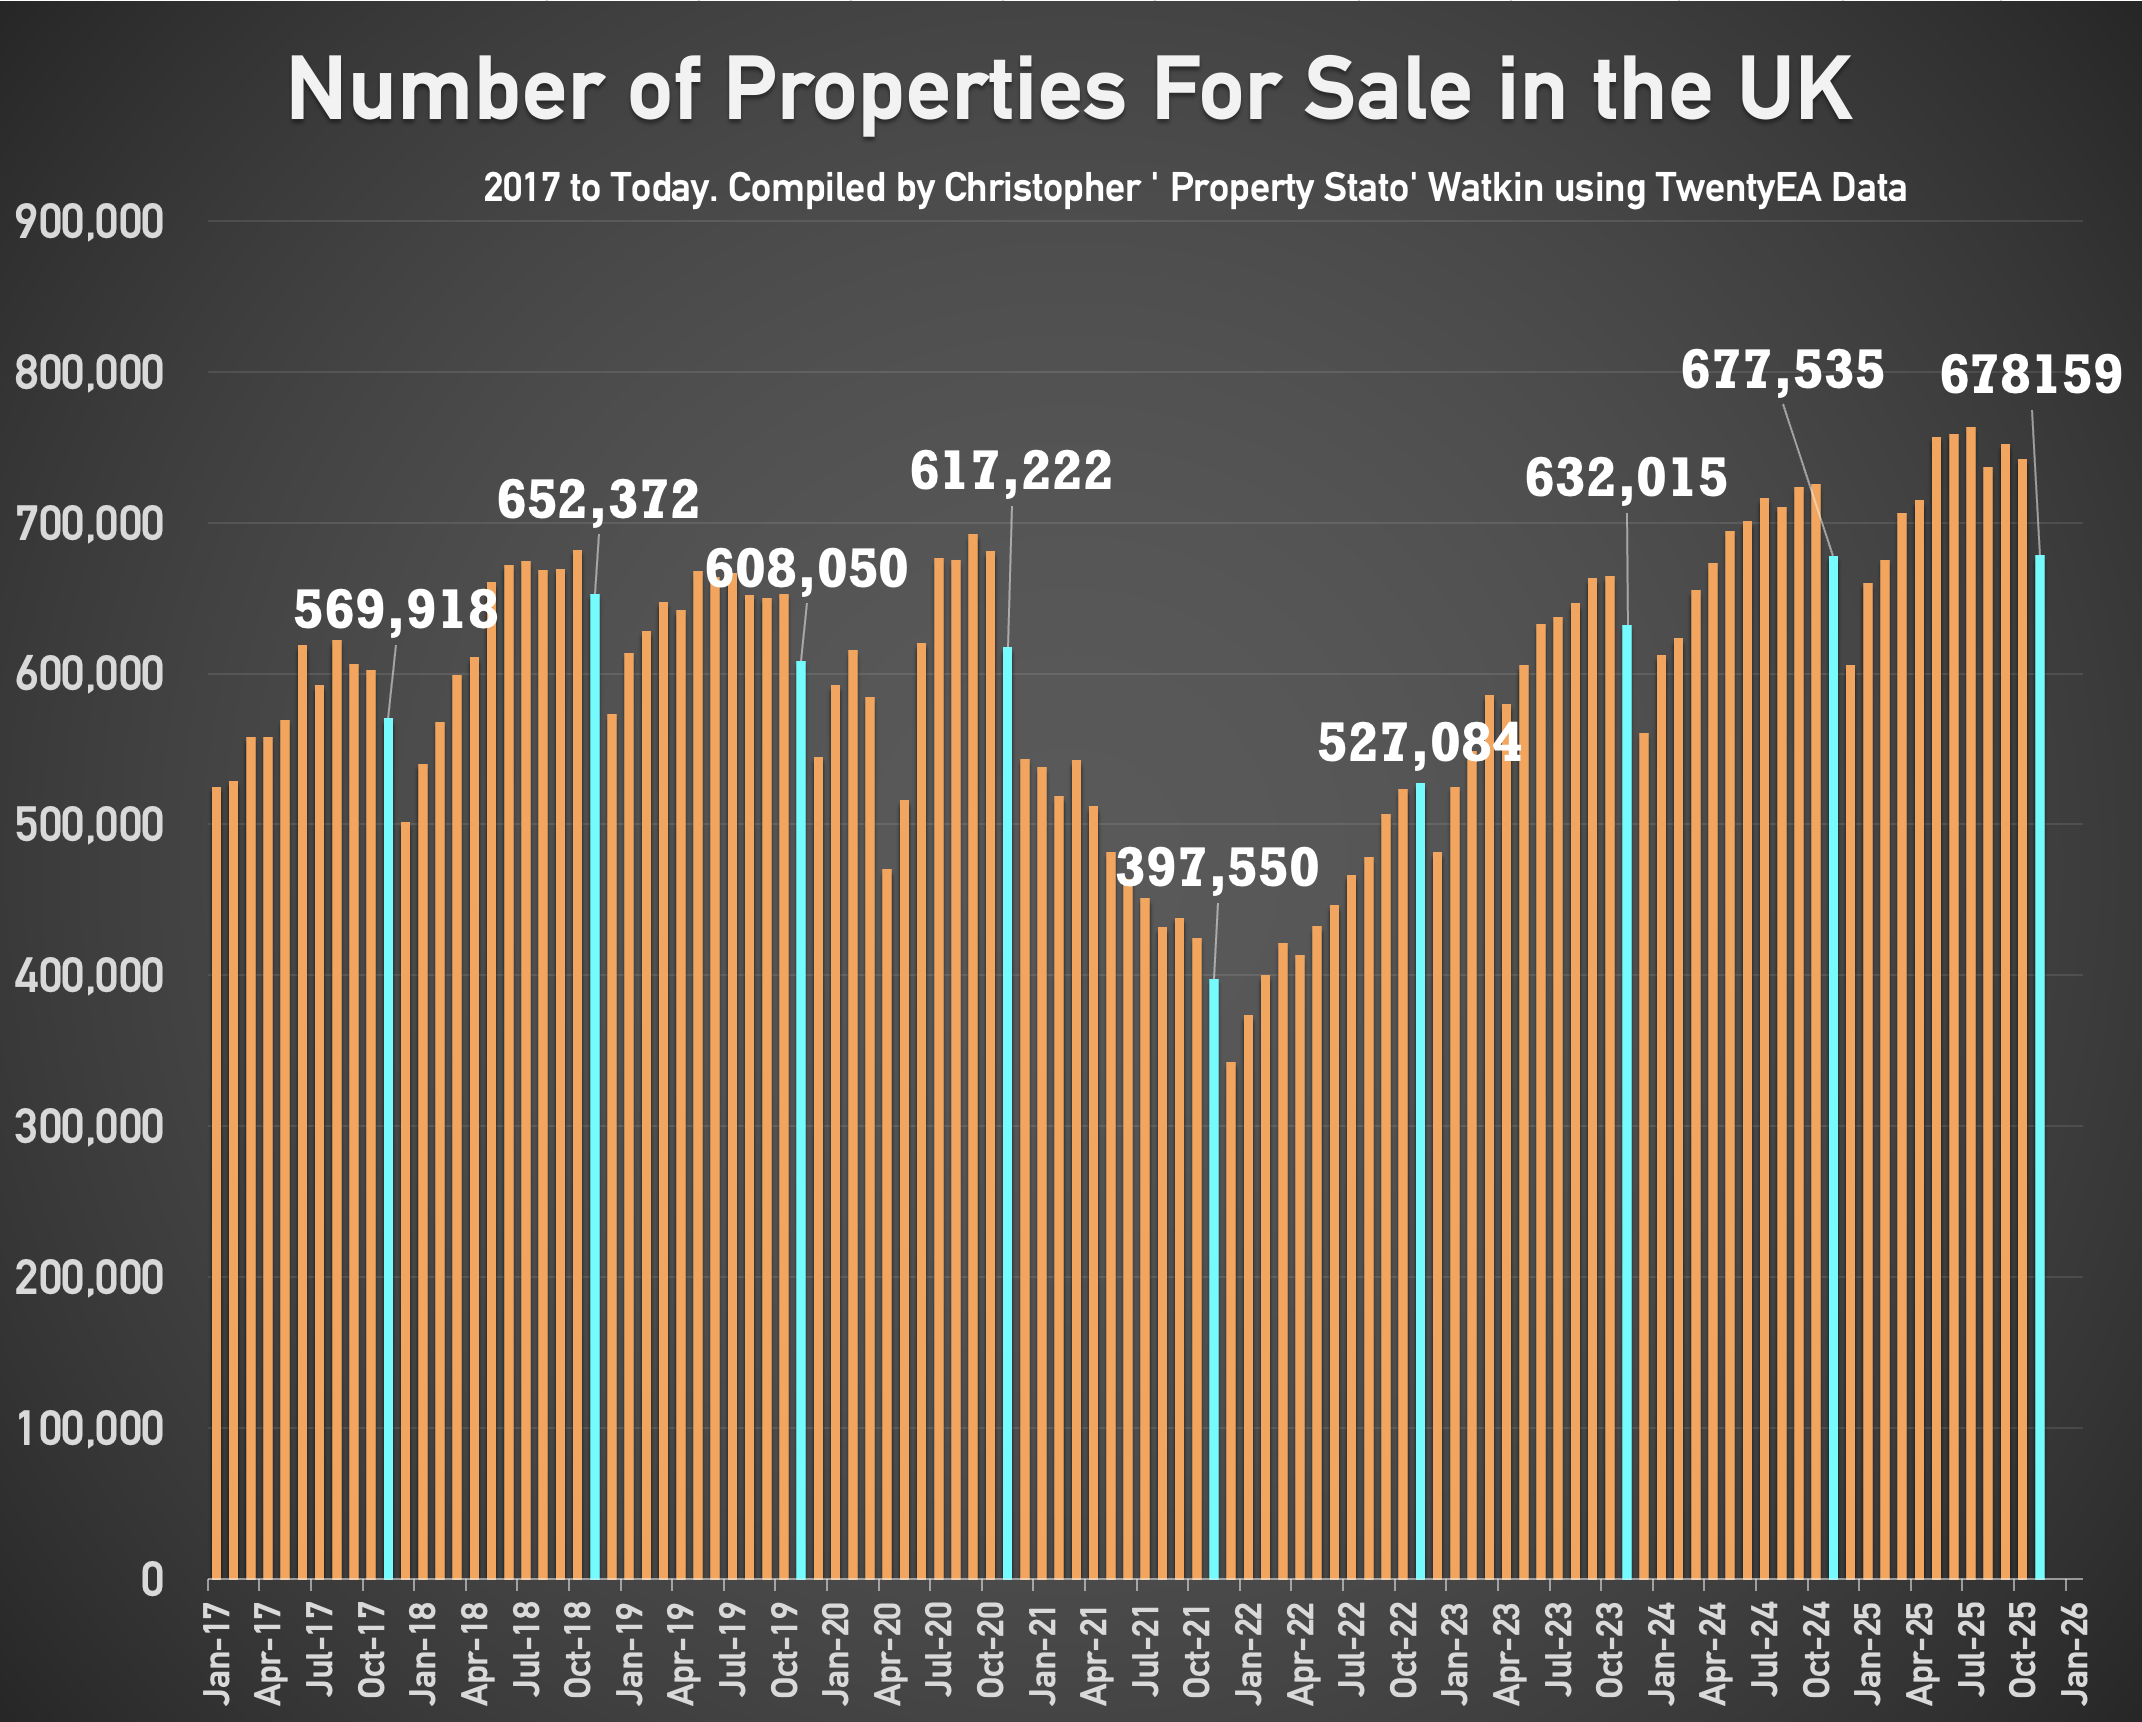
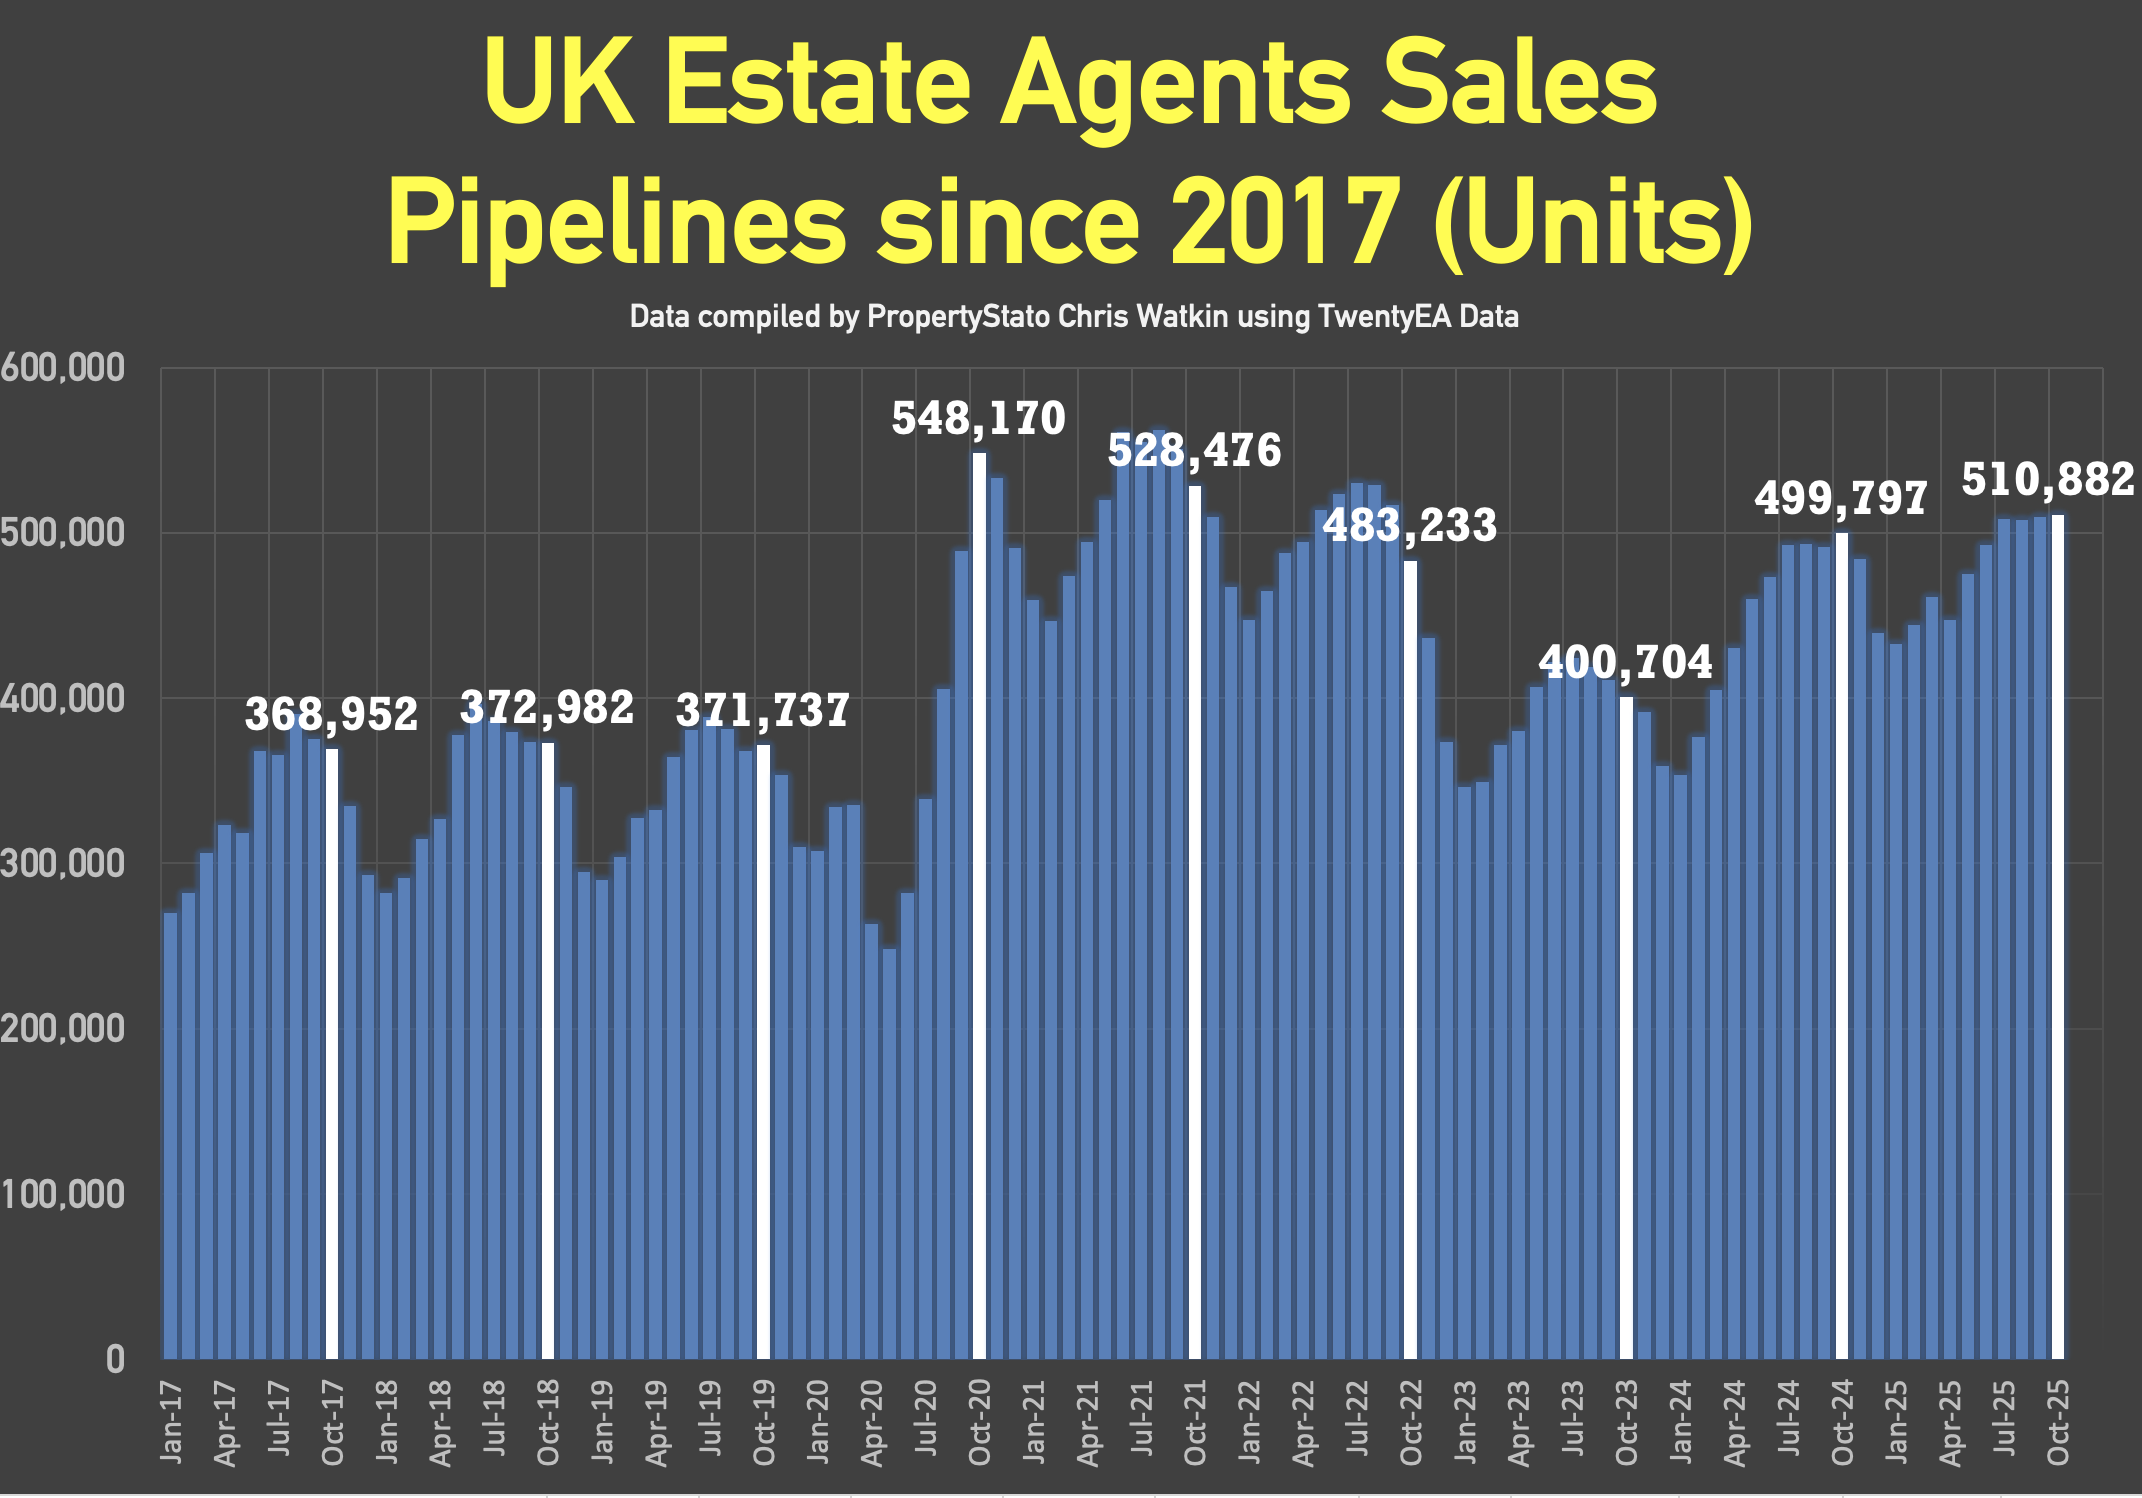
✅ Stock Levels
+ 678k homes on the market on the 1st of December, down from 742k on 1st of November. December ’25 is identical to December ’24.
+ 511k homes in sales pipeline on the 1st November, 2.2% higher than 12 months ago. (1st December figures to follow in next week’s show).

Comments are closed.