

 This week’s UK Property Market Stats Show for week ending Sunday 20th October 2024 features special guest, Ben Madden, to discuss the property market headlines for Week 42 of 2024.
The main headlines:
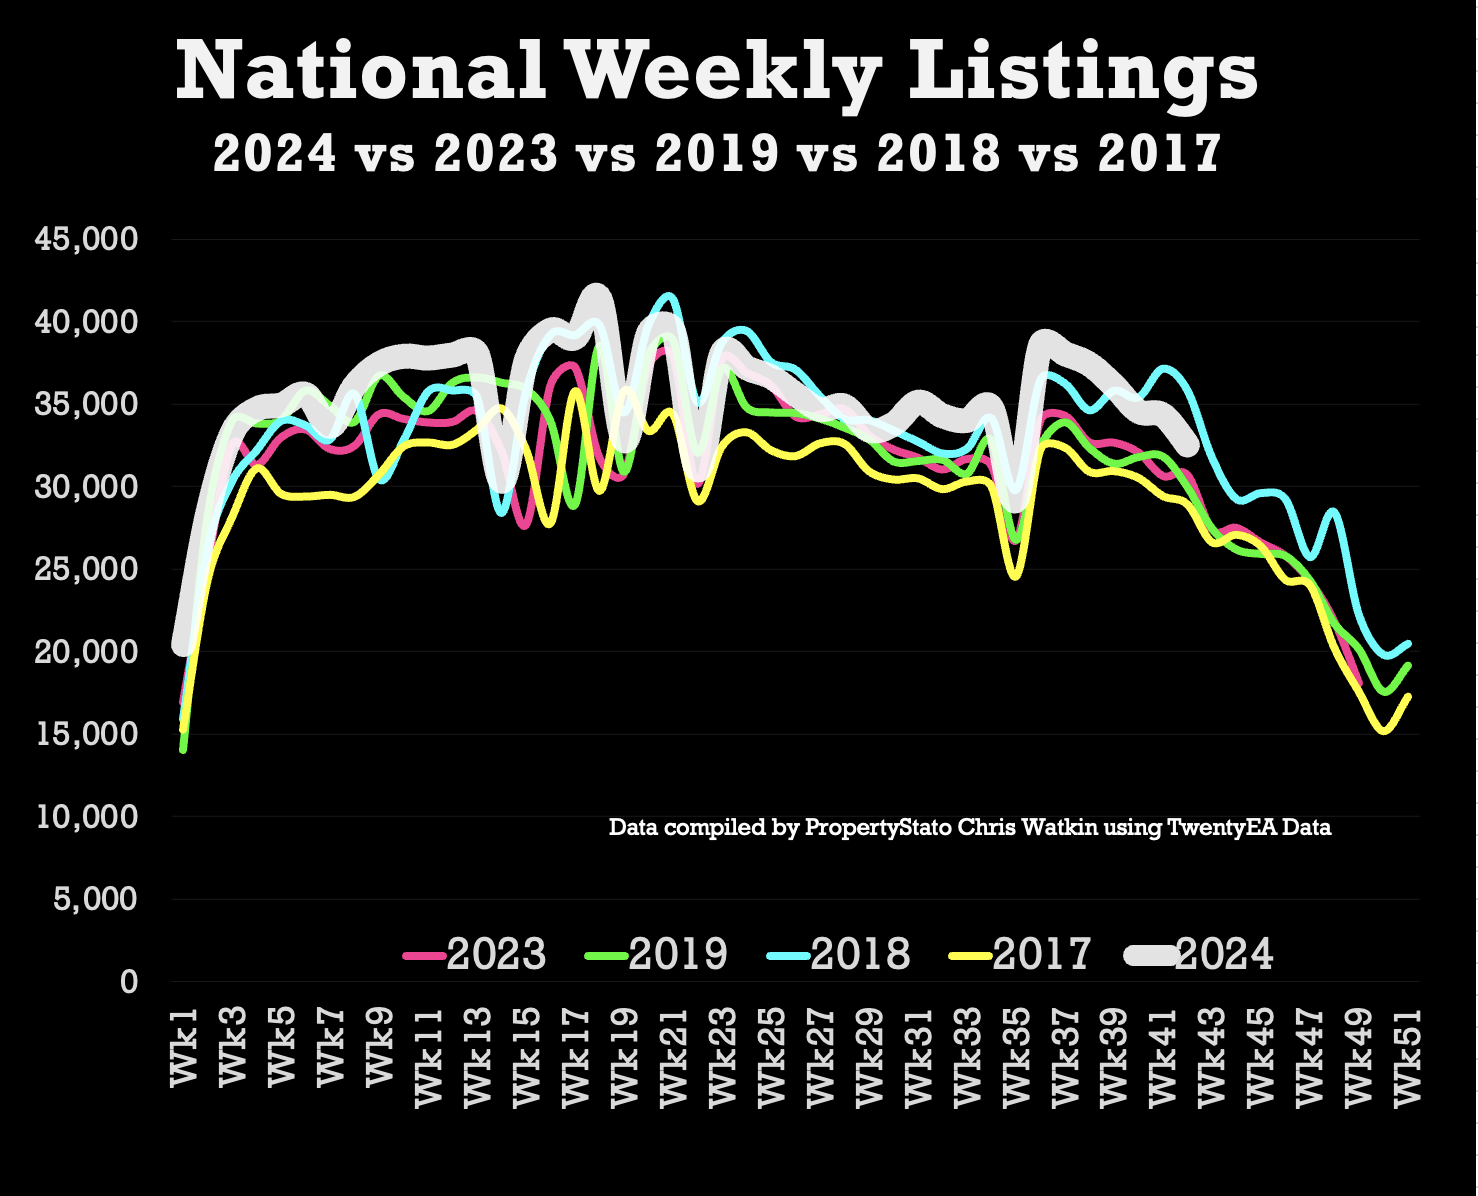
+ Listings (New properties coming on to the market) – 32.5k UK listings this week (week 42), a drop of 1.8k from last week. 7.5% higher for the 2024 YTD than 2017/18/19 YTD average. 6% higher than Week 42 of 2023.
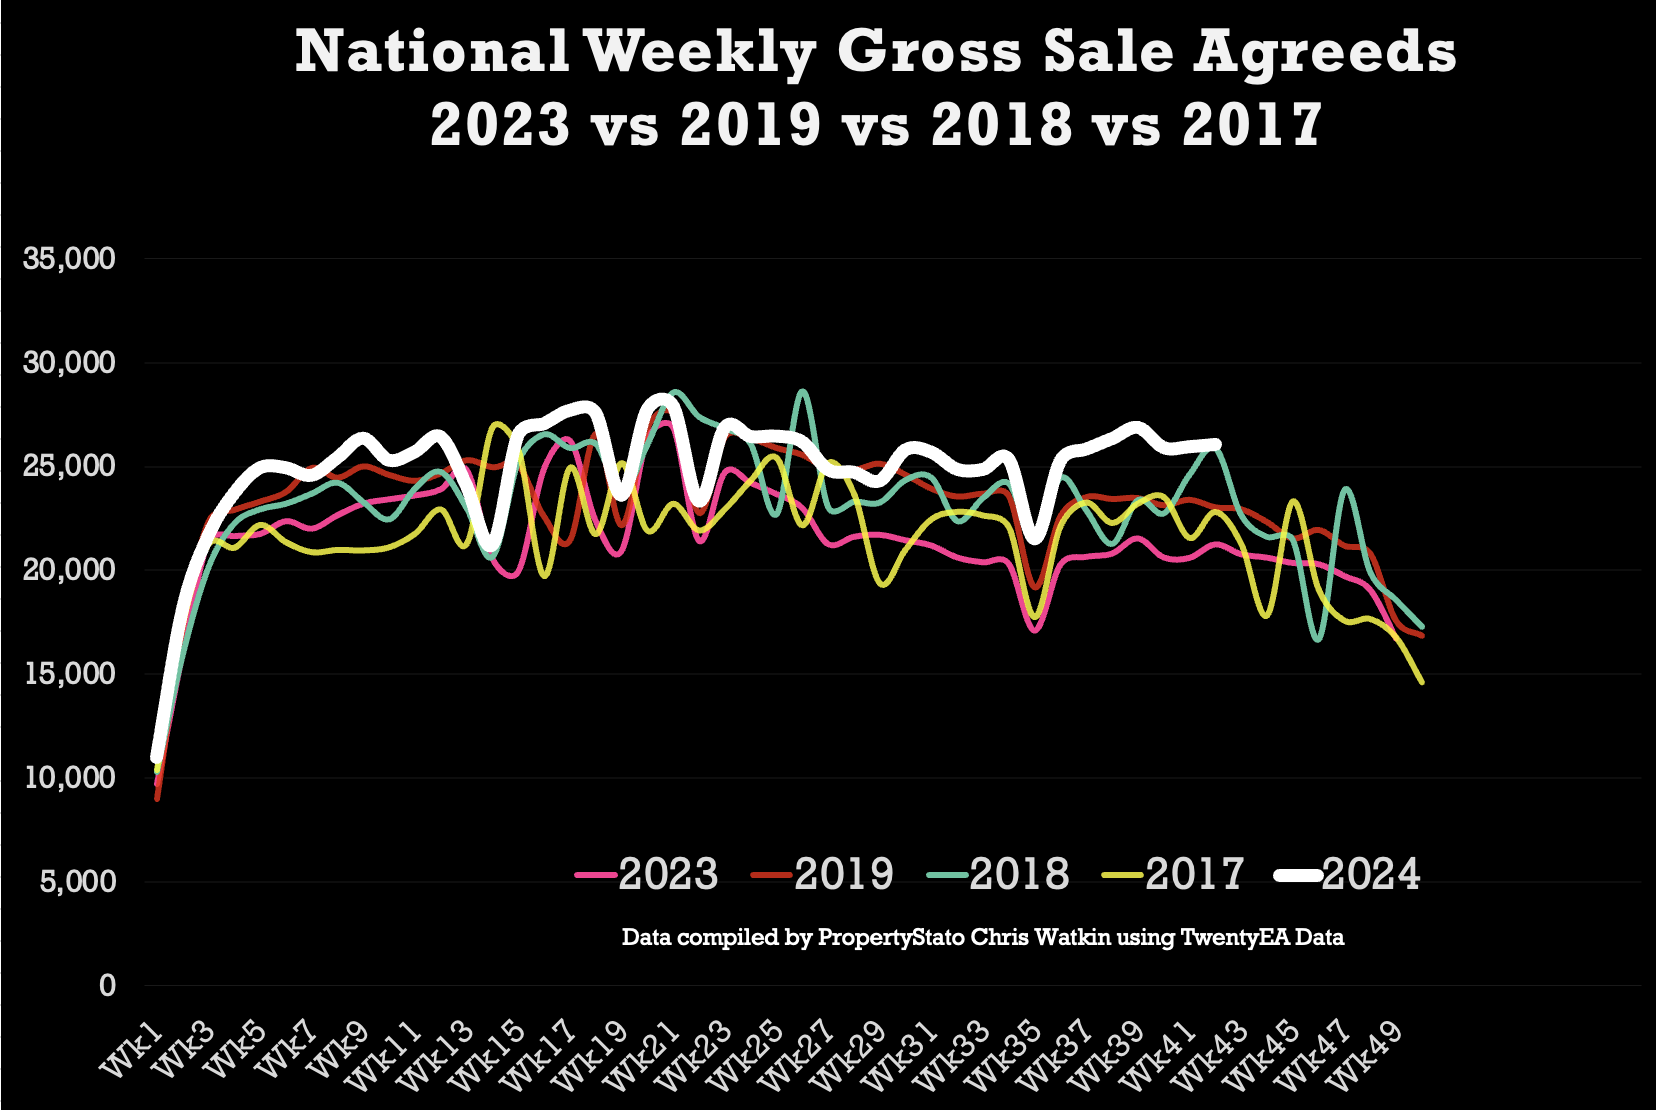
+ Total gross sales – 26k UK homes sold stc this week (Week 42). Same level as last week. 23% higher than the same week (week 42) in 2023. Also, 7.9% higher than 2017/18/19 YTD levels & 14.5% higher than 2023 YTD levels.
+ Net Sales – 19.5k this week (19.4k last week). 25% higher than the same week 42 in 2023 & still 17.2% higher YTD in 2024 compared to YTD 2023. + Percentage of homes exchanging vs homes unsold – Of the 1,222,925 UK homes that left UK Estate Agents books since the 1st Jan 2024, 654,081 of them (53.5%) exchanged & completed contracts (meaning the homeowner moved and the estate agent got paid). The remaining 568,844 (46.5%) were withdrawn off the market, unsold. In essence you a flip of the coin chance of actually selling, homeowners moving and the estate agent getting paid.
+ UK house prices – Final September figures suggest a slight jump in this important metric to £340/sq.ft. For comparison – August’s Figures for the Sale Agreed £/sq.ft was at £338/sq.ft, and July at £341/sq.ft. This means house prices are stable.
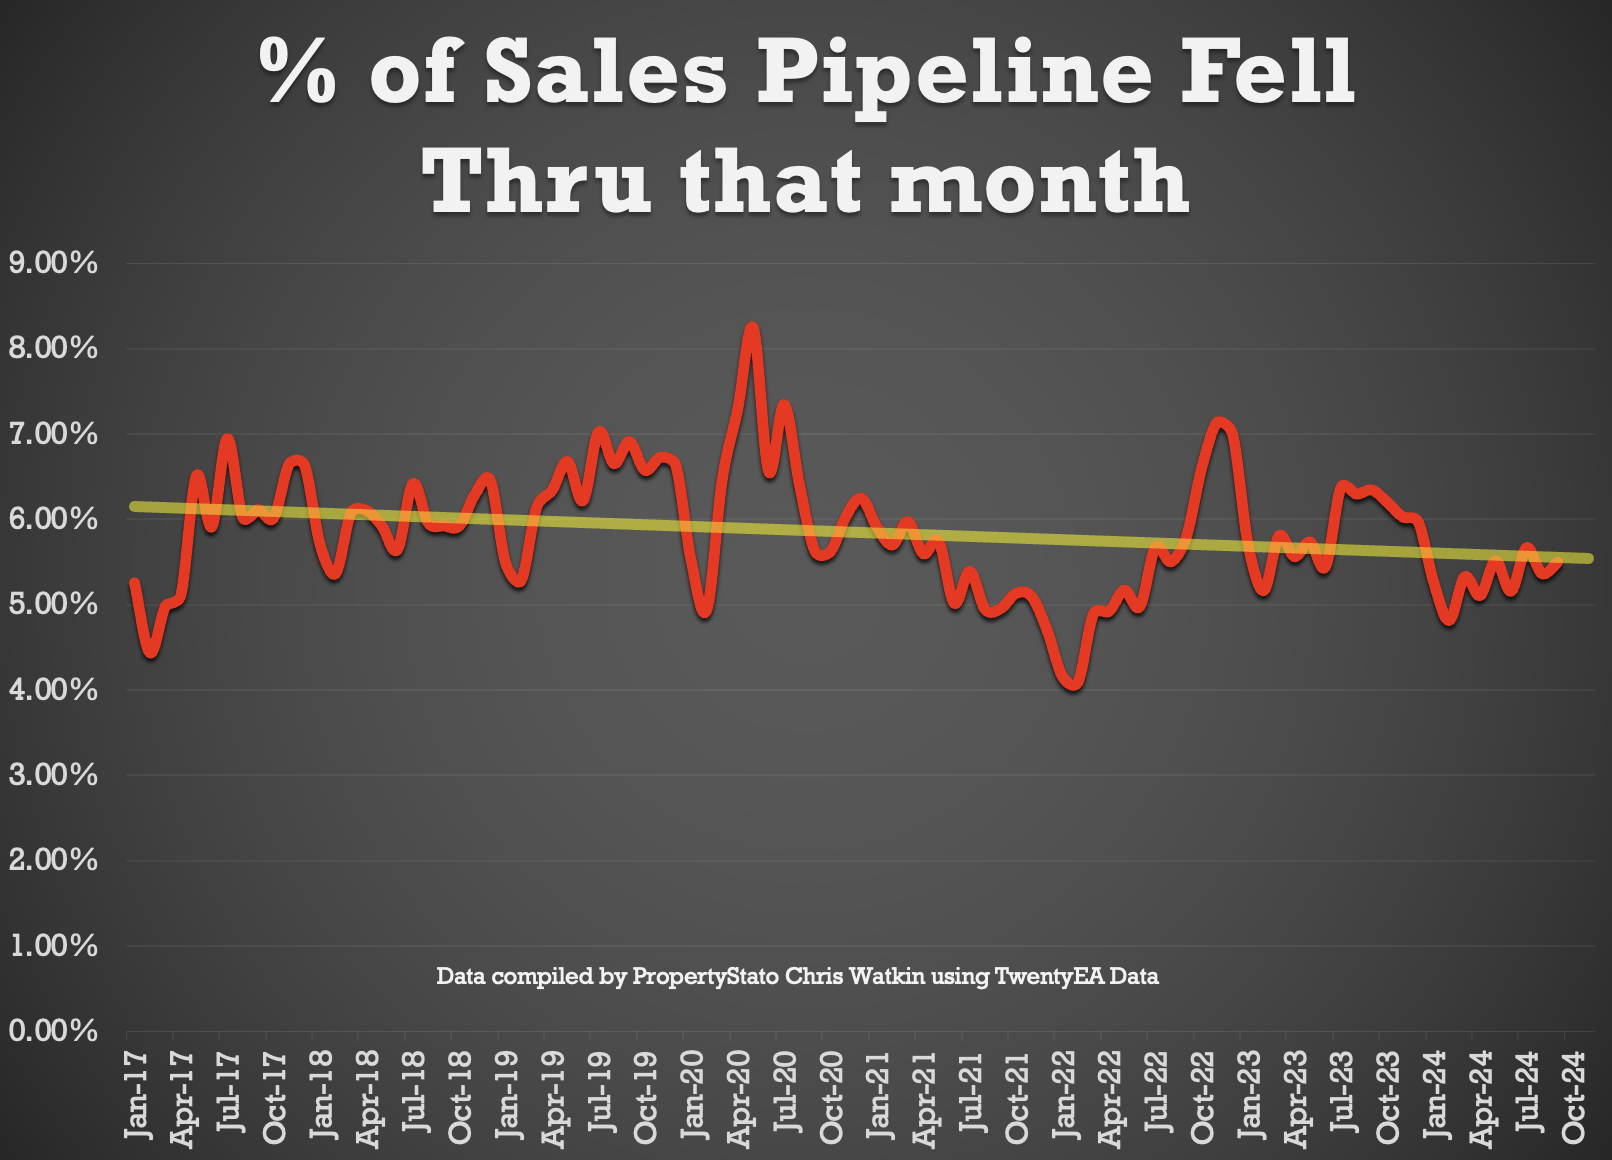
+ Sale fall-throughs – Agents lost 5.5% of their sales pipeline in September. For the week,Sale Fall Thrus (as a % of Gross sales Agreed) remained stable at 25.3% this week. The seven-year long-term weekly average is 24.2% and it was 40%+ in the two months following the Truss Budget in the Autumn of 2022.
Chris’s In-Depth Analysis (Week 42) :
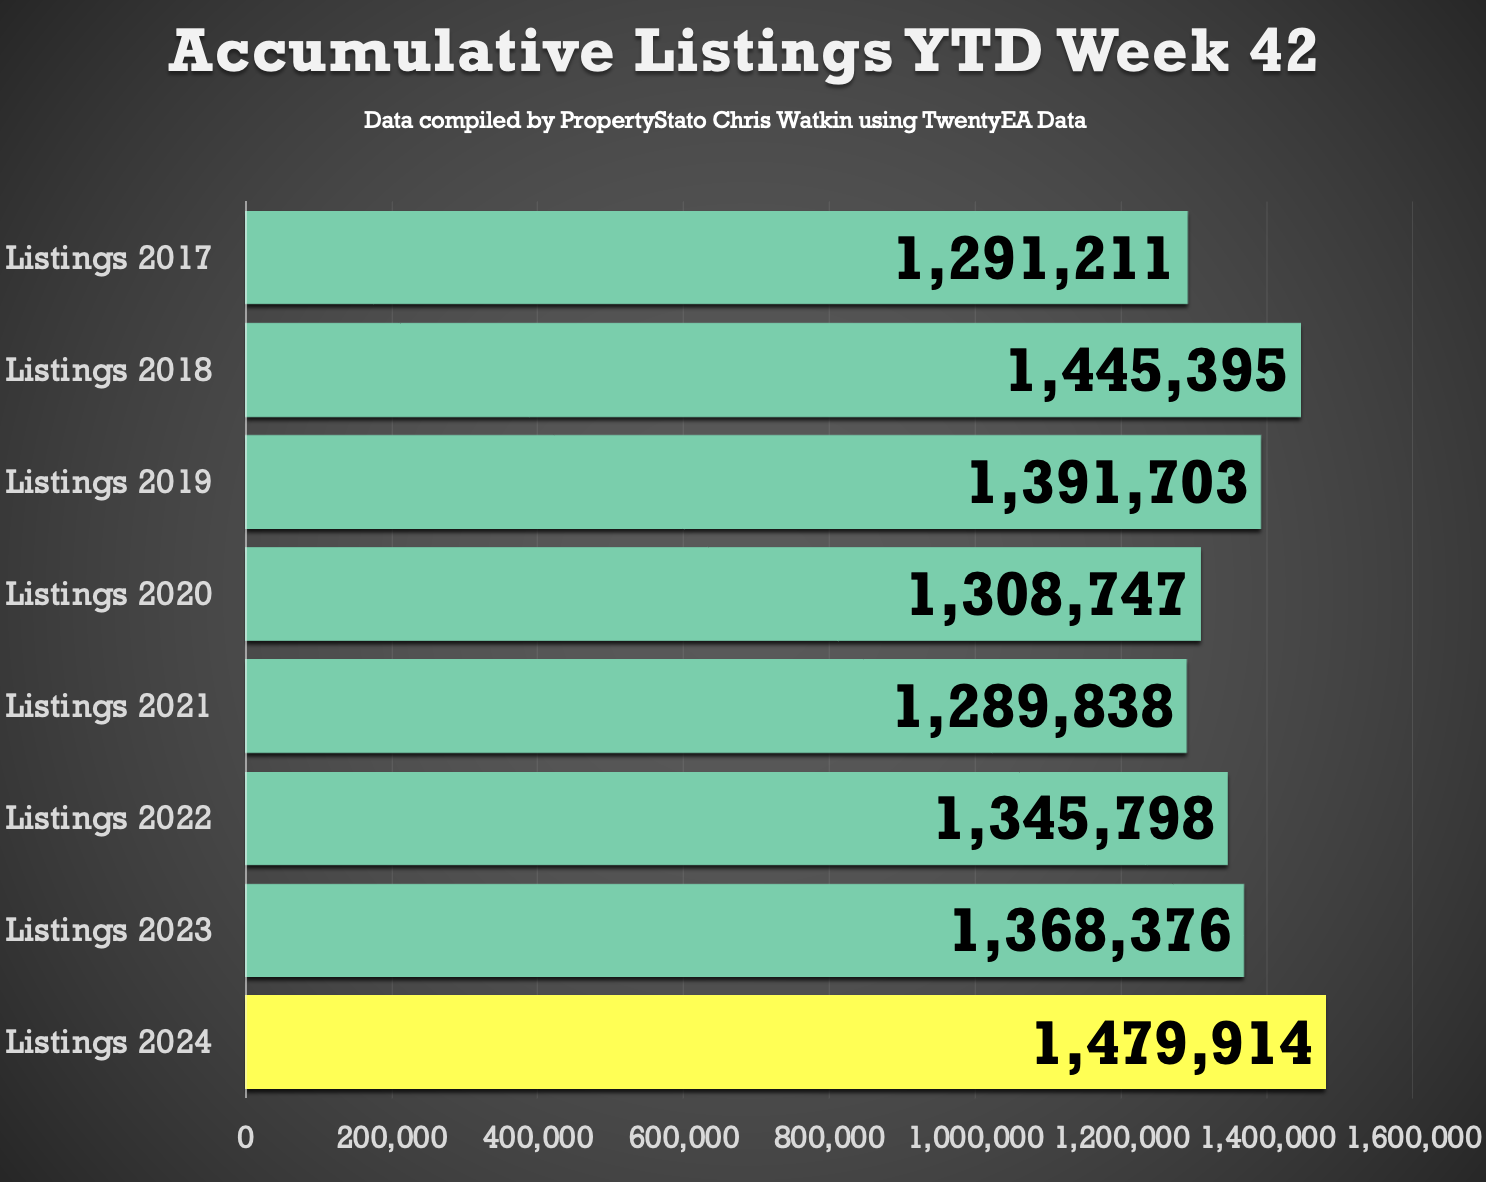
New properties to market: The UK saw 32,520 new listings. This year’s YTD listings stand at 1,479,914; 7.5% higher than YTD 2017/18/19 and 8.2% higher YTD 2023.
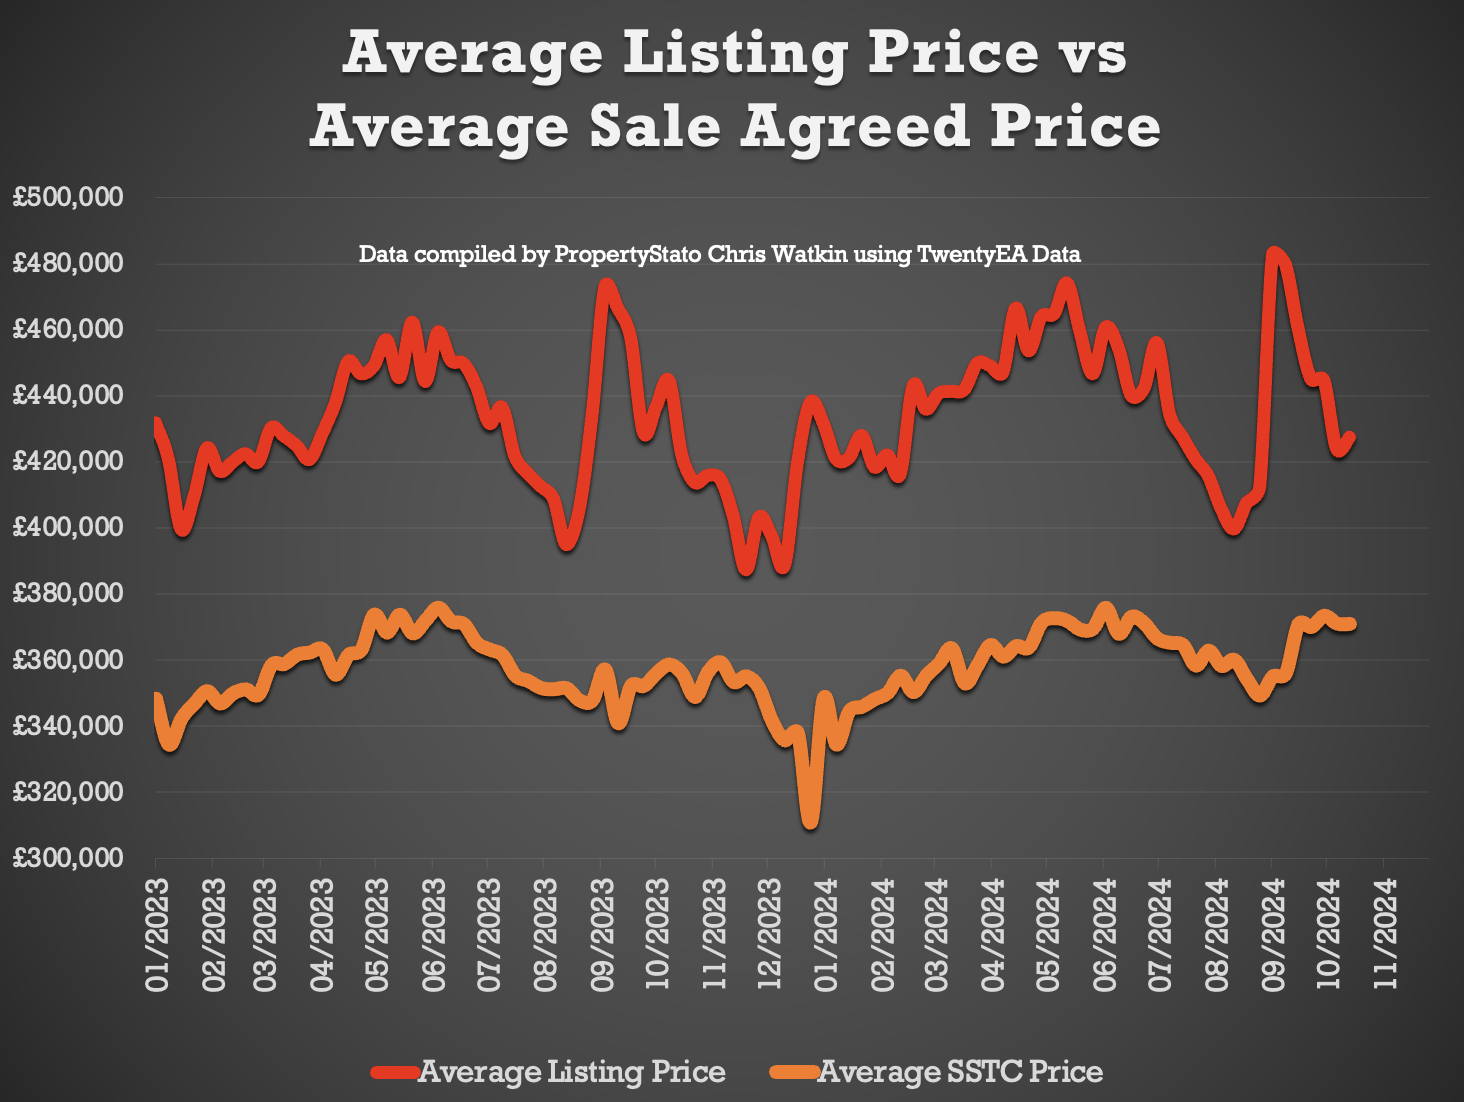
Average listing price: £427,444 (2024 weekly average – £439,783)
Average asking price of this week’s Listings vs Average Asking Price of the Properties that Sale Agreed this week: 15%. A Good low figure considering weekly 2024 average 22.2%)
Weeks Price Reductions: This week, 22,629 properties saw price reductions.
Percentage of residential sales stock being reduced: 14% of residential sales stock was reduced in September (long term average 10.6%)
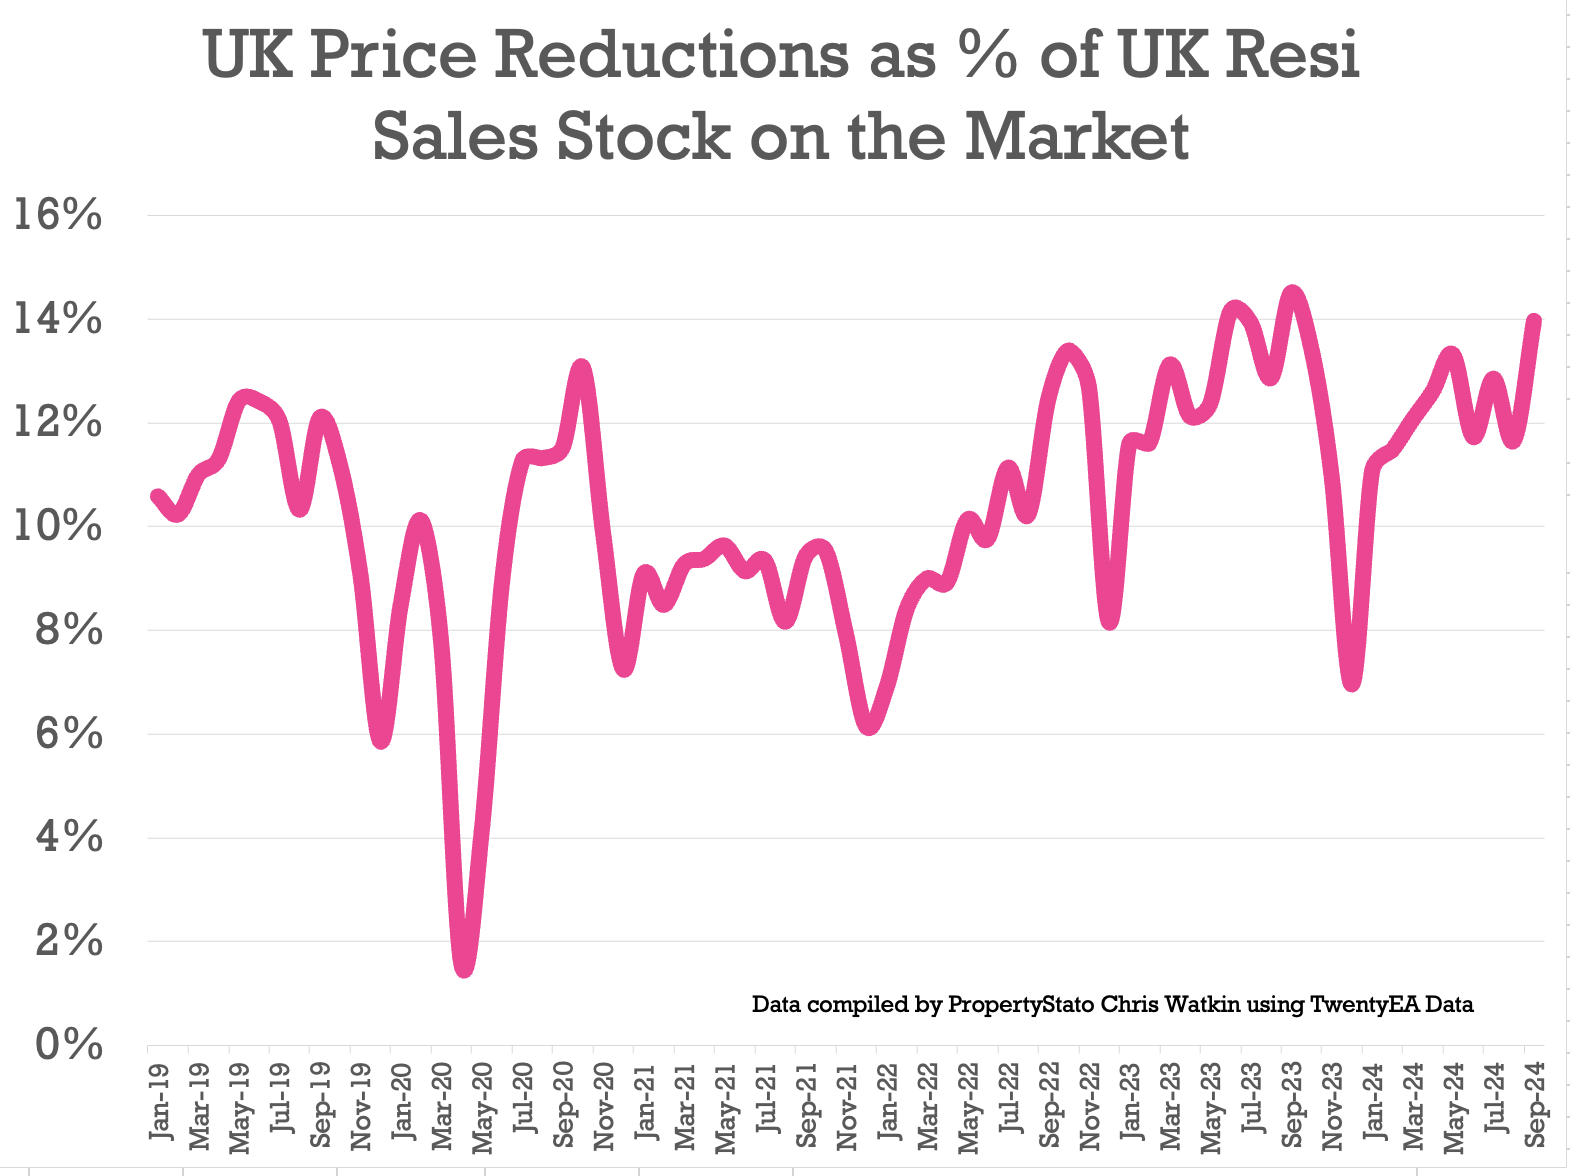
Average Asking Price for Reduced Properties this week: £389,912. (2024 weekly average – £400,199)
Gross Sales: 26,075 properties were sold stc last week. 2024 weekly average : 24,896 Gross Sales)
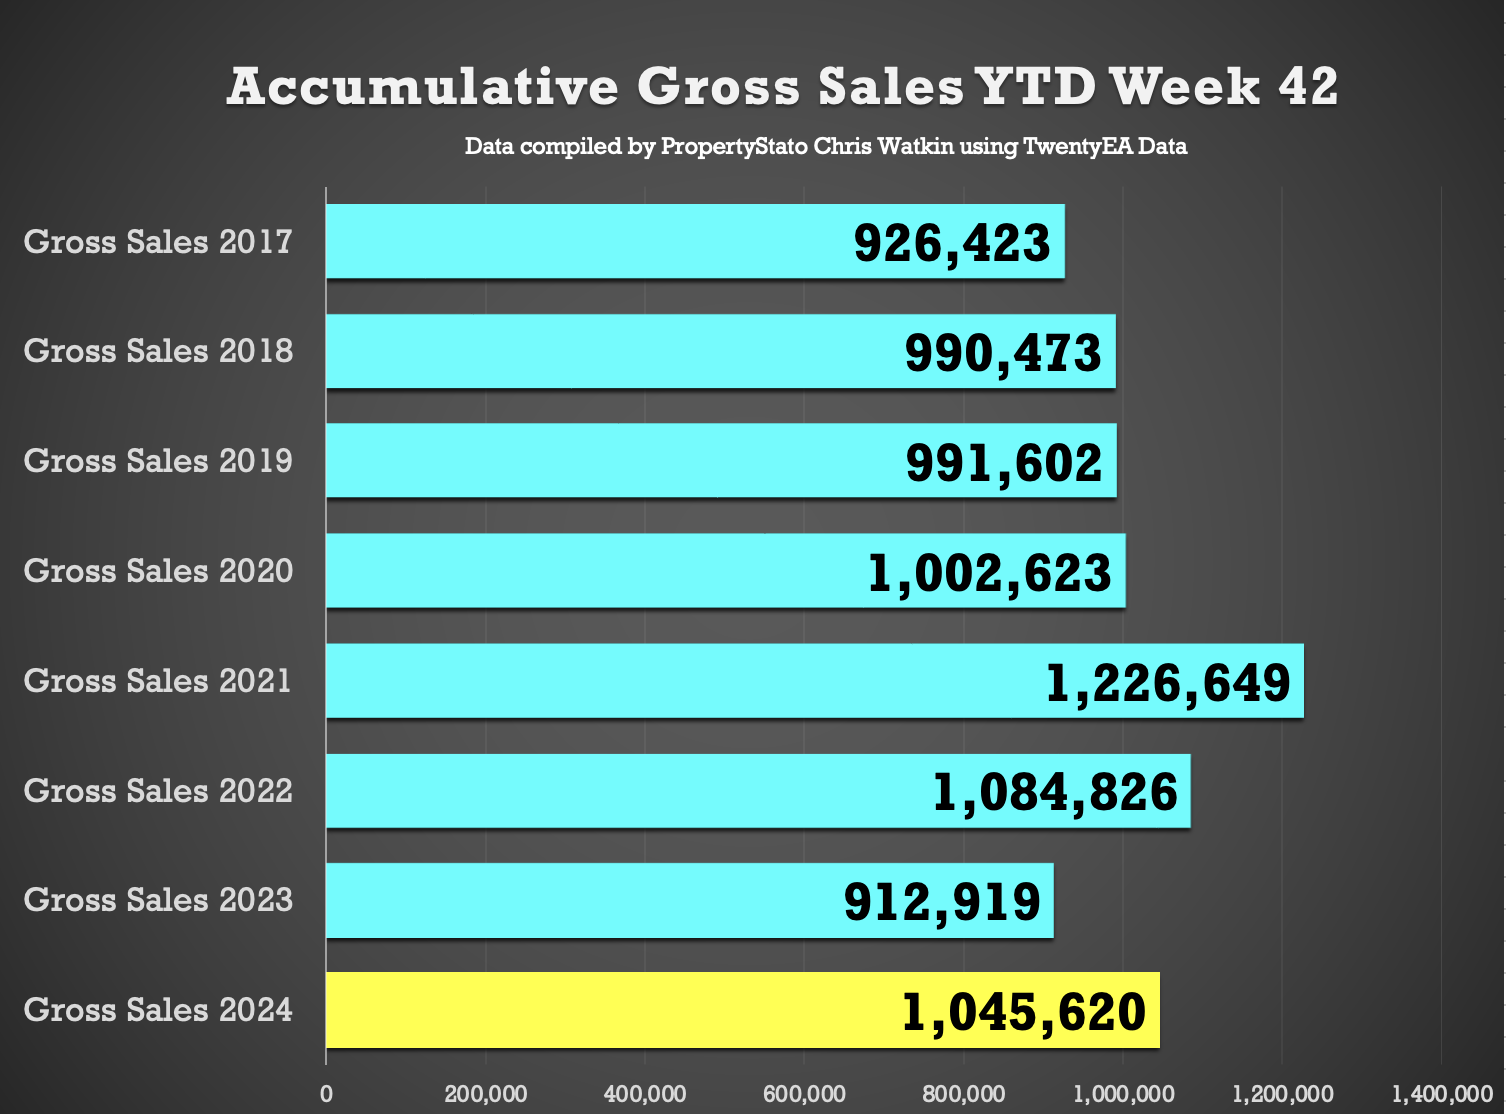
Accumulative Gross Sales YTD: The total YTD stands at 1,045,620, exceeding the average YTD Gross sales figure of 969,499 from 2017/18/19 and 912,919 in the same week 42 in 2023.
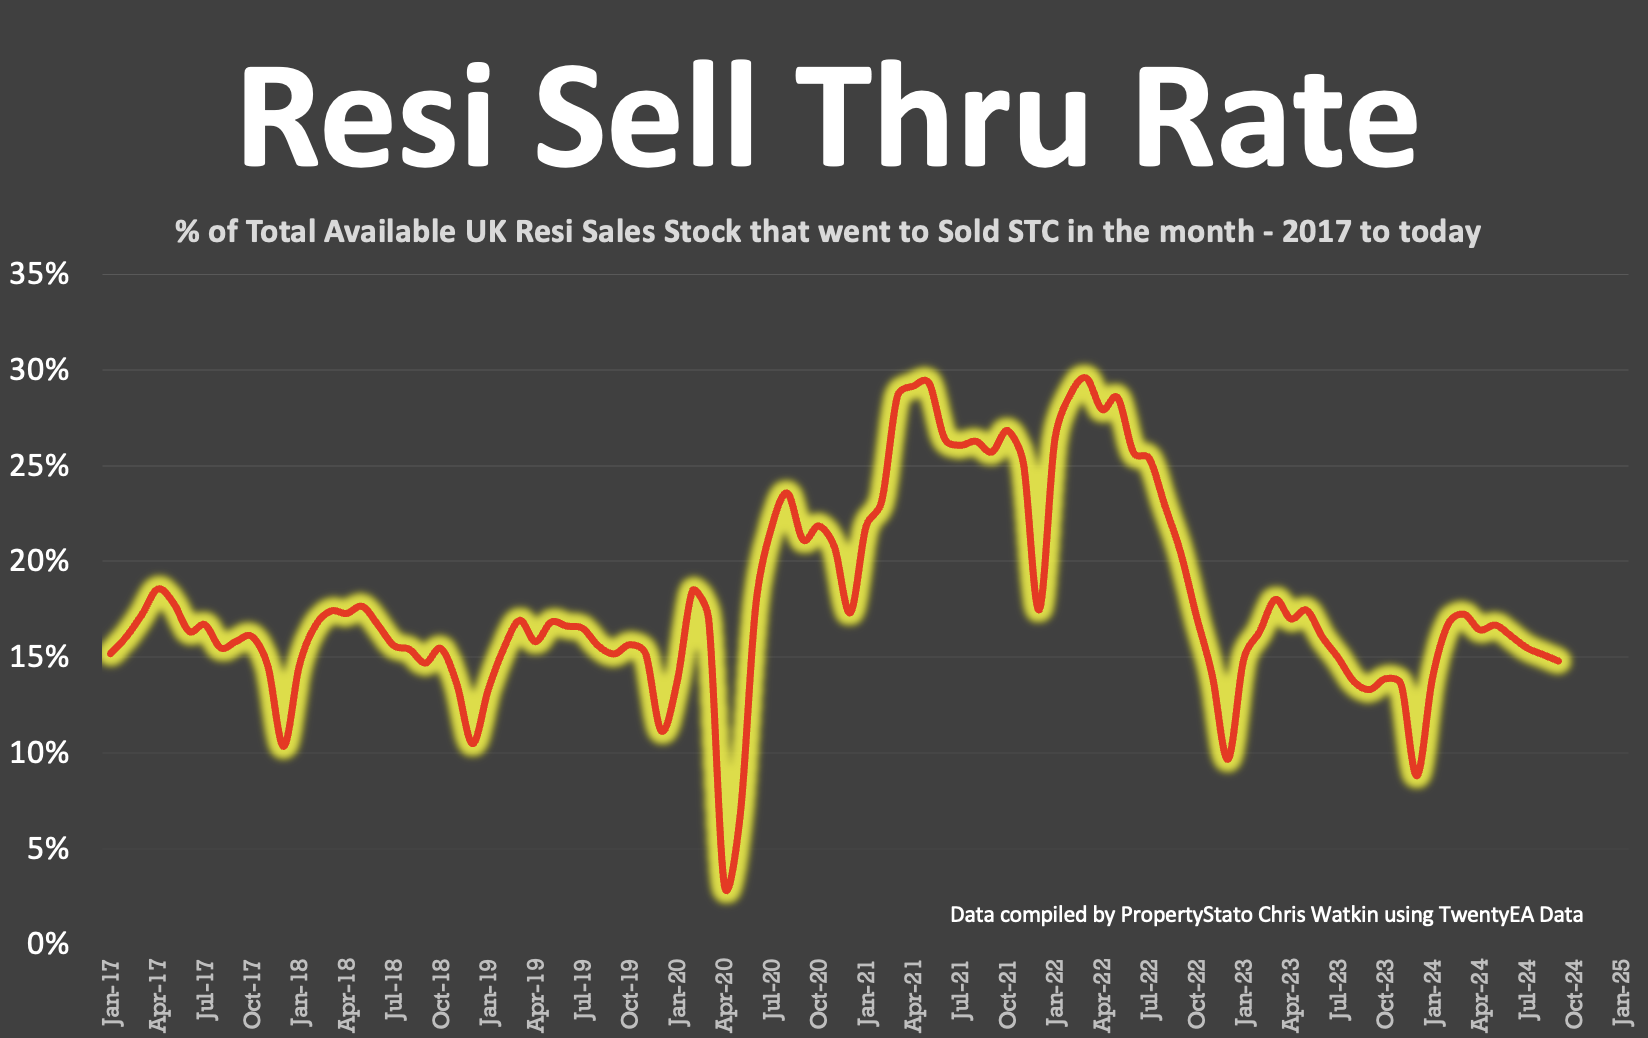
Sale through rate: (new monthly stat): UK estate agents sold 14.79% of their resi sales stock in Sept ’24. 2024 average is 15.83% & the 7 year long term average is 17.9% per month – yet don’t forget that was only in mid/late 20%’s in the crazy years of 20/21/22).
Average Asking Price of Sold STC Properties: Still staying in the £350/370k’s range (like has been for 2 years) at £371,117.
Sale Fall Throughs: Fall thrus this week dropped to 6,616. YTD weekly average is 5,817.
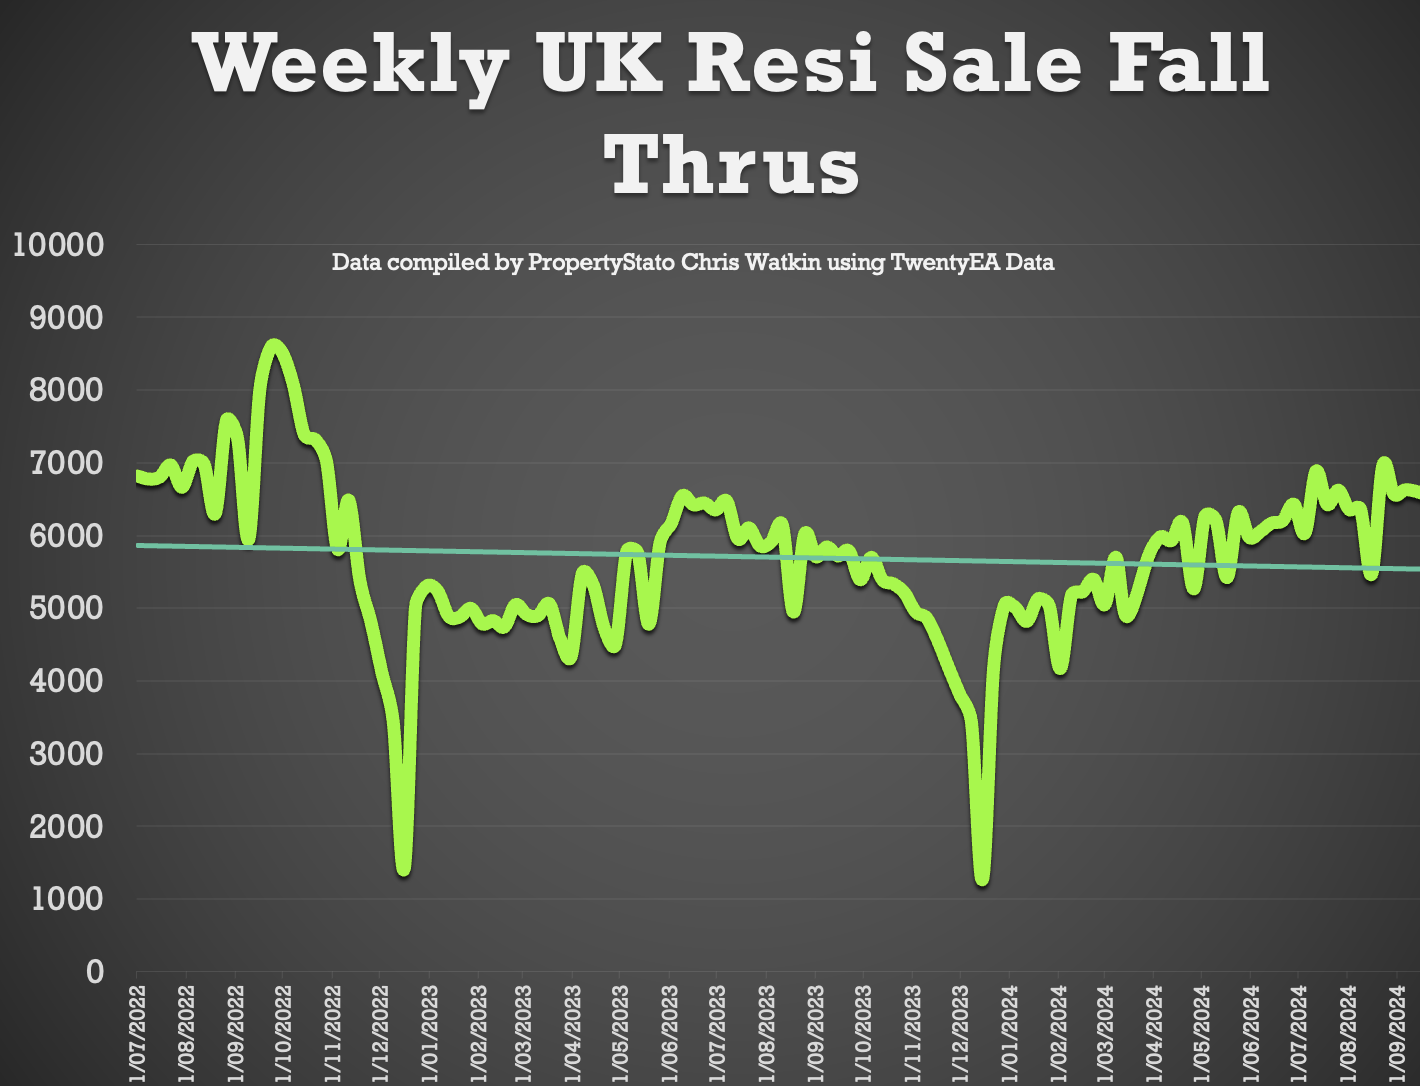
Sale fall through % rate: 25.4% for week 42. (Comparison – 25.6% for the last 3 months, whilst the long term 8 years average is 24.2% & it was 40%+ in Q4 2022 in the Truss budget!)
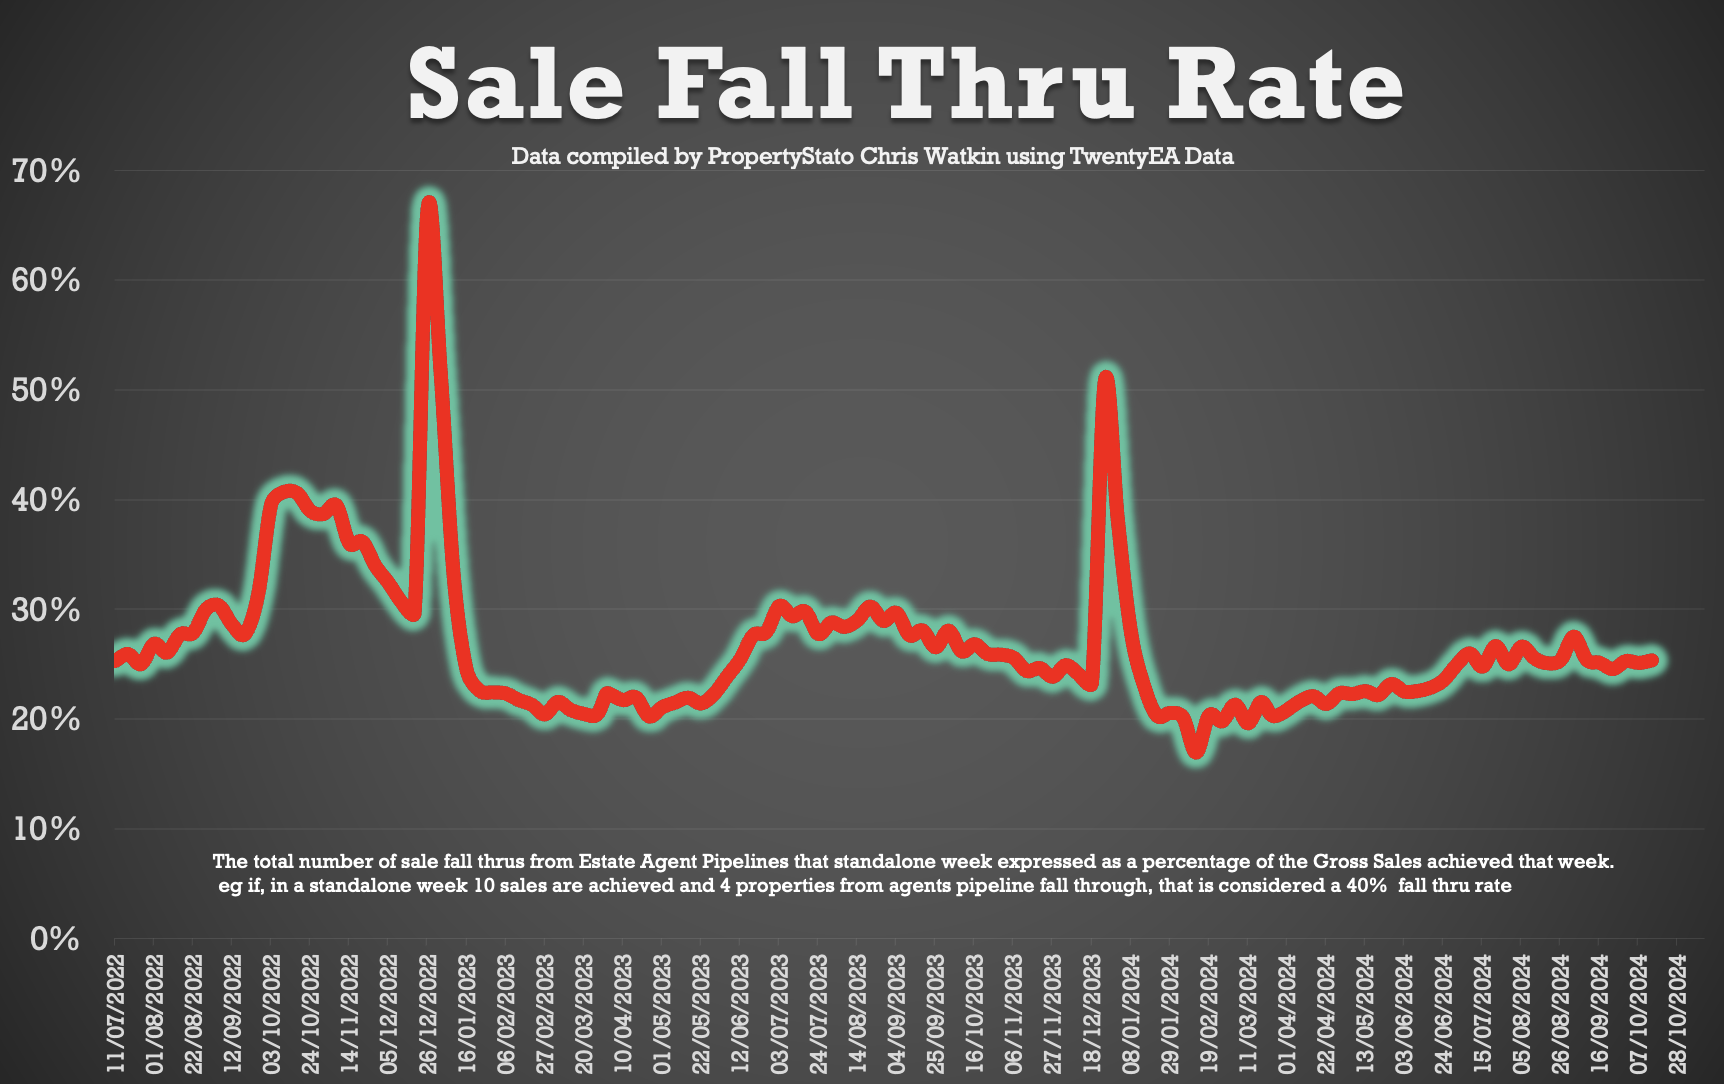
Sale fall throughs in September (New Monthly Stat) – 5.5% of the total Sales Pipeline fell thru in September. (8 year average 5.32%).
Net Sales (Gross sales this week less fall throughs this week) – up from last week slightly to 19,459 net sales. Last 3 month average – 18,879).

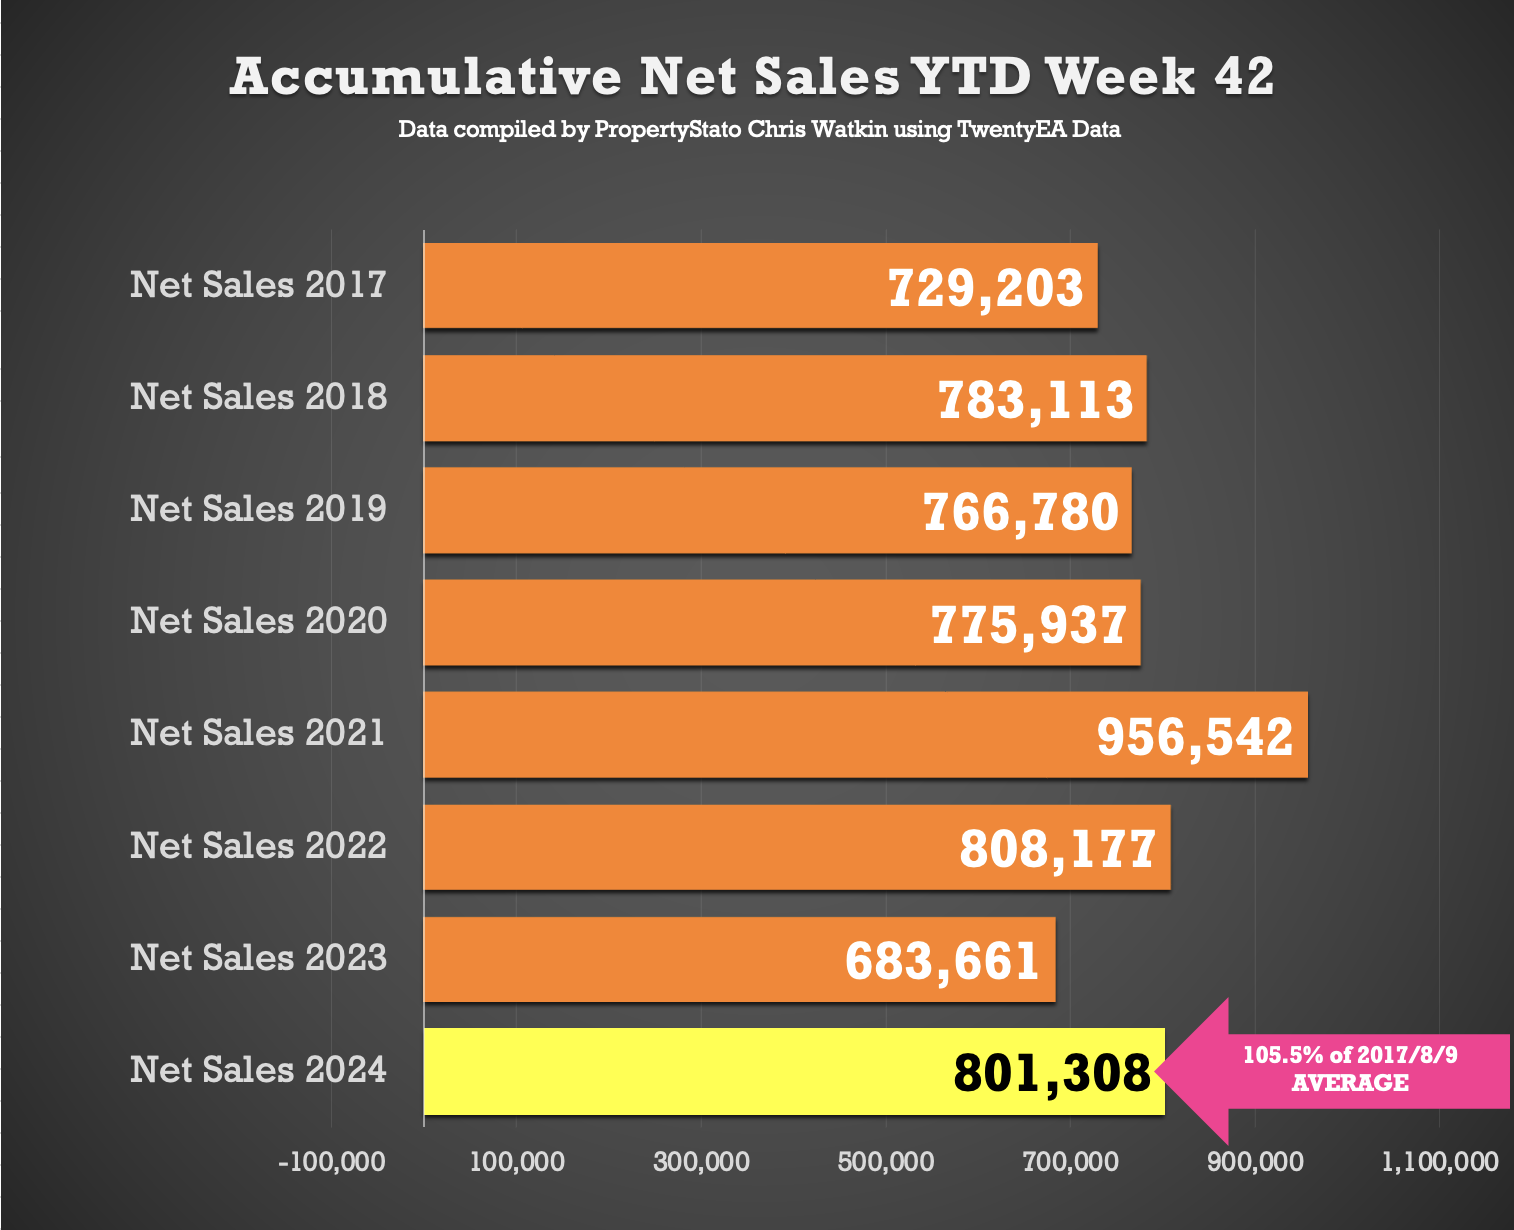
Accumulative Net Sales YTD: The total stands at 801,308, 5.5% higher than the 17/18/19 YTD Net sales average (759,699) and 17.2% higher than the YTD figure for 2023 for Net Sales (683,661)
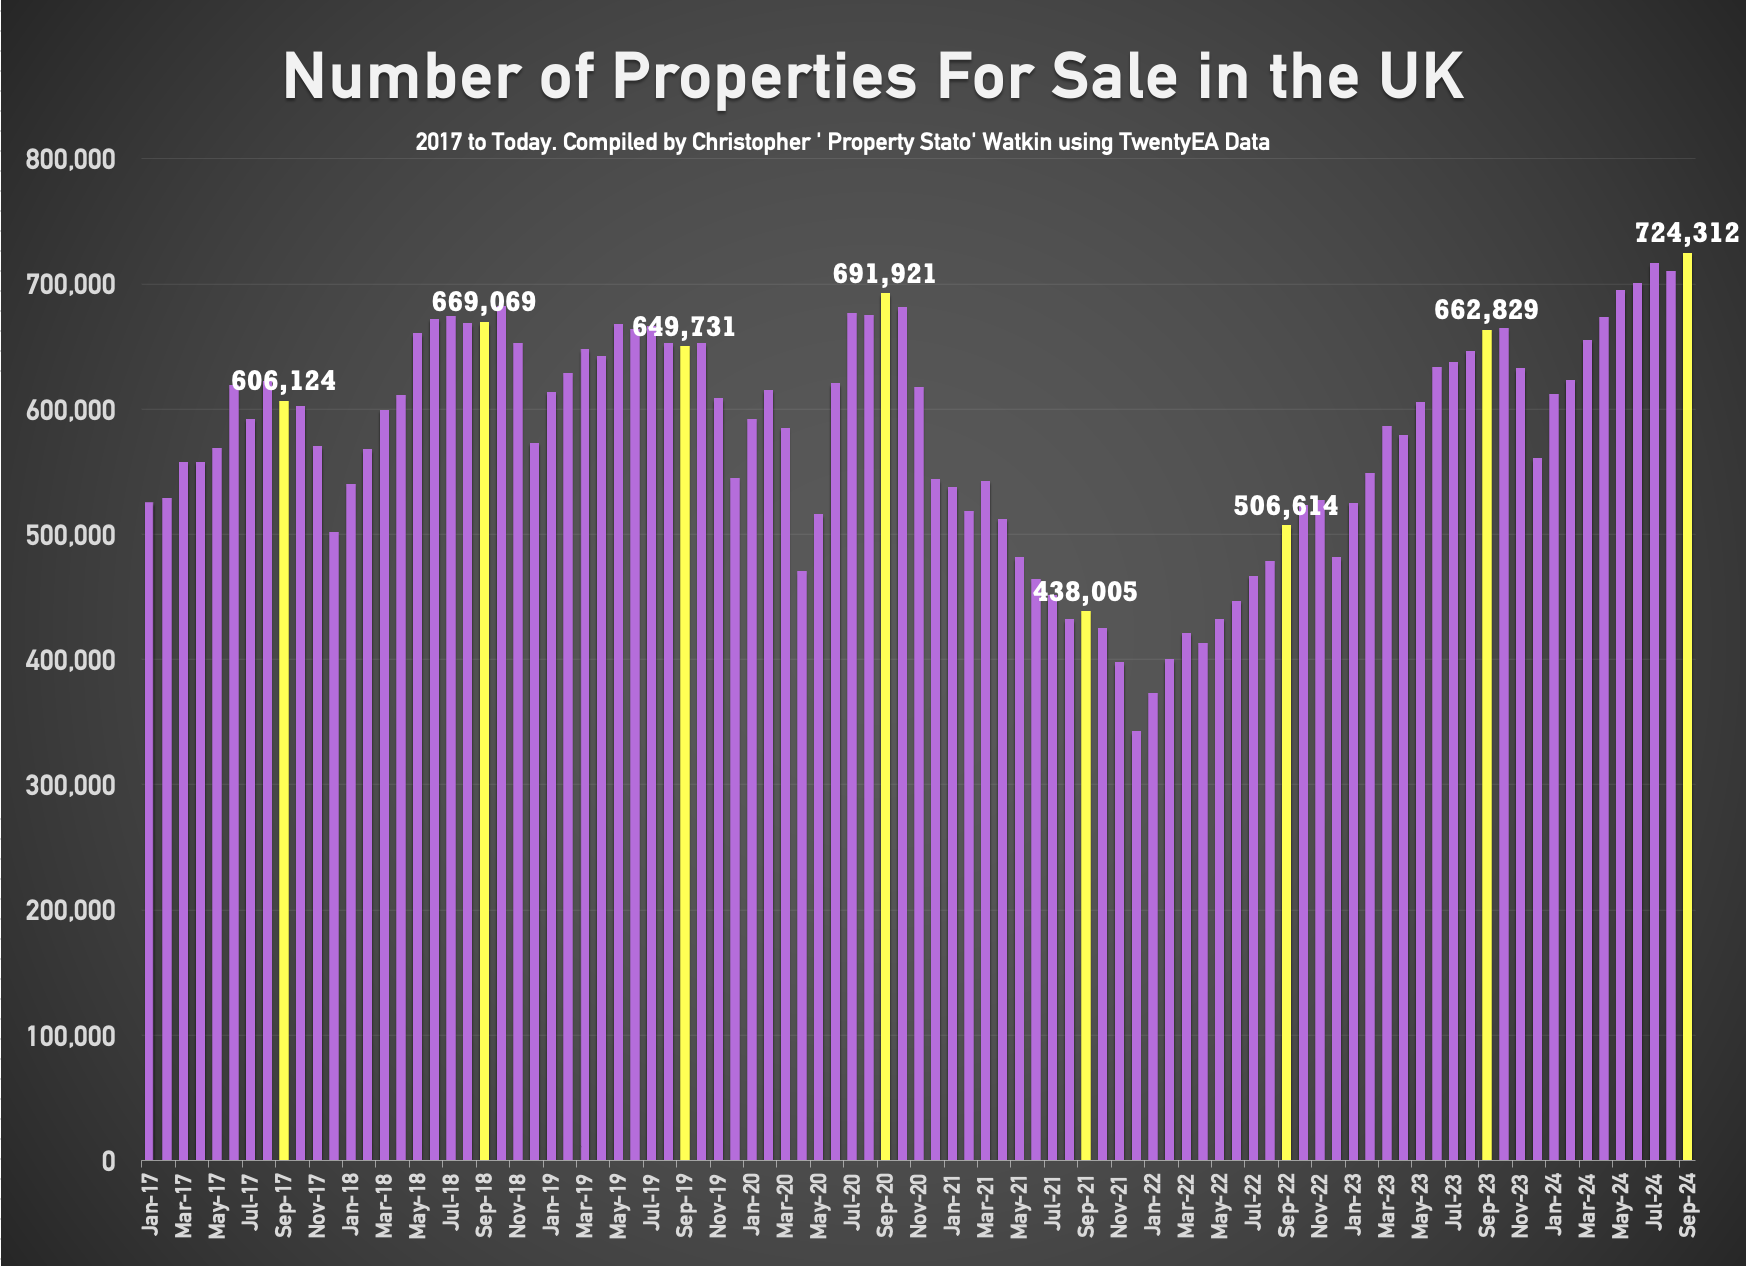
Resi Sales Stock on the Market (Monthly Stat) : 724k at end of Sept (up from 710k at end of Aug). For comparison, Sept ’23 – 662k, Sept ’22 – 507k, Sept ’21 – 438k, Sept ’20 – 692k, Sept ’19 – 650k
Resi Sales Sold STC Pipeline (Units) (Monthly Stat): 503k at end of Sept. For comparison, Sept ’23 – 410k, Sept ’22 – 483k, Sept ’21 – 550k, Sept ’20 – 489k, Sept ’19 – 368k

Local focus this week was Oxford

Comments are closed.